Is the U.S. stock market in an AI bubble? We certainly have the preconditions for one: a revolutionary new technology and spectacular profit growth for leading firms. And in the past two years, we’ve seen several bubble symptoms: increased retail participation in equity markets, rising market valuations, and absurdly high prices for certain stocks. However, the preponderance of the evidence does not support the diagnosis that the whole U.S. stock market is currently in a 1999-style bubble.
The missing ingredient is equity issuance. Starting with the South Sea Bubble of 1720, equity bubbles have featured waves of issuance. Today, there is no wave of IPOs, and existing firms are repurchasing equity instead of issuing it. Perhaps there’s an AI bubble in private markets (in which case I’d suggest getting out of private markets ASAP), but I don’t see one in public equity.
As of today, we are in an AI boom, but not yet in an AI bubble. However, it’s easy to imagine scenarios in which a bubble arrives in full force in the coming year.
Defining terms
Is the U.S. stock market in an AI bubble? To answer this question, we need to define these words.
Bubble: The word “bubble,” like the word “love,” has many meanings. Here’s my definition:1
A bubble is a self-sustaining rise in prices over time resulting in the speculative trading of an obviously overvalued asset.
AI Bubble: To me, “AI bubble” means “a bubble triggered by AI breakthroughs.” In contrast, many people use the phrase “AI bubble” to mean “U.S. corporations are overspending on AI.” That may be true, but I wouldn’t call that a stock market bubble if it doesn’t involve stock prices that are clearly too high. I agree that the level of current capex is one indicator that the market is overvalued.2 However, “overbuilding” is not a synonym for “bubble.”
U.S. Stock Market: I want to assess whether we see a bubble in the cap-weighted U.S. stock market as opposed to one isolated to certain market sectors. Today’s stock market contains a lunatic fringe of highly volatile and outrageously overvalued crypto/meme/cult stocks.3 But this fringe, while growing, is still small. In order to have a market-wide bubble, either the fringe must become a bigger fraction of the market, or the rest of the market must get crazier.
Diagnosing bubbles
To diagnose bubbles, here are my Four Horsemen of the Bubble Apocalypse:4
- First Horseman, Overvaluation: Are current prices unreasonably high according to historical norms and expert opinion?
- Second Horseman, Bubble beliefs: Do an unusually large number of market participants say that prices are too high, but likely to rise further?
- Third Horseman, Issuance: Are there unusually high levels of equity issuance by existing firms and new firms (IPOs) and unusually low levels of repurchases?
- Fourth Horseman, Inflows: Are unusually large numbers of new participants entering the market?
All four horsemen were clearly present in 1999/2000. Where are we as of December 2025?
- First Horseman, Overvaluation: Plausibly present, although it’s not a slam-dunk case.
- Second Horseman, Bubble beliefs: Present. Bubble beliefs emerged in late 2024.
- Third Horseman, Issuance: Not present.
- Fourth Horseman, Inflows: Present. We see increased buying by U.S. individual investors and by foreign investors.
Let’s examine each item on the checklist.
FIRST HORSEMAN: OVERVALUATION
The top panel of Figure 1 shows two measures of aggregate stock prices normalized by earnings. The dashed line is the Cyclically Adjusted Price/Earnings (CAPE) ratio, which is based on a trailing measure of inflation-adjusted earnings, and the solid line is the forward P/E ratio on the S&P 500. As of today, both measures are quite high, while still slightly below March 2000.
Figure 1: U.S. Market Valuations (top) and Expected Returns (bottom)
January 1990 to November 2025
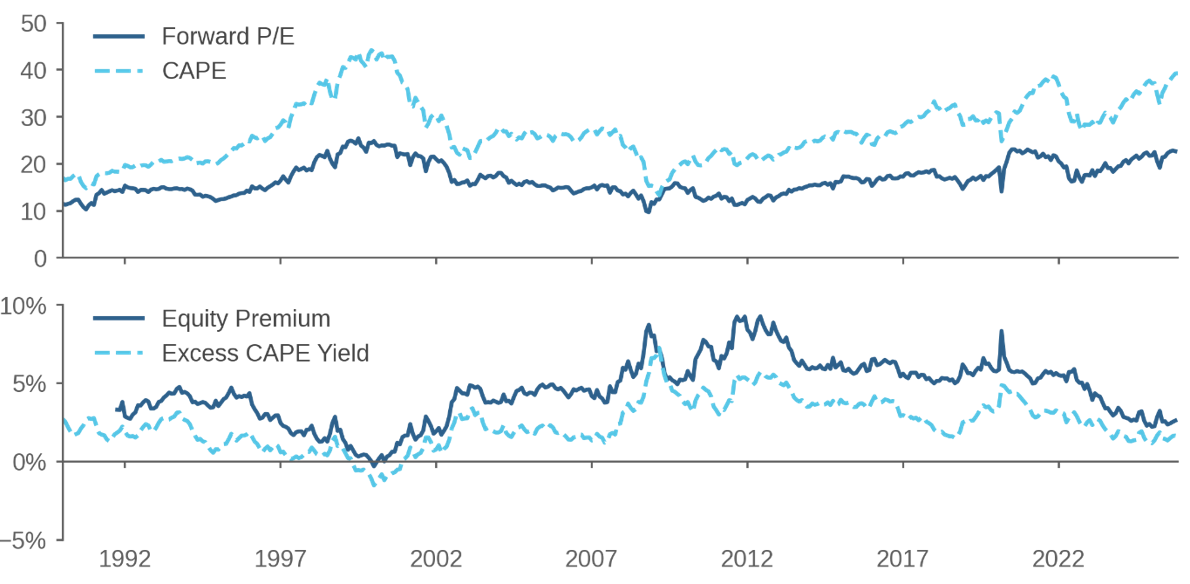
Source: Acadian based on data from the Financial Stability Report of the Federal Reserve Board of Governors and Professor Robert Shiller. For illustrative purposes only. As an alternative to P/E ratios, the bottom panel of Figure 1 shows two measures of the expected return on stocks minus bonds, i.e., the “equity premium,” after properly adjusting for inflation.5 The dashed line is Shiller’s “excess CAPE yield,” defined as the trailing earnings yield (inverse of CAPE) minus the real 10-year Treasury yield. The solid line is the expected real excess return on the S&P 500, i.e., the difference between the forward E/P ratio and the real 10-year yield. These measures show that the equity premium today is between 1.6% and 2.6%, relatively low but not zero or negative as during the tech-stock bubble. The bottom panel of Figure 1 does not scream “bubble” to me.6
During prior bubbles, leading academics publicly questioned market prices.7 In contrast, I’m unaware of recent public comments from respected financial economists stating that prices are obviously too high. I’ve previously provided a list of eminent financial economists, which I call the Flagrantly Overvalued Market Committee.8 Today, committee members do not seem to feel that the market is flagrantly overvalued.9
In private discussions with academic economists in recent months, I’ve encountered many who wonder about a bubble, but only a few who say “of course” there’s a bubble. In contrast, in 2006 with the housing market and in 2000 with the stock market, more economists seemed confident that a bubble was occurring.
SECOND HORSEMAN: BUBBLE BELIEFS
While academic economists do not seem ready to declare that the market is overvalued, market participants today have no such reticence. A substantial majority of both professional and amateur investors currently say that the U.S. stock market is overvalued.
As of October 2024, a long-running Yale survey revealed that a large majority of individual investors believed that the market was overvalued, and a large majority also believed the market would rise further.10 We saw a similar set of beliefs in April 2000.
Other more recent evidence shows widespread bubble beliefs. An October 2025 survey showed 67% of individual investors said the market was overvalued.11 In the November 2025 Bank of America Global Fund Manager Survey, the number of respondents agreeing that “global equity markets are currently overvalued” reached its highest level in the history of the survey since 1998.
THIRD HORSEMAN: ISSUANCE
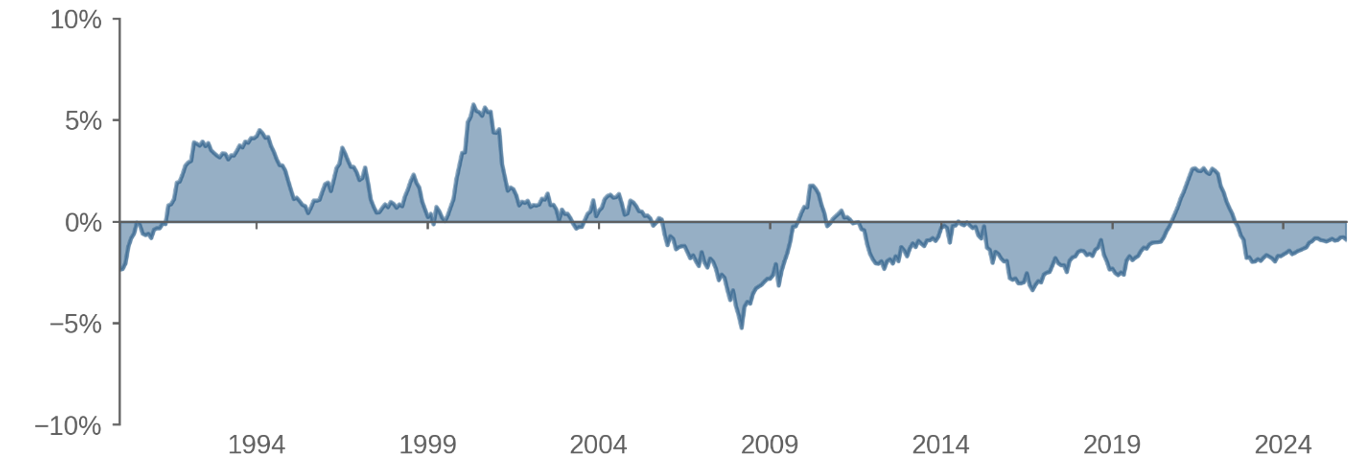
Firms are smart money, and when firms sell equity, that’s a sign that equity is overpriced.12 Currently, we do not see positive net issuance across the entire market – i.e., firms are not net sellers of equity to external investors. This fact is evident in Figure 2, which shows the sum of dollar net issuance in the past year, normalized by the stock market’s total capitalization.13 For much of the 1990s, issuance was positive, and at the peak of the bubble in 2000, issuance was more than 5% of market cap, meaning that 5% of the market had been newly issued in the past year. After that bubble collapsed, issuance turned negative and has largely remained so, with the notable exception of the COVID bubble of 2021, when issuance peaked above 2%. But today, issuance is decidedly negative at -0.9%; the supply of shares is shrinking. Ballpark figures, the value of U.S. common stock is around $65T, and every year companies are buying around $500B more equity than they’re selling.
Figure 2: 12-Month Net Issuance as Percent of Market Cap
January 1990 to November 2025
Source: Acadian based on data from CRSP® (Center for Research in Security Prices. Graduate School of Business, The University of Chicago. Used with permission. All rights reserved. Crsp.uchicago.edu.) For illustrative purposes only.Historically, bubbles in different countries (Britain, Japan, the U.S.) have involved waves of issuance, including waves of new firms entering the stock market. If there were a bubble, we’d expect a wave of IPOs. We saw a wave of IPOs in 2021, so why no wave today?
FOURTH HORSEMAN: INFLOWS
Bubbles involve buying by new market participants. Today, we see increased buying by two groups: foreign investors and U.S. retail investors.
Foreign money poured into the U.S. stock market in 2025, with only a slight pause amid the tariff-related turmoil of April 2025. Data from the Treasury International Capital System shows that net foreign purchases of equity securities summed to around 1% of all U.S. shares outstanding in the past year. U.S. exceptionalism is alive and well.
One set of eager buyers comes from South Korea, which was 9% of foreign inflows. Korean retail investors are certainly contributing to speculative madness in corners of the U.S. equity market.14 If and when there is a full-blown bubble in the U.S. stock market, I’d expect Korean retail investors to be right at the center of it.
U.S. retail investors are also increasingly buying equities. First, retail trading volume as a percent of total equity volume has risen, perhaps to “an all-time high.”15 Second, we see ample evidence of flows into retail investment vehicles. JPMorgan Chase showed that dollars flowing from bank accounts to retail brokerage accounts in March 2025 were even higher than in February 2021.16 Leveraged ETFs have also attracted substantial inflows.17 Consistent with the increase in retail trading activity, retail brokerage stocks have soared of late.18
How close are we to 2000?
To summarize, today, we have three horsemen present. Now, maybe three out of four is enough for you, but I put more weight on issuance and overvaluation as bubble indicators, because these variables are easier to measure and compare across time. Since overvaluation is a weak yes and issuance is a firm no, I say no bubble today.
How close are we? Let me give you a visual representation.
Figure 3 shows CAPE on the horizontal axis and net issuance on the vertical axis. Each point represents a calendar month between January 1990 and November 2025. Notice the positive correlation between issuance and CAPE: When CAPE is high, firms sell equity, and when CAPE is low, they repurchase it. In economics, we call that an upward-sloping supply curve: when prices go up, supply goes up.
Figure 3: Net issuance vs. CAPE
January 1990 – November 2025
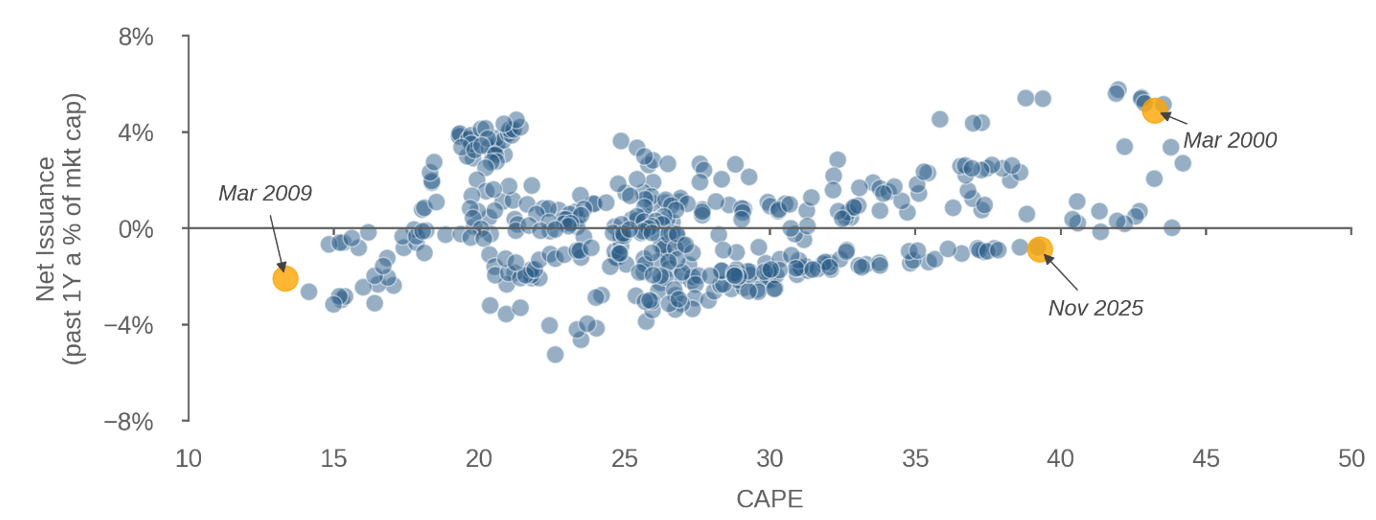
Source: Acadian based on data from Professor Robert Shiller and from CRSP® (Center for Research in Security Prices. Graduate School of Business, The University of Chicago. Used with permission. All rights reserved. Crsp.uchicago.edu.) For illustrative purposes only.Now let’s consider the two extreme points, March 2000 and March 2009. In 2000, equity prices were high. How did firms respond? Just as Adam Smith predicted in 1776: “the quantity brought thither will soon be sufficient to supply the effectual demand.” We can describe the events of 2000 as firms bringing supply “thither” to eager purchasers. March 2000 was the worst time to buy equity, when CAPE and issuance were both high. The best time was March 2009, when CAPE was low and the smart money was buying.
Where are we as of November 2025? According to Figure 3, we’re not that far from March 2000. It wouldn’t take much to push us up and to the right, firmly into bubble territory.
What would an AI bubble look like?
Suppose we eventually have a full-blown AI bubble. Here’s what we might see:
- A calendar crowded with IPOs (at least one every business day), with many IPOs doubling on their first day of trading.
- SpaceX, OpenAI, and Anthropic all go public (as suggested by recent reports).19
- The Magnificent Seven, in order to fund their massive capex, issue $1T in new equity.
- The NASDAQ 100 doubles in a year (as NASDAQ did in 1999).
- CAPE rises to 80 (similar to Japan’s CAPE in 1989).
Many of these events could happen in 2026; they are not far-fetched. But they haven’t happened yet.
Perhaps I’m wrong, and we’re already in the midst of a raging AI bubble. If so, it’s a pretty weird bubble, with the IPO market unaccountably sedate, and firms that plan to spend trillions on capex failing to raise equity on favorable terms.


