
World Equity Allocations: Global in Name Only?
Key Takeaways
- The world equity benchmark that underlies many institutional investors’ global portfolios could pass for a U.S. large-cap core supplemented by regional satellite allocations.
- We see reason to challenge the expected return and risk assumptions that are implicit in that baseline positioning.
- Investors who are concerned about historically high concentration within the global market portfolio should consider strategies that would moderate that concentration, such as overweighting non-U.S. equities, to restore more comforting fundamental and risk characteristics.
Table of contents
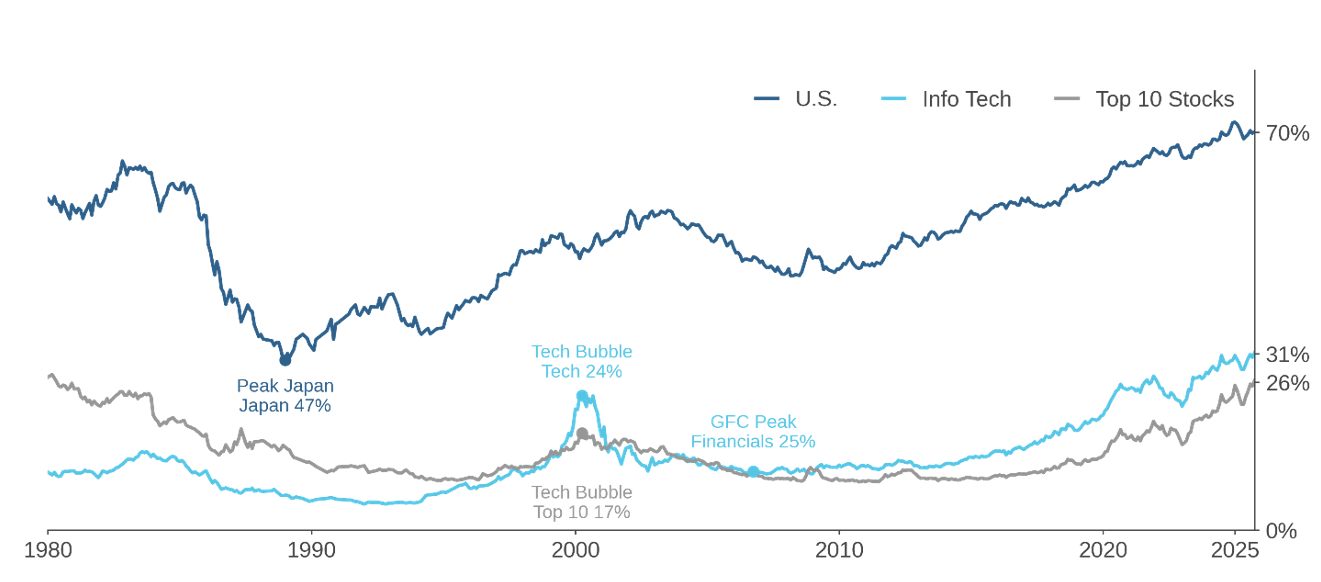
Asset owners who build their equity exposure through allocations to global managers are likely holding portfolios that have grown highly concentrated in terms of country, sector, and individual stock exposures. That reflects the evolution of the global equity market portfolio, which now could pass for a U.S. large-cap core supplemented by regional satellite allocations. In Figure 1, the dark-blue line traces out the weight of the U.S. in the MSCI World Index over nearly half a century, including its steady ascendence after the global financial crisis (GFC). Not only is the benchmark unusually concentrated in the U.S., but its weight in technology exceeds that from the peak of the dot-com bubble (light-blue line).1 In recent years, these concentrations have been exacerbated by the Magnificent Seven, whose dominance has also lifted the weight of the largest ten stocks to levels last seen in the 1980s (gray line).
Figure 1: MSCI World Index – Facets of Concentration
Through September 30, 2025
Is the Benchmark Wrong or Just Unusual?
Even though the current composition of the benchmark might look unusual, to an academic economist, it isn’t inherently problematic.2 The Capital Asset Pricing Model is silent about the market portfolio’s concentration in countries, sectors, or stocks. The market portfolio is efficient, whatever its composition. Even in the messy real world, this abstract view is a valuable starting point because it sets an appropriately high evidentiary standard to justify an active tilt away from the benchmark.3
Nevertheless, reflecting on the state of markets in late 2025, we believe that there is indeed a persuasive case for curbing the U.S. weight in global allocations.
Expected Returns
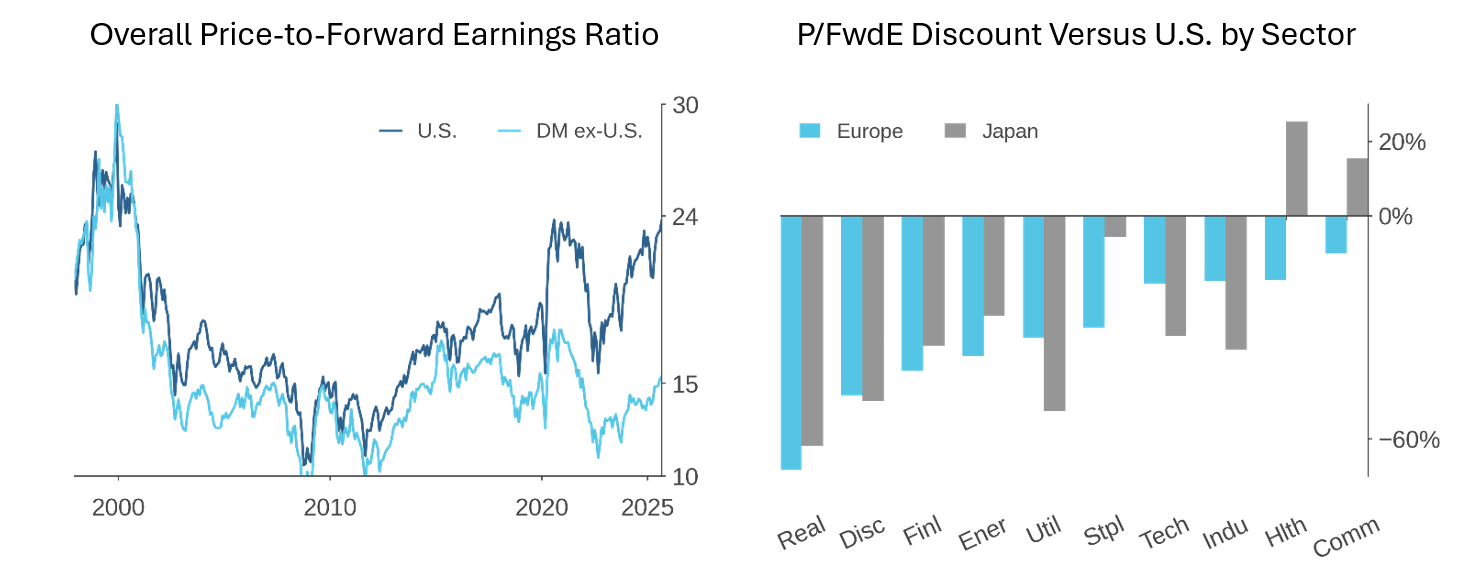
First, valuations of U.S. equities give us pause. In Figure 2, the left panel shows that U.S. forward P/E, near 23, has risen back towards levels from 2021 (as has the CAPE), when there was evidence of a bubble in U.S. tech stocks that partially deflated during the 2022 growth-led sell-off.4 In the cross section, U.S. equities trade at a high valuation premium relative to other developed markets like Europe (~14.5) and Japan (~16). Moreover, the right panel of Figure 2 shows that the current gaps in forward multiples are large across many sectors, not just in technology. As we’ve noted, our instinct is that the divergences are too wide: outside the U.S., earnings growth has surprised positively without comparable valuation rerating, leaving room for relative upside.5
Figure 2: Price-to-Forward Earnings Ratios – U.S. versus the Rest of DM
Data as of/through September 30, 2025
Our suspicion is that a simple story is at work: investors are overextrapolating a prolonged period of strong earnings growth associated with U.S. technology firms. After all, this would be the norm. Seen through the lens of a behavioral economist, there is strong evidence that such extrapolation contributes to the value premium/growth underperformance in equities, and we would expect the tendency to be all the more pronounced given the enormous challenge of predicting the long-term impact of major changes in technology.6 In present circumstances, therefore, we think it’s prudent to prepare for some reversion of relative valuations.
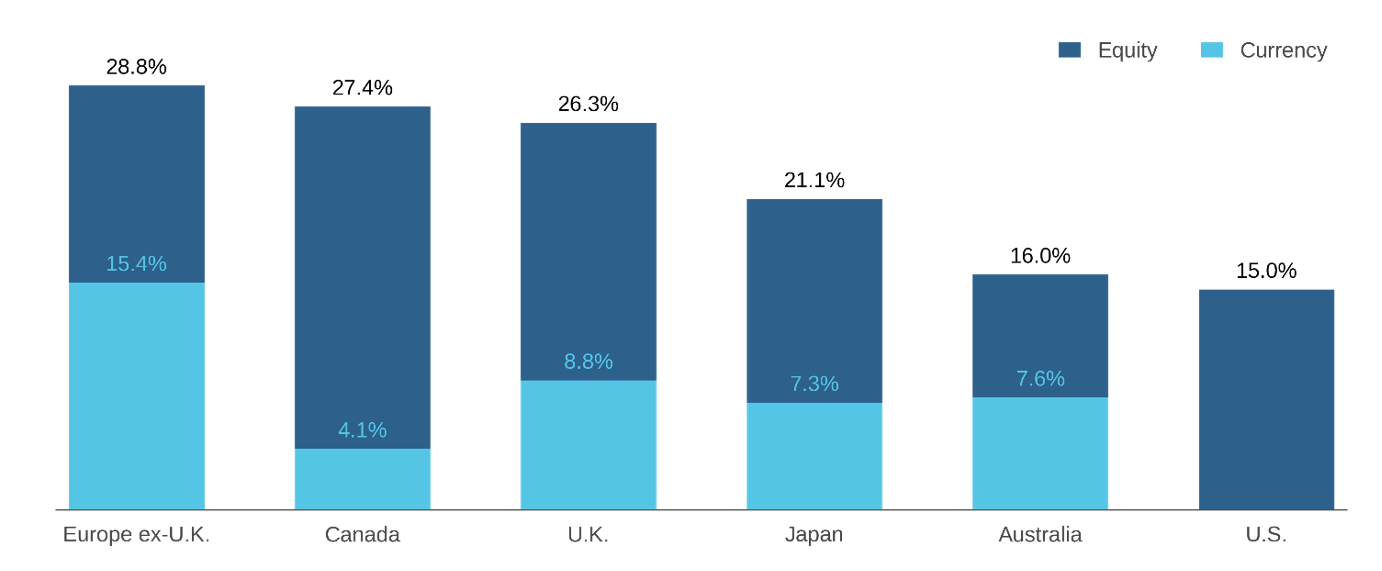
We wouldn’t be surprised, too, if the U.S. weight in the benchmark also reflects extrapolation of the U.S. dollar’s strength since the GFC. Dollar appreciation significantly undermined European and Japanese stocks’ contributions to MSCI World USD returns. Going forward, however, investors shouldn’t bank on further USD strength. Over the long term, DM currencies haven’t reliably provided either a headwind or a tailwind to USD returns of non-U.S. equities. Indeed, 2025 has seen a reversal of the trend of prior years, with dollar weakness materially contributing to the strong USD outperformance of non-U.S. DM equities.7
Figure 3: Currency Contributions to MSCI Index USD Returns January – September 2025
January – September 2025
Risk
Reinforcing this picture of stretched valuations, our instinct is that the market is underpricing risks to U.S. assets. U.S. macro and policy uncertainty remains historically high. This implies an unusually wide range of outcomes in play for U.S. fundamentals and sentiment as drivers of returns, which seems inconsistent with the benchmark’s concentration in the U.S. To bring that point into focus, in prior work we estimated that the U.S.’s roughly 70% weight alongside EAFE and EM in MSCI’s All Country World Index is consistent with a market view that the U.S. will outperform by at least 4% per annum (all in USD terms).8 Equal return expectations across regions would imply a U.S. weight of roughly 40%.9
Another contributing factor is the dependence of broad-market index valuations on one thematic driver, the AI trade. With investors of all stripes, institutional and retail, struggling to understand the implications of AI’s development for corporate profits—for firms that create or enable the technologies, firms that are vulnerable to displacement by them, and for customer firms across the economy—the U.S. equity market seems vulnerable to narrow shocks that could affect expectations of AI-driven profitability. DeepSeek’s emergence in January 2025 served as a cautionary example. Investors were confronted with the sudden arrival of a potential threat to the assumed ROIs of both foundation model providers and their hardware suppliers. Regulatory risk represents another potential wildcard.10
A More Appealing Global Portfolio?
In summary, we believe that rich U.S. valuations and elevated uncertainty give investors reasonable grounds to consider diverging from the world equity benchmark. Specifically, asset owners who have formed their equity allocations predominately through strategies tied to the global benchmark should contemplate rebalancing a portion of those holdings into dedicated DM ex-U.S. active portfolios.
For such investors, there would be several benefits. In terms of concentration, the lean away from the U.S. would also naturally broaden sectoral and stock-level exposures. Figure 4 shows that the DM ex-U.S. benchmark is far less concentrated in technology than the U.S., with only a 9% weight versus 34%. It also shows that the flatter capitalization distribution found outside of the U.S. implies that the non-U.S. benchmark holds nearly six times the effective number of stocks (332 vs. 60).11 While some investors might have a prior that non-U.S. equity markets tend to be more volatile, Figure 4 highlights that total volatility of the DM ex-U.S. benchmark has been slightly lower over the past five years (also true over the past ten).
Figure 4: Characteristics of Passive Benchmarks
As of September 30, 2025
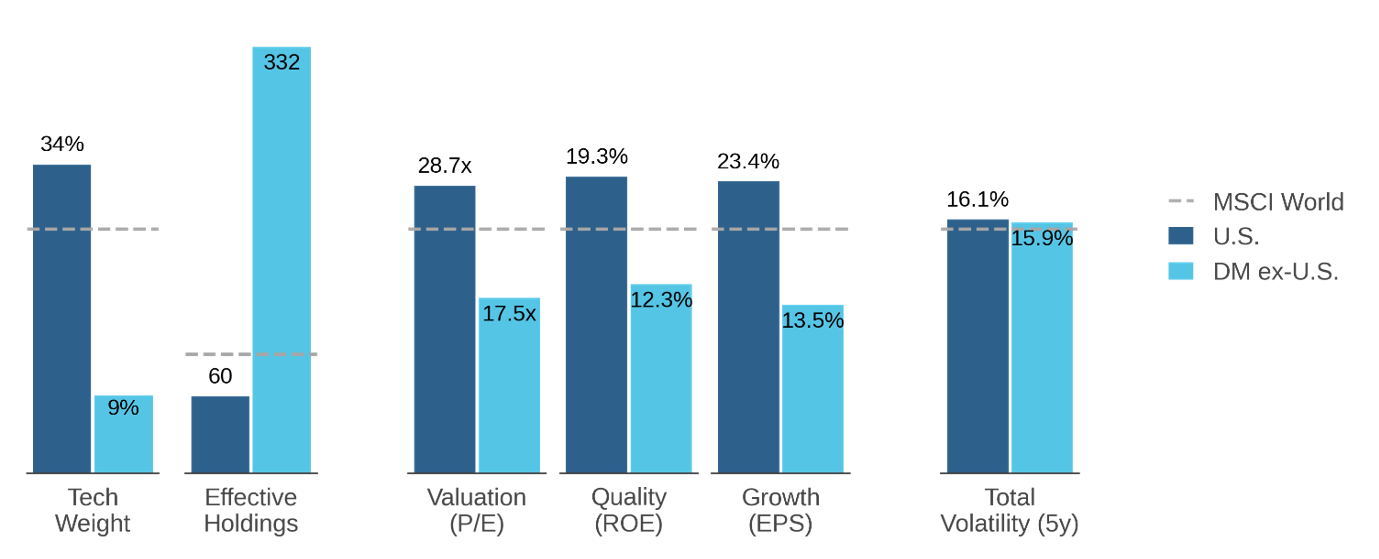
At the benchmark level, the reallocation would involve a tradeoff in fundamentals that motivates staying active when leaning into non-U.S. equities. Looking across conventional trailing metrics, Figure 4 shows that while the DM ex-U.S. index has a P/E ratio that is 40% lower than the U.S. (17.5x vs. 28.7x), it also has materially weaker quality and growth characteristics (ROE of 12.3% vs. 19.3% and earnings growth of 13.5% vs. 23.4%). To first order, richer valuations in the U.S. are consistent with the exceptional profitability and earnings growth of U.S. technology and related sectors; the question is whether those valuations have risen too far.
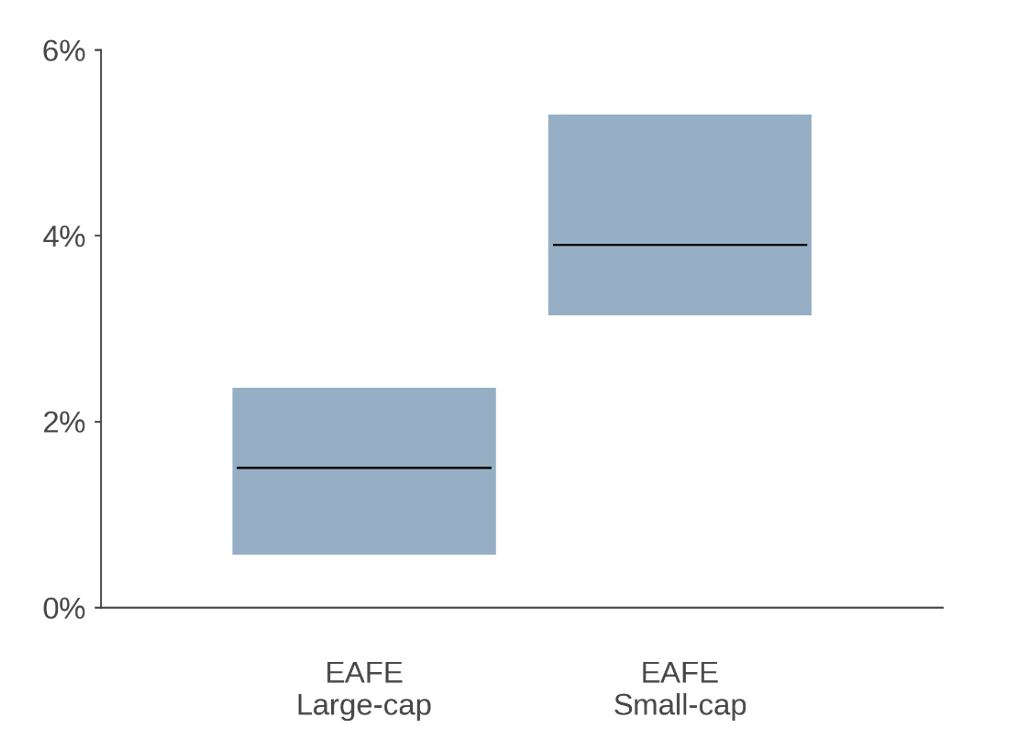
Fortunately, DM ex-U.S. offers fertile ground for stock selection aimed at optimizing an active portfolio’s composite fundamental characteristics on a forward-looking basis. As evidence, Figure 5 shows that active managers have been able to add value in DM ex-U.S., especially in the small-cap end of the spectrum, where poorer information environments foster mispricings and poorer liquidity serves as a barrier to arbitrage.12
Figure 5: Active Manager Excess Return Distribution
25th, 50th, 75th percentiles of five-year annualized excess returns ending June 30, 2025
In that light, reallocating a portion of active global exposure to dedicated active DM ex-U.S. portfolios can strengthen diversification, improve fundamental tradeoffs, and harness markets where active management has consistently delivered excess returns.
Conclusion
Global investors face a choice of paying high prices for concentrated U.S.-driven growth or reaching for better value and broader exposures abroad. While a decision to diverge from the market portfolio’s allocations shouldn’t be taken lightly, we see it as justifiable based on rich U.S. valuations and elevated macro and political uncertainty. For many allocators, a tilt into non-U.S. equities will produce a portfolio with more appealing characteristics. In implementing such a tilt, investors would be wise to stay active to improve tradeoffs in fundamental characteristics and exploit a healthy opportunity set for stock selection.
Endnotes
- This tech orientation is, if anything, probably underestimated in GICS classifications.
- E.g., see Owenomics: Higher Stock Market Concentration Does Not Mean Higher Risk, Acadian, March 2024.
- In addition to the theoretical presumption that the market portfolio is efficient, the decision to diverge from the benchmark should not be taken lightly for pragmatic reasons. Materially diverging from benchmark allocations transforms what may be ambiguous concerns about its composition into easily measurable active positions that could, among other consequences, pose career risk if they underperform.
- For discussion of U.S. valuations see Owen Lamont’s series on the topic of bubbles in Owenomics, including Dumb Money Triumphant, Acadian, October 2025. As well, see Acadian published research including Growth Versus Value: End of an Era?, Acadian, November 2022.
- Please see In an Unsteady World, Time to (Finally) Tilt Away from U.S. Equities?, Acadian, July 2025.
- Related, Baker and Wurgler (2006) note that sentiment has greater impact on returns of stocks that whose valuations are highly subjective.
- Please see The Currency Exposure in Your Equity Portfolio: Beyond the Knee-Jerk Response, Acadian, March 2019.
- Please see In an Unsteady World, Time to (Finally) Tilt Away from U.S. Equities?, Acadian, July 2025.
- Please see Quick Take: Diversification Matters (Finally), Acadian, May 2025.
- The selloff that followed Chinese government’s crackdown on large platform companies in 2021 is an example of how regulatory action quickly tamped frothy sentiment in technology stocks. While the incident may not be directly translatable to other economies, we view massive technology firms as vulnerable to regulatory scrutiny, in part because of their scale. E.g., see “More questions than answers in Nvidia’s $100 billion OpenAI deal,” Reuters, September 23, 2025. References to this and other companies should not be interpreted as recommendations to buy or sell specific securities. Acadian and/or the authors of this paper may hold positions in one or more securities associated with these companies.
- Calculated using the inverted Hirschman-Herfindahl index as applied to benchmark weights.
- As part of their active approach, investors should look for alpha generation outside of benchmark constituents. MSCI’s main DM ex-U.S. Index includes about 800 constituents, and even the IMI version includes only about 3,000. In contrast, we estimate that the investible DM ex-U.S. universe contains about 15,000 stocks. For further discussion of non-U.S. small caps, see Non-U.S. Small Caps: A Call to Inaction, Acadian, November 2024.
Legal Disclaimer
These materials provided herein may contain material, non-public information within the meaning of the United States Federal Securities Laws with respect to Acadian Asset Management LLC, Acadian Asset Management Inc. and/or their respective subsidiaries and affiliated entities. The recipient of these materials agrees that it will not use any confidential information that may be contained herein to execute or recommend transactions in securities. The recipient further acknowledges that it is aware that United States Federal and State securities laws prohibit any person or entity who has material, non-public information about a publicly-traded company from purchasing or selling securities of such company, or from communicating such information to any other person or entity under circumstances in which it is reasonably foreseeable that such person or entity is likely to sell or purchase such securities.
Acadian provides this material as a general overview of the firm, our processes and our investment capabilities. It has been provided for informational purposes only. It does not constitute or form part of any offer to issue or sell, or any solicitation of any offer to subscribe or to purchase, shares, units or other interests in investments that may be referred to herein and must not be construed as investment or financial product advice. Acadian has not considered any reader's financial situation, objective or needs in providing the relevant information.
The value of investments may fall as well as rise and you may not get back your original investment. Past performance is not necessarily a guide to future performance or returns. Acadian has taken all reasonable care to ensure that the information contained in this material is accurate at the time of its distribution, no representation or warranty, express or implied, is made as to the accuracy, reliability or completeness of such information.
This material contains privileged and confidential information and is intended only for the recipient/s. Any distribution, reproduction or other use of this presentation by recipients is strictly prohibited. If you are not the intended recipient and this presentation has been sent or passed on to you in error, please contact us immediately. Confidentiality and privilege are not lost by this presentation having been sent or passed on to you in error.
Acadian’s quantitative investment process is supported by extensive proprietary computer code. Acadian’s researchers, software developers, and IT teams follow a structured design, development, testing, change control, and review processes during the development of its systems and the implementation within our investment process. These controls and their effectiveness are subject to regular internal reviews, at least annual independent review by our SOC1 auditor. However, despite these extensive controls it is possible that errors may occur in coding and within the investment process, as is the case with any complex software or data-driven model, and no guarantee or warranty can be provided that any quantitative investment model is completely free of errors. Any such errors could have a negative impact on investment results. We have in place control systems and processes which are intended to identify in a timely manner any such errors which would have a material impact on the investment process.
Acadian Asset Management LLC has wholly owned affiliates located in London, Singapore, and Sydney. Pursuant to the terms of service level agreements with each affiliate, employees of Acadian Asset Management LLC may provide certain services on behalf of each affiliate and employees of each affiliate may provide certain administrative services, including marketing and client service, on behalf of Acadian Asset Management LLC.
Acadian Asset Management LLC is registered as an investment adviser with the U.S. Securities and Exchange Commission. Registration of an investment adviser does not imply any level of skill or training.
Acadian Asset Management (Singapore) Pte Ltd, (Registration Number: 199902125D) is licensed by the Monetary Authority of Singapore. It is also registered as an investment adviser with the U.S. Securities and Exchange Commission.
Acadian Asset Management (Australia) Limited (ABN 41 114 200 127) is the holder of Australian financial services license number 291872 ("AFSL"). It is also registered as an investment adviser with the U.S. Securities and Exchange Commission. Under the terms of its AFSL, Acadian Asset Management (Australia) Limited is limited to providing the financial services under its license to wholesale clients only. This marketing material is not to be provided to retail clients.
Acadian Asset Management (UK) Limited is authorized and regulated by the Financial Conduct Authority ('the FCA') and is a limited liability company incorporated in England and Wales with company number 05644066. Acadian Asset Management (UK) Limited will only make this material available to Professional Clients and Eligible Counterparties as defined by the FCA under the Markets in Financial Instruments Directive, or to Qualified Investors in Switzerland as defined in the Collective Investment Schemes Act, as applicable.
Additional Disclosures
Every investment program has an opportunity for loss as well as profit. Benchmarks are individual to each manager based on the benchmarks reported to eVestment. Past performance is no guarantee of future returns. eVestment Alliance, LLC and its affiliated entities (collectively, “eVestment”) collect information directly from investment management firms and other sources believed to be reliable, however, eVestment does not guarantee or warrant the accuracy, timeliness, or completeness of the information provided and is not responsible for any errors or omissions. Performance results may be provided with additional disclosures available on eVestment’s systems and other important considerations such as fees that may be applicable. Not for general distribution and limited distribution may only be made pursuant to client’s agreement terms. All managers in an eVestment category are not necessarily included. Copyright 2012-2025 eVestment Alliance, LLC. For illustrative purposes only. All Rights Reserved.
Hypothetical
Acadian is providing hypothetical performance information for your review as we believe you have access to resources to independently analyze this information and have the financial expertise to understand the risks and limitations of the presentation of hypothetical performance. Please immediately advise if that is not the case.
Hypothetical performance results have many inherent limitations, some of which are described below. No representation is being made that any account will or is likely to achieve profits or losses similar to those shown. In fact, there are frequently sharp differences between hypothetical performance results and the actual performance results subsequently achieved by any particular trading program.
One of the limitations of hypothetical performance results is that they are generally prepared with the benefit of hindsight. In addition, hypothetical trading does not involve financial risk, and no hypothetical trading record can completely account for the impact of financial risk in actual trading. For example, the ability to withstand losses or to adhere to a particular trading program in spite of trading losses are material points which can also adversely affect actual trading results. There are numerous other factors related to the markets in general or to the implementation of any specific trading program which cannot be fully accounted for in the preparation of hypothetical performance results and all of which can adversely affect actual trading results.