
Growth Versus Value: End of an Era?
Key Takeaways
- Prevalent narratives trumpeting value’s resurgence in 2022 are muddled by the increasing irrelevance of mainstream value benchmarks.
- Nevertheless, a nuanced examination reveals that the 2022 value revival is best interpreted as the reversal of a historically unprecedented run of speculation in growthy assets over the prior five years.
- In an investing world anchored to 1, 3, 5, and 10-year track records, investors face a broad challenge in framing expectations going forward now that economic and policy conditions have shifted away from those that fostered a “one-factor bet on growth.”
Table of contents
One of the most prominent investing catchphrases of 2022 has been that “value is back,” an expression of exuberant relief from value investors whose fortunes have reversed after years of underperformance. For more than a decade prior, equity markets seemingly were dominated by a “one-factor bet on growth,” and the performance of diverse strategies and allocations that were not geared to it, especially value-oriented equity investments, suffered by comparison.
Nevertheless, the notion that value is somehow “back” is as muddled and misleading as the prior narrative that value was dead. In this paper, we clarify the picture by updating our 2019 analysis of value’s performance since the GFC.
First, we show why rudimentary representations of value that drive media and practitioner narratives have become poor measures of the efficacy of the more sophisticated value investing approaches that systematic investors actually employ in practice: Simple implementations have been increasingly polluted by uncompensated risk exposures that are incidental to capturing a value premium. In 2022, for example, the supercharged resurgence of commoditized value formulations largely can be attributed to a long-energy, short-technology sector bet.
Second, we document evidence that the 2022 value revival is best viewed primarily as the reversal of a historically unprecedented run of speculation in growth stocks from 2017-2021. Informed by that perspective, we close by discussing the outlook for value and broad challenges facing investors in connection with the shift away from an environment that engendered a “one-factor bet on growth.”
Commoditized Value: An Incidental Tailwind
In 2022, there has been no shortage of media headlines and practitioner chatter championing the return of value. That’s natural. Through August, the Fama-French U.S. High-Minus-Low value portfolio (HML), which is the canonical representation of value in academic literature, had enjoyed an 18.8% gain. On an annual basis, that would be its strongest performance in more than 20 years. The green dots in Figure 1 provide a proxy, showing year-by-year returns on a hypothetical U.S. all-cap book-to-price (B/P) based long-value, short-growth portfolio dating back to 1960. Year-to-date 2022 performance stands out.
Figure 1: Annual Returns and Sector Allocation Contributions—U.S. Value Minus Growth
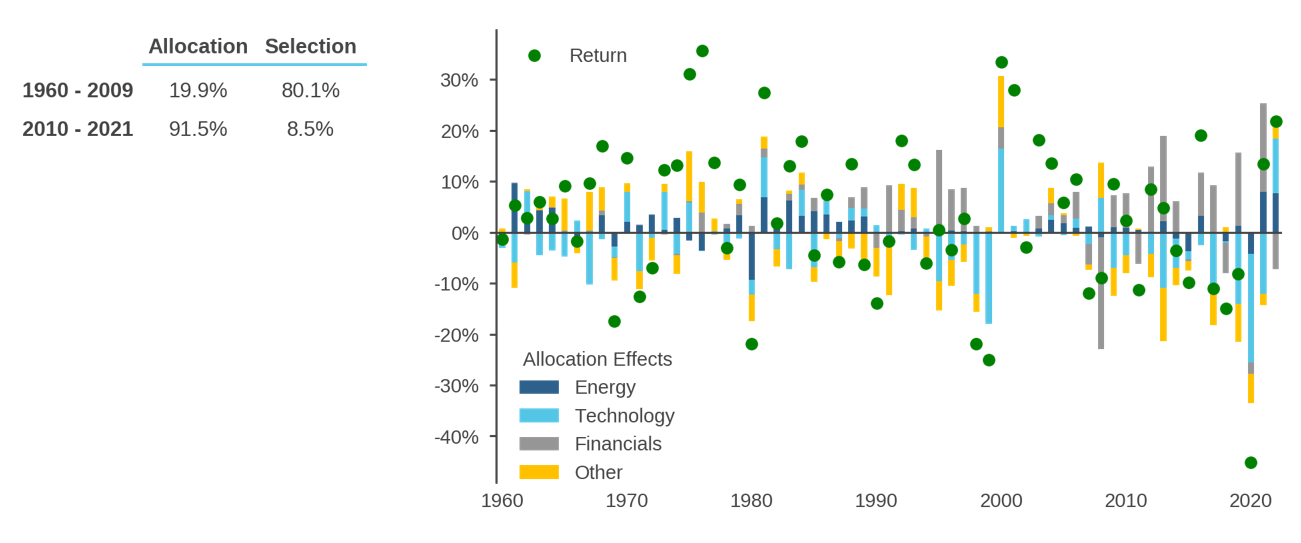
But closer examination of Figure 1 highlights that simple but prevalent metrics of value, like this all-cap portfolio or HML, have evolved to such a degree as to call into question their utility as measures of value’s performance. In fact, the stacked columns in the chart summarize the contributions of sector allocation effects to the portfolio’s returns via a Brinson decomposition.1 The rightmost column shows that, through August, the portfolio’s 2022 performance can be attributed almost entirely to a long-energy, short-technology sector bet.
Scanning the chart from right to left reveals that this is a manifestation of a larger trend. Since the GFC, sector allocation effects, predominately from technology and financials, have come to drive the performance of the simple value-versus-growth representation to a greater extent than was historically the case. The table at left summarizes the shift. From 2010-2021, industry allocation effects have accounted for 92% of returns as opposed to only 8% from selection. However, looking back over long-term history, from 1960-2009, we see that contributions from selection were of much greater relative importance.
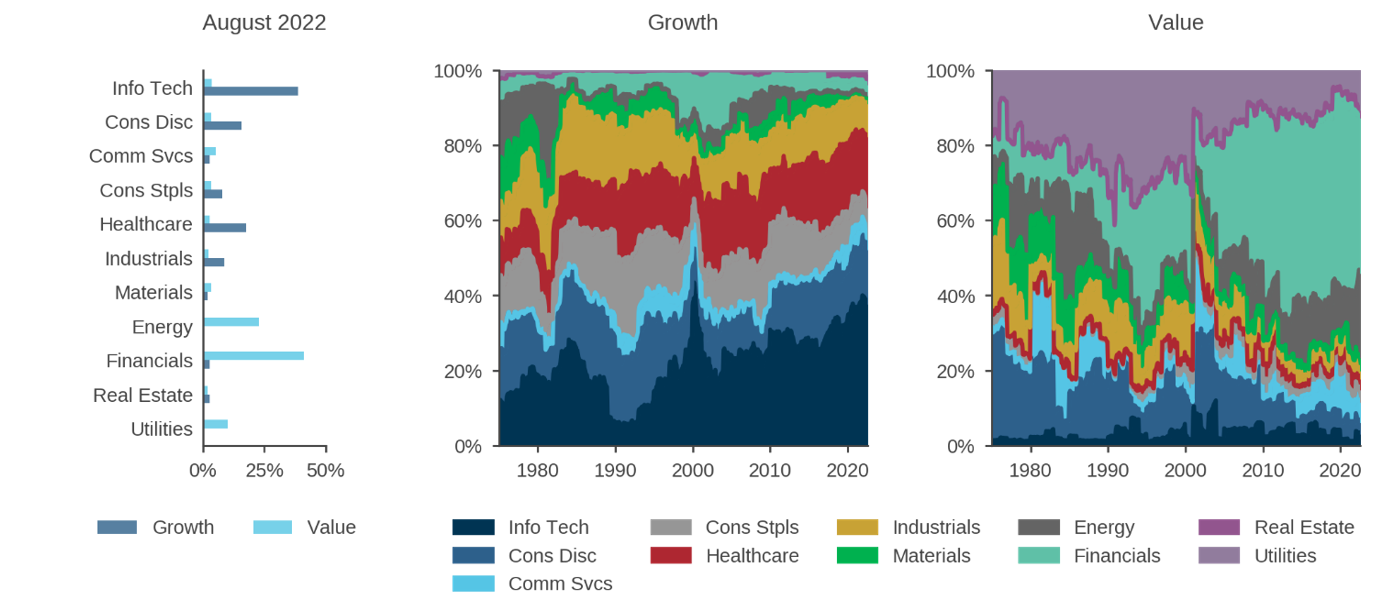
Figure 2 helps to explain why. As we noted in research on the relationship between value and interest rates, all-cap B/P-based value and growth portfolios have evolved such they have highly divergent sector exposures.2 Financials and energy stocks have taken a dominant weight in the value side, together accounting for roughly 67%, largely displacing utilities as well as industrials. Among other effects, this has increased the value portfolio’s beta well above one and altered its exposure to interest rates. On the growth side, technology-oriented stocks, including consumer discretionary and communication services, took a disproportionately large share as their prices trended higher, displacing other sectors like consumer staples and industrials.
Figure 2: Sector Composition—U.S. Value and Growth Portfolios
The ambiguity in simple but prevalent representations of value, like the one we have analyzed here, has several implications. Most directly, it muddles interpretation of value-versus-growth performance. Success of some value implementations this year may partly reflect an incidental tailwind from industry exposures that have contaminated the underlying portfolios through rudimentary value metrics and poor risk controls. Case-in-point: Is the performance of strategies that benefited from the run-up in the energy sector as a result of the Ukraine war a reflection of the success of value?
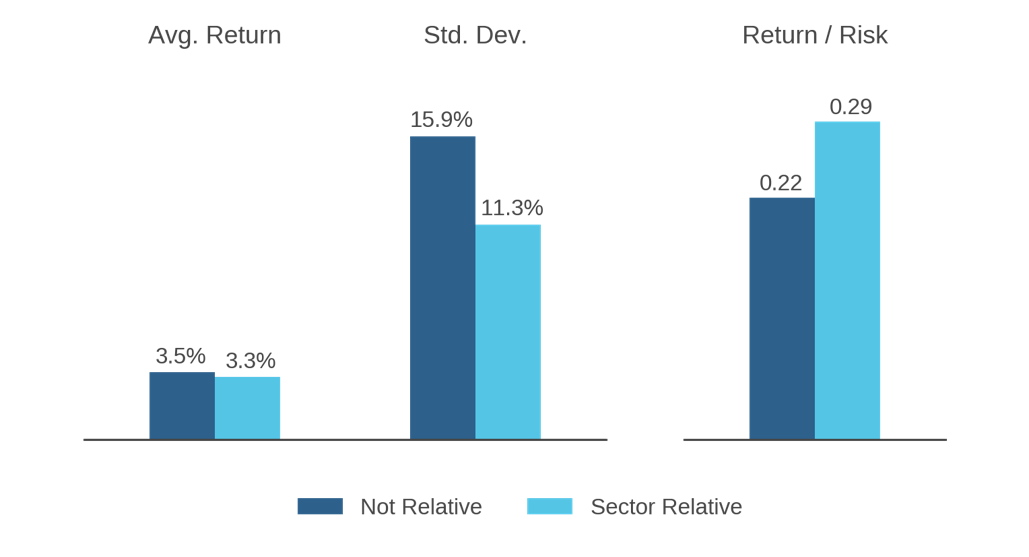
Muddled interpretations of value performance have a corollary for strategy selection: It is more important than ever, in our view, to seek value investing processes that employ stock-selection signals that are neutralized to uncompensated industry exposures and other pollutants. That implies basing signals on peer-relative comparisons of valuation metrics which are appropriate for the specific context. Figure 3 provides prima facie evidence of the benefit, showing that since 1960 a sector-relative formulation of a simple B/P-based value signal, rather than a baseline version that ranks stocks without respect to sector affiliation, generates similar returns with much lower volatility. This result is consistent with academic research suggesting that the bulk of the return premium from value is derived from stock selection rather than allocation.3
Figure 3: Benefits of Sector-Relative Value Implementations
Beyond unmanaged industry exposures, the simple value portfolio reflected in Figure 1 also displays negative exposure to quality and fundamental growth.4 This points to the importance of implementing value via a deliberate multifactor process rather than accepting an unintentional, and perhaps detrimental, blend of exposures to both uncompensated risks and various sources of alpha that may be passed through by less well-developed rules-based or discretionary value portfolios.
Third, the evolving sectoral composition of HML and other simply defined factor portfolios has important implications for academic research, which continues to lean on such representations for the risk adjustment of returns to test candidate “anomalies” and investment strategies. Reflexive reliance on simplistic factor models in such analyses may dilute the ability to distinguish alpha from risk exposures and/or generate inconsistent results across sub-periods. The possibility that the signal-to-noise ratio (i.e., alpha versus risk factor contamination) in such portfolios has changed over time is particularly concerning in this regard.
2022: Clearing the Air
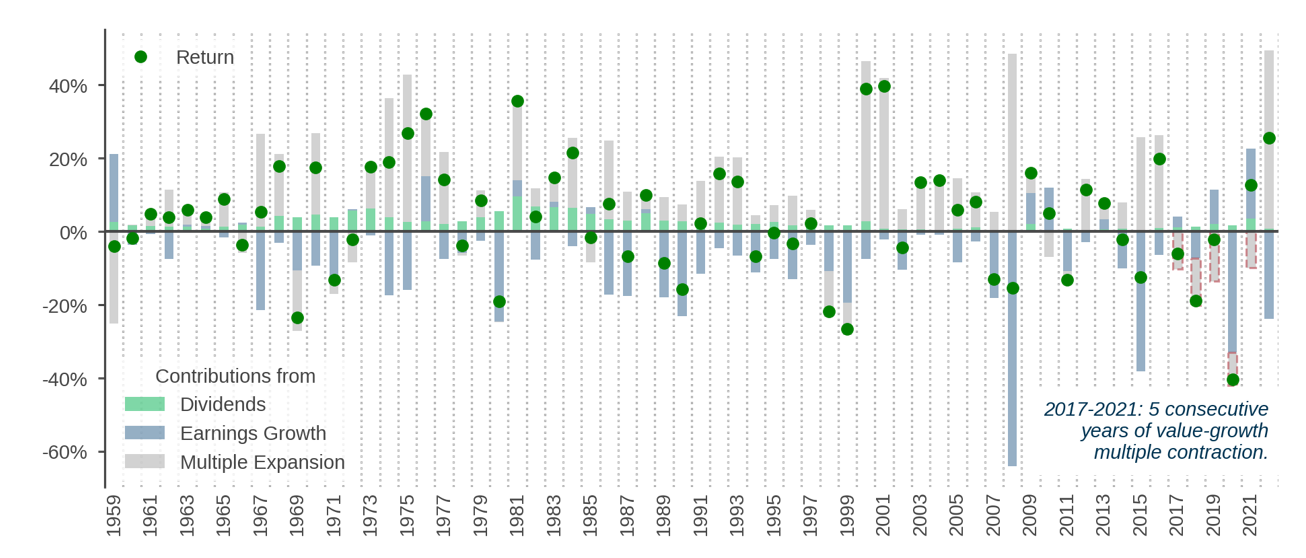
In our view, the growth-versus-value selloff, a major driver of the 2022 bear market, is best viewed as the reversion of a prior phase of historic speculation in growthy assets that persisted from 2017 through 2021. That period saw five consecutive years of relative growth-versus-value Price-to-Cash Earnings (P/CE) multiple expansion, based on the mainstream measure demonstrated in Figure 4, a run that is historically unprecedented over the decades since 1960. Proximate causes of the subsequent growth-value reversion in 2022 include rising interest rates, which signaled the likely end of the economic and policy conditions in which that speculation had taken hold.
Figure 4: Returns Decomposition—U.S. Value Minus Growth
To recall the post-GFC context that we discussed in our 2019 value research, the speculative sentiment that benefited growth in recent years had a substantive basis in prior fundamentals.5 During the first several years after the GFC, large-cap growth stocks, especially technology-oriented U.S. companies, delivered strong and consistent increases in earnings. Global economic conditions were tepid, a climate that was not favorable to cyclically sensitive stocks that are often well-represented in conventionally defined value portfolios. Yet while that economic environment was too soft to lift those companies’ more fragile fundamentals, central banks provided enough stimulus to avoid an economic “washout” that might have compressed high-flying stocks’ valuation multiples and/or triggered a market meltdown that would have set the stage for a sharp value rebound. For a time, therefore, value’s underperformance was consistent with fundamentals and economic conditions.
But in the course of our value research a few years ago, we saw evidence in then-available data from 2017 through early 2019 that the main driver of growth-value performance had evolved from fundamentals to speculation. Specifically, investors had started to overextrapolate large-cap growth stocks’ prior fundamental strength, a behavioral shift that manifested in growth-versus-value relative multiple expansion. That trend became clearer as time passed. Then, during the market’s V-shaped recovery from the COVID drawdown, overextrapolation morphed into broad speculative excess, as evidenced by a wave of SPACs, the emergence of meme stocks, and crypto price appreciation. In that frothy environment, multiple expansion in growth stocks became explosive.6
Figure 5 further underscores just how historically atypical growth stocks’ behavior was during the 2017-2021 period, and it provides additional color as to the nature of its drivers. As a long-term historical baseline, the left columns show that (U.S.) growth stocks historically have delivered solid year-on-year increases in earnings, justifying their relatively lofty multiples. Nevertheless, in any given year markets don’t fully capitalize those increased earnings into valuations, and we tend to see fractionally offsetting valuation contraction. That’s consistent with a long-term “tent-shaped” pattern in the earnings of high multiple stocks, whereby their past strong earnings growth tends to revert somewhat.7
Figure 5: Cash Earnings Growth and Multiple Expansion in U.S. Growth Stocks
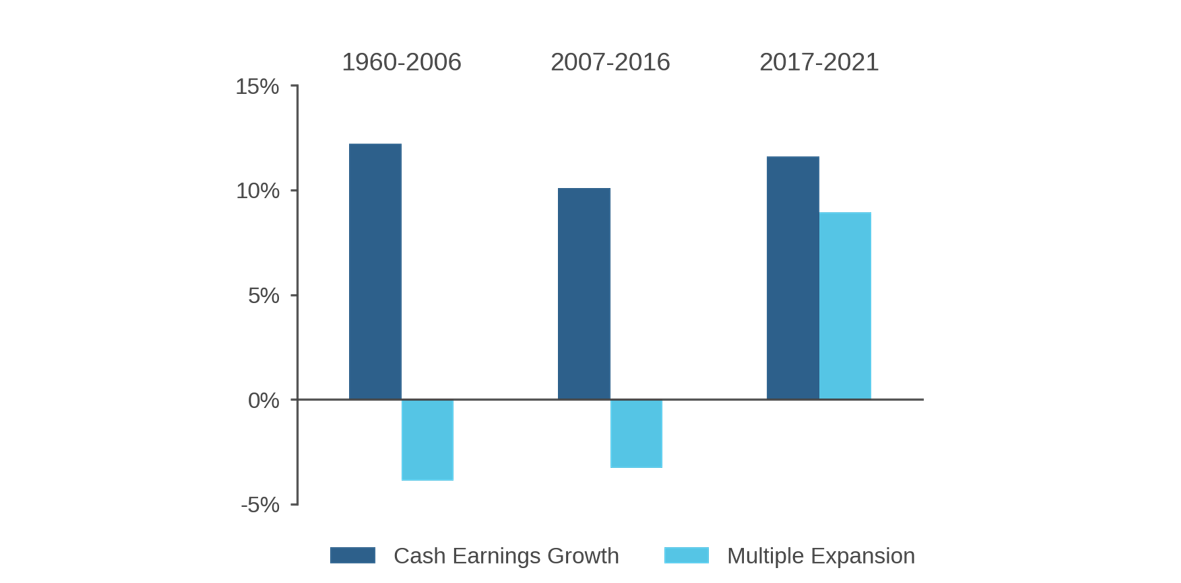
The right columns of Figure 5 show, however, that as growth stocks’ earnings increased from 2017-2021 their prices rose even more. In other words, investors viewed past improvements in fundamentals as a signal of even larger gains to come, contrary to the long-term historical pattern. That change in market behavior was consistent with (and fed) narratives reminiscent of the TMT bubble that “something had changed,” and even some established value investors questioned whether parts of the economy had evolved to justify permanently higher multiples.
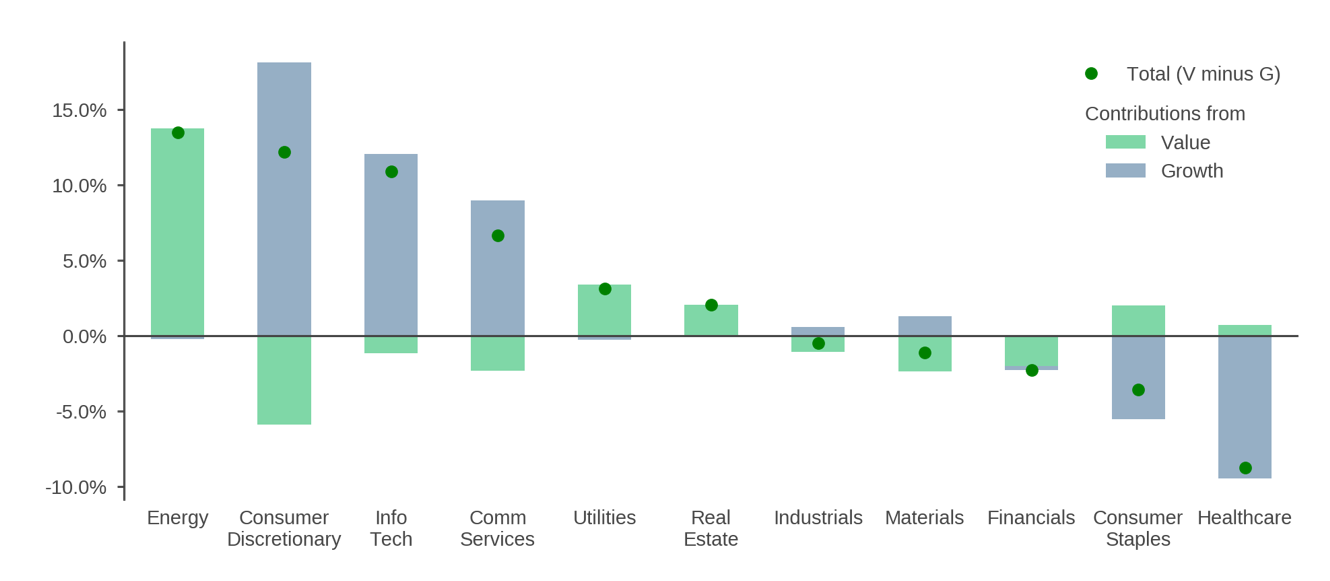
The sharp growth drawdown that became so evident in 2022 marked a reversal of this speculative episode. In fact, the light gray column at the far right of Figure 4 shows that the growth-versus-value multiple compression observed during the first half of this year was among the sharpest that we have seen over the past 60 years.8 Figure 6 highlights that the bulk of that change has been driven by the growth side of the long-short portfolio (blue bars), reflecting the sharp contraction of P/CE multiples in technology, consumer discretionary, and communication services. While from the value side (green bars), there has been a meaningful contribution from P/CE multiple expansion in energy, the bulk of the net value-versus-growth multiple expansion in 2022 is traceable to deflation of speculation.
Figure 6: 2022—Sector Contributions to Value-Minus-Growth P/CE Multiple Expansion
The Outlook
Against the backdrop described in the prior section, what is the outlook for value? One meaningful answer to that question, even though it may sound trite, is a reiteration of our view that value investing concepts are evergreen. The conceptual foundation for generating stock-selection alpha by comparing market valuations to fundamental measures of companies’ worth should remain sound as long as markets remain inefficient. That doesn’t mean, however, that payoffs from even well-conceived bottom-up value approaches won’t vary with market circumstances. During periods of speculation such as that observed from 2017- 2021, even well-designed value strategies may generate significant active underperformance as market prices depart from fundamentals for prolonged periods.9 But the reoccurrence of such episodes represents important evidence that the behavioral drivers of mispricings that give rise to a value premium over the long term are alive and well.
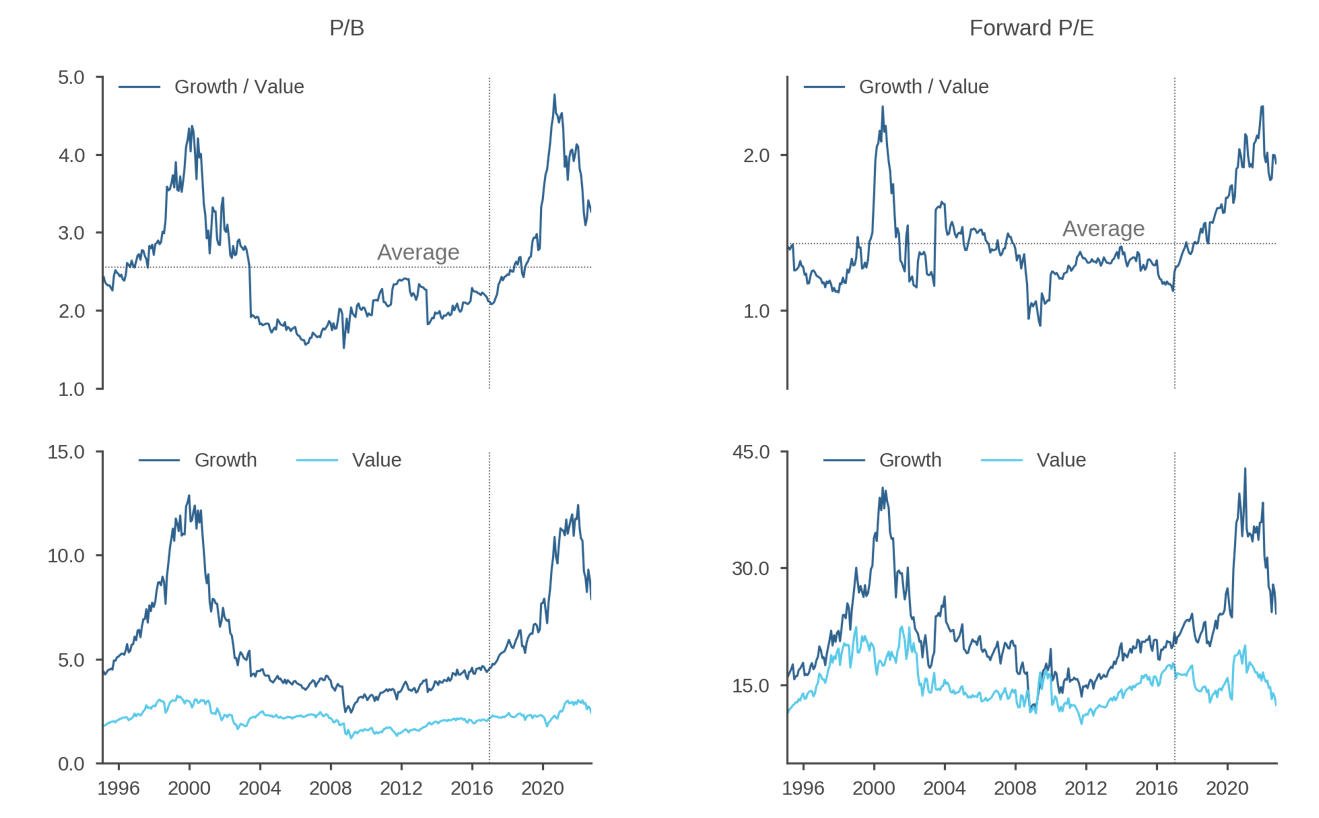
In the near term, though, a central question framing the outlook for value is the extent to which the growthy speculative excess of recent years has blown off during 2022. Figure 7 provides context, showing several depictions of the degree to which relative growth-minus-value multiples have reverted. The top left and right panels show that growth multiples remain historically elevated relative to value on price-to-book and price-to-forward-earnings bases, respectively. The chart’s bottom panels separate out the growth and value components, demonstrating that while much of the post-COVID explosive multiple expansion of U.S. growth stocks has dissipated, valuations in that market segment remain rich relative to levels from the beginning of 2017 (marked in each panel with a vertical line).
Figure 7: Valuation Spreads and Ratios—U.S. Growth and Value Benchmark Indexes
In assessing valuations, the high uncertainty over the outlook for future fundamentals presents a daunting challenge. The many salient issues on which the earnings outlook hinges include the long-term (e.g., the degree to which changes in economic structure, technologies, and benchmark index composition actually do justify higher multiples), the cyclical (e.g., whether central banks can control inflation or whether they might overshoot in the process of trying to do so), and the idiosyncratic (e.g., elevated geostrategic risk). Considering the full spectrum of those potential influences, we believe that there is still elevated downside risk associated with growthy assets, and that value exposure remains comparatively attractive.
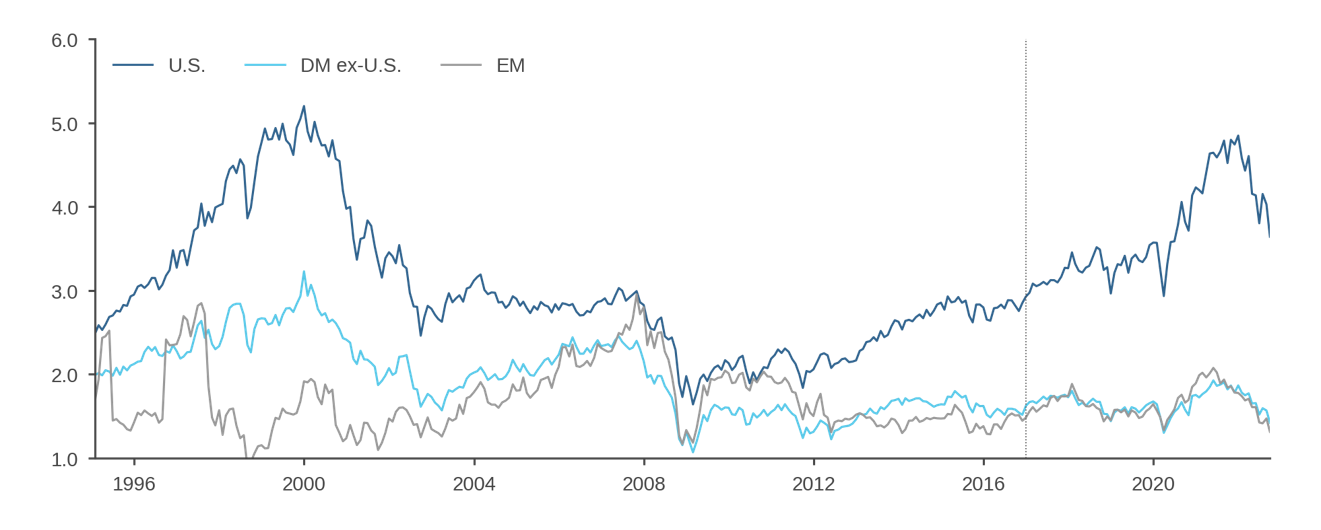
Beyond the outlook for explicit value and growth allocations, there are broader implications to the potential end of the “one-factor bet on growth” and the shift away from the macro environment that engendered it. As we’ve discussed in prior research, the protracted strength of large-cap U.S. growth stocks since the GFC contaminated narratives about many other allocations and strategies. Investments that weren’t geared to it suffered by comparison, including allocations to non-U.S. developed markets, emerging markets, and even alternatives.10 Now that the conditions that fostered growthy speculation have changed, investors should look at such investments afresh. Figure 8 shows, for example, that on a historical basis, DM ex-U.S. and EM valuations look cheap relative to the U.S. market, despite the growth-value drawdown in 2022. On the other side of the same coin, investors should also critically review strategies and allocations that may have benefited from incidental exposure to growth. One representative example would be exclusion-based decarbonization strategies that met their climate objective by underweighting energy and overweighting technology. In a different economic and market environment, alternative methods of achieving the ESG goal that do not rely on sector or industry reallocations may provide more robust financial performance.11
Figure 8: P/B Ratios—Regional Cap-Weighted Benchmark Indexes
Unfortunately for investors, however, the very shifts in the investing environment that necessitate a reset of perspective raise a serious challenge. Many market, economic, and policy behaviors that investors became accustomed to in the post-GFC era, including declining and historically low interest rates, negative stock-bond correlations, and low and stable inflation, to name some of the most evident, may not characterize the environment going forward. Instead, longer history that predates the careers of many contemporary investors may have newfound relevance. The required shift in perspective may be jarring for an investing industry that prizes recency, and the solutions may not be straightforward.
Conclusion
At Acadian, we take a pragmatic approach to generating returns from value. We believe that the value premium results from behavioral errors on the part of investors. We embrace a multiplicity of value-related signals to identify the underlying mispricings, reflecting our view that the value premium does not arise from a singular phenomenon. We aim to maximize the signal-to-noise ratio of our bottom-up value implementation by evaluating refined metrics across comparable companies, which helps to reduce the presence of uncompensated risk exposures. We implement value in a multifactor process to optimally trade off value with other sources of alpha.12
Although we believe that this approach to value has evergreen relevance, no value implementation, regardless of how well-conceived, will unfailingly outperform. The speculative excess that we saw over the past several years presented a daunting headwind for any value investing approach, exacerbating mispricings over a protracted period. That headwind may now have subsided with a change in the economic conditions that gave rise to it, benefiting value.
Looking out to the longer term, we believe that prospects for value remain favorable, because we see no evidence that its behavioral foundations have disappeared. If anything, the market irrationality that we observed in recent years reinforces our confidence. But all value implementations are not alike. And in a rapidly changing and amplified risk environment, we think it is all the more prudent for investors to seek refinement in strategy selection.
Endnotes
- Allocation and selection contributions for the long-value, short-growth portfolio are calculated by running separate attributions of the long and short sides relative to a broad-market benchmark and taking the difference.
- Figure 2 illustrates for B/P-based tercile portfolios. Quintile portfolios, which focus more on the extremes of the distribution, show even greater sectoral divergence. For further discussion, see Acadian, Interest Rates and Value: Don’t Believe (All) the Hype, 2021.
- This discussion is not intended to imply that there is no alpha available from top-down value signals, e.g., sector or country level, or that value is of no use in timing exposures to other attributes. We believe, however, that such effects should be deliberately modeled.
- We see this pattern in both large and small cap versions of this portfolio. Please contact us for related analysis.
- Specifically, see Acadian, Returns to Value A Nuanced Picture, 2019.
- For further discussion of the post-COVID speculative environment, see Acadian, Managed Volatility in the Pandemic: The One-Year Anniversary, 2021.
- More specifically, we observe the tent-shaped pattern in Return on Equity (ROE), which normalizes earnings relative to book. See Figure 1 in Acadian, The Outlook for Value, 2019.
- Smaller cap growth stocks and negative earnings stocks actually started to weaken in 2021.
- In essence, fundamentally based alpha signals are predicated on markets displaying enough irrationality to generate material mispricings but not so much irrationality that those mispricings do not reliably correct.
- See, as examples, Acadian publications: ESG by the Numbers, 2022, Reassessing Emerging Markets Equities, 2020, and Reexamining Diversification: 20/20 Perspective, 2020.
- See Acadian, Taking the Heat out of Decarbonization Strategies, 2022.
- For more information, see Acadian’s Approach to Value Investing, Acadian, 2019.
Hypothetical Legal Disclaimer
Acadian is providing hypothetical performance information for your review as we believe you have access to resources to independently analyze this information and have the financial expertise to understand the risks and limitations of the presentation of hypothetical performance. Please immediately advise if that is not the case.
Hypothetical performance results have many inherent limitations, some of which are described below. No representation is being made that any account will or is likely to achieve profits or losses similar to those shown. In fact, there are frequently sharp differences between hypothetical performance results and the actual performance results subsequently achieved by any particular trading program.
One of the limitations of hypothetical performance results is that they are generally prepared with the benefit of hindsight. In addition, hypothetical trading does not involve financial risk, and no hypothetical trading record can completely account for the impact of financial risk in actual trading. For example, the ability to withstand losses or to adhere to a particular trading program in spite of trading losses are material points which can also adversely affect actual trading results. There are numerous other factors related to the markets in general or to the implementation of any specific trading program which cannot be fully accounted for in the preparation of hypothetical performance results and all of which can adversely affect actual trading results.
Legal Disclaimer
These materials provided herein may contain material, non-public information within the meaning of the United States Federal Securities Laws with respect to Acadian Asset Management LLC, Acadian Asset Management Inc. and/or their respective subsidiaries and affiliated entities. The recipient of these materials agrees that it will not use any confidential information that may be contained herein to execute or recommend transactions in securities. The recipient further acknowledges that it is aware that United States Federal and State securities laws prohibit any person or entity who has material, non-public information about a publicly-traded company from purchasing or selling securities of such company, or from communicating such information to any other person or entity under circumstances in which it is reasonably foreseeable that such person or entity is likely to sell or purchase such securities.
Acadian provides this material as a general overview of the firm, our processes and our investment capabilities. It has been provided for informational purposes only. It does not constitute or form part of any offer to issue or sell, or any solicitation of any offer to subscribe or to purchase, shares, units or other interests in investments that may be referred to herein and must not be construed as investment or financial product advice. Acadian has not considered any reader's financial situation, objective or needs in providing the relevant information.
The value of investments may fall as well as rise and you may not get back your original investment. Past performance is not necessarily a guide to future performance or returns. Acadian has taken all reasonable care to ensure that the information contained in this material is accurate at the time of its distribution, no representation or warranty, express or implied, is made as to the accuracy, reliability or completeness of such information.
This material contains privileged and confidential information and is intended only for the recipient/s. Any distribution, reproduction or other use of this presentation by recipients is strictly prohibited. If you are not the intended recipient and this presentation has been sent or passed on to you in error, please contact us immediately. Confidentiality and privilege are not lost by this presentation having been sent or passed on to you in error.
Acadian’s quantitative investment process is supported by extensive proprietary computer code. Acadian’s researchers, software developers, and IT teams follow a structured design, development, testing, change control, and review processes during the development of its systems and the implementation within our investment process. These controls and their effectiveness are subject to regular internal reviews, at least annual independent review by our SOC1 auditor. However, despite these extensive controls it is possible that errors may occur in coding and within the investment process, as is the case with any complex software or data-driven model, and no guarantee or warranty can be provided that any quantitative investment model is completely free of errors. Any such errors could have a negative impact on investment results. We have in place control systems and processes which are intended to identify in a timely manner any such errors which would have a material impact on the investment process.
Acadian Asset Management LLC has wholly owned affiliates located in London, Singapore, and Sydney. Pursuant to the terms of service level agreements with each affiliate, employees of Acadian Asset Management LLC may provide certain services on behalf of each affiliate and employees of each affiliate may provide certain administrative services, including marketing and client service, on behalf of Acadian Asset Management LLC.
Acadian Asset Management LLC is registered as an investment adviser with the U.S. Securities and Exchange Commission. Registration of an investment adviser does not imply any level of skill or training.
Acadian Asset Management (Singapore) Pte Ltd, (Registration Number: 199902125D) is licensed by the Monetary Authority of Singapore. It is also registered as an investment adviser with the U.S. Securities and Exchange Commission.
Acadian Asset Management (Australia) Limited (ABN 41 114 200 127) is the holder of Australian financial services license number 291872 ("AFSL"). It is also registered as an investment adviser with the U.S. Securities and Exchange Commission. Under the terms of its AFSL, Acadian Asset Management (Australia) Limited is limited to providing the financial services under its license to wholesale clients only. This marketing material is not to be provided to retail clients.
Acadian Asset Management (UK) Limited is authorized and regulated by the Financial Conduct Authority ('the FCA') and is a limited liability company incorporated in England and Wales with company number 05644066. Acadian Asset Management (UK) Limited will only make this material available to Professional Clients and Eligible Counterparties as defined by the FCA under the Markets in Financial Instruments Directive, or to Qualified Investors in Switzerland as defined in the Collective Investment Schemes Act, as applicable.