
The Currency Exposure in Your Equity Portfolio: Beyond the Knee-Jerk Response
Key Takeaways
- During 2018, investors were reminded that currency exposure can be a material driver of risk and return in international equity portfolios.
- Currency contribution to total portfolio risk in developed markets differs meaningfully from that in emerging markets both in aggregate and in terms of cross-sectional variation.
- Although the risk-return trade-off from hedging currency exposure has varied considerably over time, currency-hedged strategies in developed markets have benefitted from a regime of low and stable implied carry costs.
Table of contents
March 2019
In 2018, macroeconomic and geopolitical uncertainty roiled global markets. For many international investors, losses in foreign stocks were exacerbated by depreciation of the associated currencies. For the year, both developed and emerging currency exposure returned approximately -5% in U.S. dollar terms.1 Major currencies, including the British pound, euro, Canadian dollar, and Mexican peso were rattled by geopolitical events, including Brexit and NAFTA negotiations. Outright currency crises unfolded in Turkey and Argentina.
These events have renewed asset owners’ focus on the currency risk inherent in international investments. Equity investors’ attentiveness to currency risk is often reactive, usually only resurfacing after they have experienced sharp losses from their exposure. With that tendency in mind, this note is intended to help investors who are rethinking whether to hedge. We provide a broad picture of the significance of currency exposure to risk in international equity investing and a perspective on managing it.
HAS HEDGING CURRENCY EXPOSURE DELIVERED FOR INVESTORS?
Over the past five years, U.S.-based DM investors have enjoyed a “free lunch” for hedging currency risk, not only reducing risk but actually increasing returns. U.S.-based EM investors have also seen improved risk-adjusted returns from hedging although the risk reduction has come at a material cost. However, have these patterns held over the long term?
The answer is no. As evidence, we compare the Sharpe ratios over time of currency-hedged and unhedged versions of DM and EM equity benchmarks from the perspective of a U.S. investor, specifically MSCI’s EAFE and EM indexes in USD terms.2 For DM, Figure 1 shows that while hedged EAFE has outperformed over the past 3, 5, and 10 years, it has underperformed over the full period since January 2001. In EM, the hedged index has outperformed over the past 5 and 10 years, but since December 2001 the hedged index has modestly underperformed.
Figure 2 adds further detail, comparing rolling 10-year hedged and unhedged Sharpe ratios. There is no dominant all-season approach. Hedged or unhedged benchmarks may outperform one another over extended periods.
In light of the inconsistency in relative risk-adjusted performance, is there anything to be gained by looking separately at the Sharpe ratio numerator (return) and denominator (risk)?
Figure 1) Sharpe ratios as of Dec 31, 2018: currency-hedged vs. unhedged USD indexes
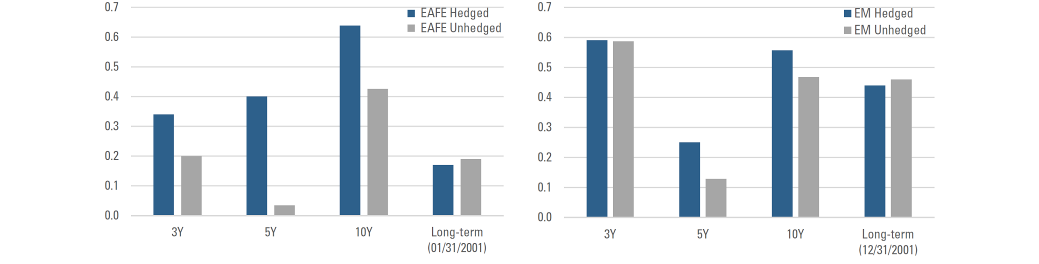
Figure 2) Rolling 10Y Sharpe ratios: currency-hedged vs. unhedged USD indexes
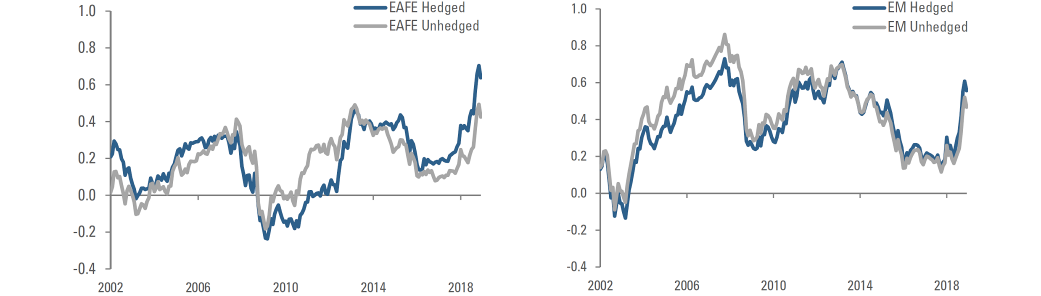
Rolling 10Y Sharpe ratios computed using an initial starting period of 3 years. MSCI published hedged and unhedged indices begin in 1999. Sources: Acadian, Bloomberg, MSCI. Copyright MSCI 2019. All Rights Reserved. Unpublished. PROPRIETARY TO MSCI. For illustrative purposes only. It is not possible to invest directly in an index. Every investment program has the opportunity for losses as well as profits. Past results are not indicative of future results.
CURRENCY CONTRIBUTION TO EQUITY PORTFOLIO RISK
We start with risk. To gauge the significance of currency exposure to equity portfolio risk, we create a sample hedged portfolio and then break down its return variance into contributions from 1) currency-hedged equities, 2) currency forwards, and 3) the covariance between equities and currencies.3
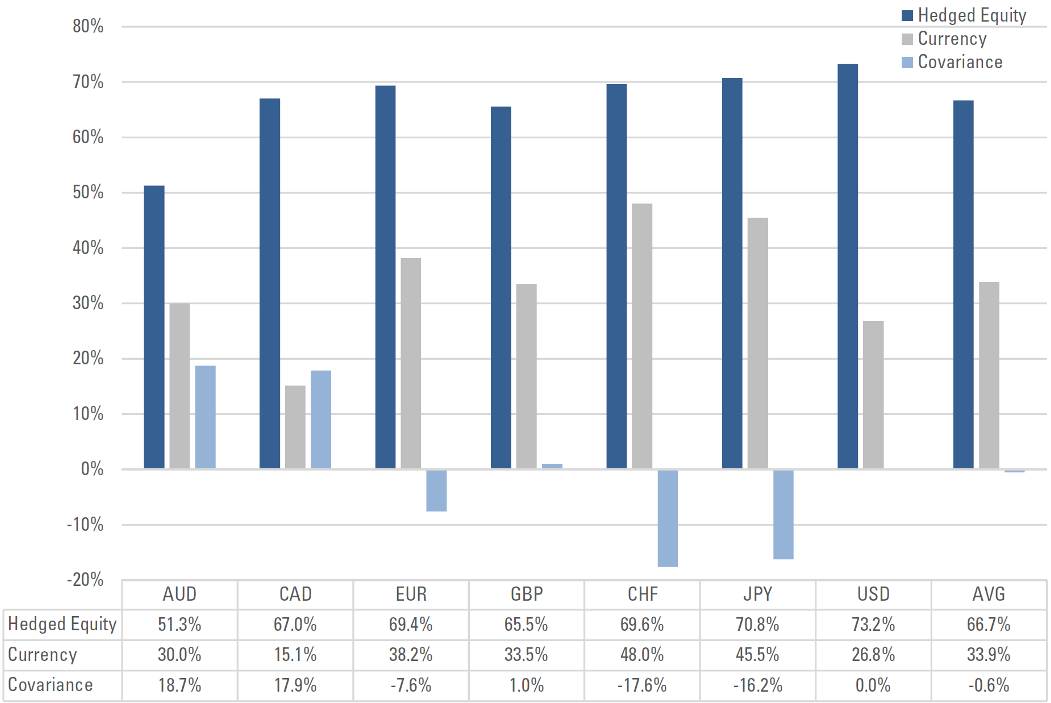
For a broad, cap-weighted USD-denominated DM portfolio,4 Figure 3 compares the contributions of these three aspects of risk to variation in total returns over the past 40 years. On average, currency-hedged equity returns have been the predominant source of portfolio variance, approximately 75%, and currencies have accounted for the remaining 25%.5 A 25% currency contribution to variance would allow for a roughly 13% reduction in portfolio volatility from a full currency hedge.6
The impact of covariation between equities and currencies has been a source of questions from investors. The decomposition shows that it sometimes exacerbates and sometimes diminishes portfolio variability, though the magnitude of the effect has tended to be modest. (The long-term contribution of currency-equity covariation is muted for several individual major currencies. See Appendix Figure A1.) A notable exception occurred during the GFC, when DM equities plunged, and most DM currencies simultaneously depreciated relative to the dollar. As a result, during that period the contribution from currency-equity covariance directly exceeded that from currency volatility.
Figure 3) Contributions to variance: DM cap-weighted equity portfolio (USD Numeraire)
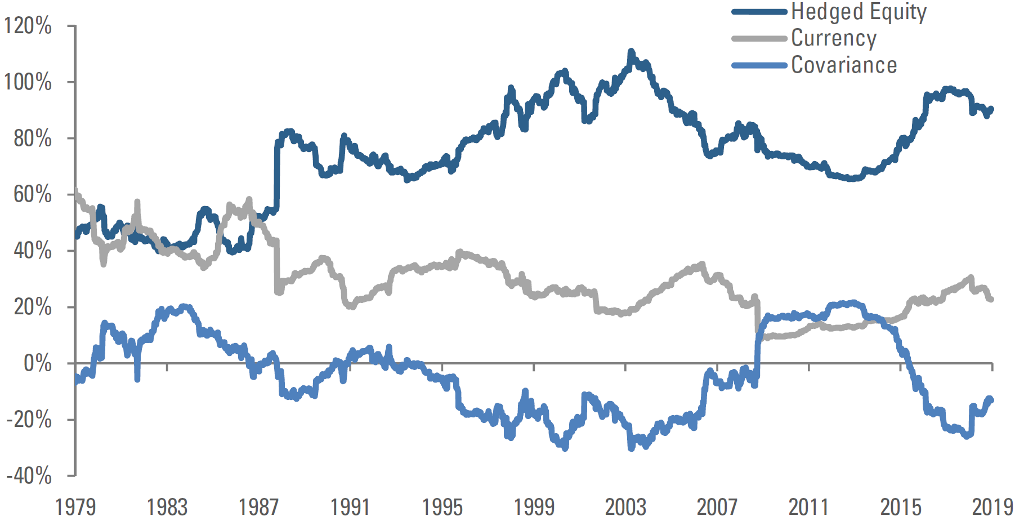
Series calculated for MSCI DM Index constituents based on equity market capitalization weights excluding FX returns when a given currency was not clearly in a floating regime. I.e., when it was pegged or managed. Correlations and variances calculated based on an expanding window and a 1.5 year half-life (3- year burn-in). Sources: Acadian analysis based on MSCI index composition data. For illustrative purposes only. It is not possible to invest directly in an index. Every investment program has the opportunity for losses as well as profits. Past results are not indicative of future results.
Figure 4) Contributions to variance: EM cap-weighted equity portfolio (USD Numeraire)
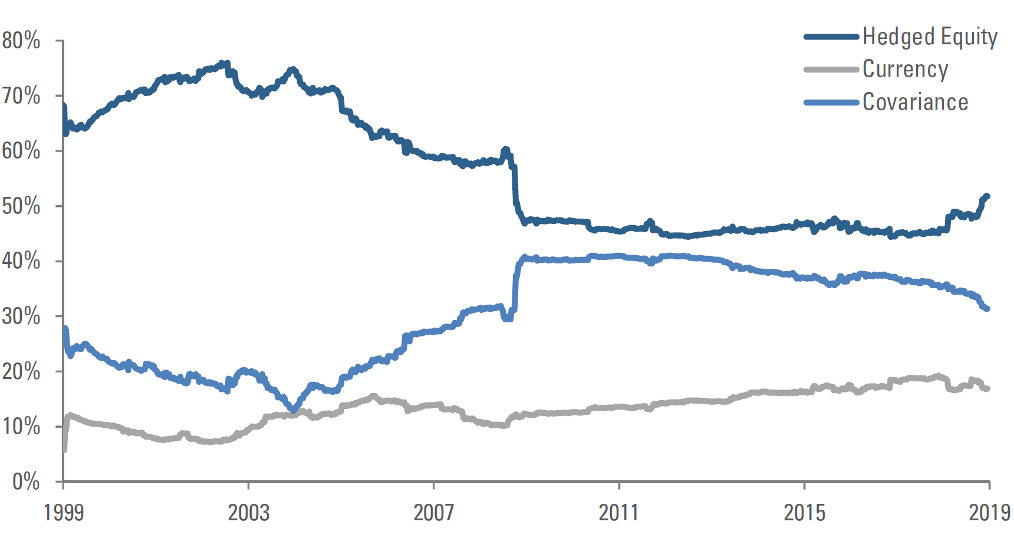
Series calculated for MSCI EM Index constituents based on equity market capitalization weights excluding FX returns when a given currency was not clearly in a floating regime. I.e., when it was pegged or managed. Correlations and variances calculated based on an expanding window and a 1.5 year half-life (3-year burn-in). Sources: Acadian analysis based on MSCI index composition data. For illustrative purposes only. It is not possible to invest directly in an index. Every investment program has the opportunity for losses as well as profits. Past results are not indicative of future results.
In EM, currency exposure is a larger source of risk than in DM, as shown in Figure 4. Hedged equity returns have contributed only approximately 55% of portfolio variance. Currencies have directly accounted for only 15% of the variance, even smaller than in DM. But unlike in DM, currency-equity covariance has consistently and materially increased portfolio risk for a U.S. investor, accounting for approximately 30% of total variation on average.
In EM, therefore, potential volatility reduction benefits from currency hedging have been considerably larger than in DM, on the order of 25%. The consistently positive contribution of currency-equity covariance to portfolio return variance highlights the extent to which the market views EM currencies as risk assets. This is further evidenced in individual country currency-equity correlations in Appendix Figure A2.
While the above analysis measures risk from the perspective of a U.S. investor, we could repeat these exercises relative to any home currency. Using the DM context, as an example, Appendix Figure A3 compares variance decompositions across a range of base currencies instead of the U.S. dollar, including a blended “DM composite numeraire.” The contributions picture remains similar; hedged equities and currencies have accounted for roughly two thirds and one third of portfolio variation, respectively.7
To summarize, in both DM and EM, currency exposure contributes materially to total risk. The logical next question is how much it costs to hedge that risk away.
COST OF HEDGING CURRENCY RISK: IMPACT ON RETURNS
The return differential between hedged and unhedged portfolios is determined by both currency appreciation/ depreciation over the life of the hedge, i.e., spot FX returns, as well as by “carry,” i.e., the financing cost of the hedge. Carry depends on the difference in interest rates between the investor’s home country and the foreign market as implied in currency forward pricing.
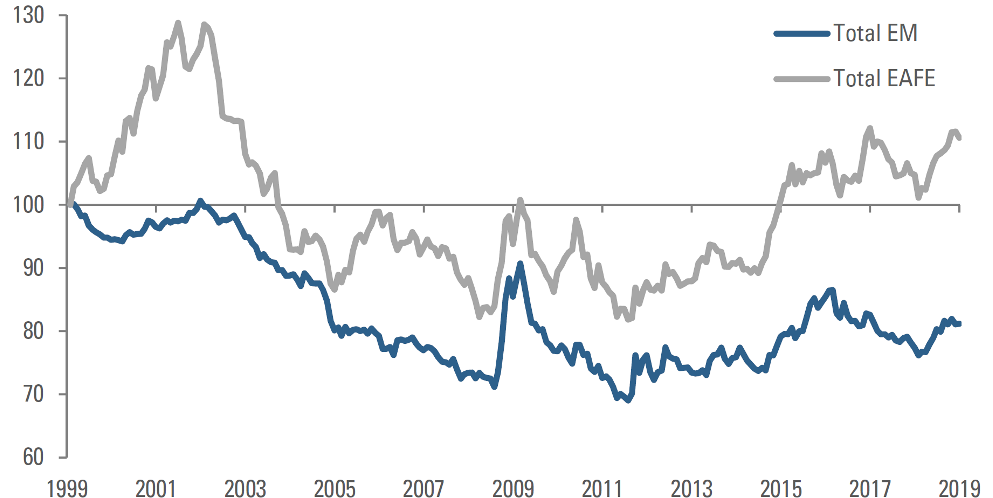
Figure 5 shows the evolution of currency hedge returns, i.e., spot FX returns net of carry, over the past 20 years from the perspective of a USD investor. We simply imply the hedge returns from the difference between returns of MSCI currency-hedged and unhedged benchmarks. For DM, the grey trace shows that hedged index returns have exceeded unhedged by roughly 0.5% per year, on average. This suggests that U.S.-based equity investors have been able to earn a small credit from hedging DM currency exposure (ignoring transaction costs on the forwards). In contrast, in EM, the implied average return on the hedge has amounted to performance drag of 1% per year.
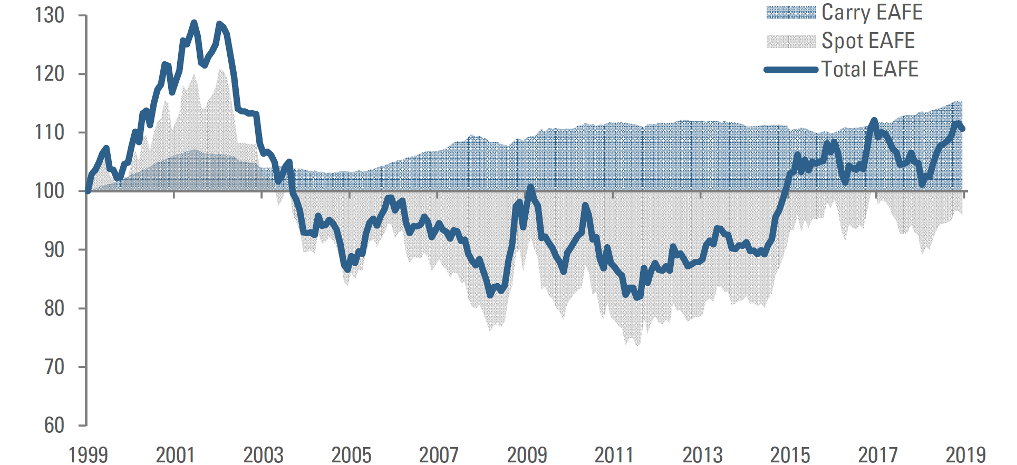
To shed further light on the drivers of the hedging tailwind/drag, Figure 6 shows 20 years of cumulative returns attributable to spot FX moves and carry in EAFE, again from the perspective of a USD investor. In DM, spot FX returns have been immaterial, on average.
Nevertheless, around risk-off events, e.g., the TMT bubble and the GFC, sudden currency appreciation or depreciation has at times had a substantial impact. The carry contribution, in contrast, has been modestly positive, on average, from the perspective of a USD investor. This reflects a tendency towards lower interest rates in EAFE than in the U.S. over the past 20 years.8 Since 2015, the benefit from carry has been trending higher, reflecting the pick-up in short-term U.S. rates relative to the rest of DM. If that trend were to reverse, diminished carry benefit or emergence of a carry cost could meaningfully alter the riskreward tradeoff from hedging.
Figure 5) Cumulative implied returns on currency hedges
Implied returns on currency hedges calculated from returns of MSCI EAFE 100% Hedged to USD Index (USD) / MSCI EAFE Index (USD) and MSCI EM US Dollar Hedged Index (USD) / MSCI EM Index (USD). Sources: Acadian calculations based on index levels from MSCI. Copyright MSCI 2019. All Rights Reserved. Unpublished. PROPRIETARY TO MSCI. For illustrative purposes only. It is not possible to invest directly in an index. Every investment program has the opportunity for losses as well as profits. Past results are not indicative of future results.
Figure 6) Cumulative spot and carry contributions to implied returns on currency hedges
Composite FX spot return calculated from individual currency spot returns versus USD and aggregated based on weights from the relevant equity index. Implied carry calculated as implied currency return /spot Index. Sources: Acadian calculations based on index composition data from MSCI, spot FX levels from Bloomberg. Copyright MSCI 2019. All Rights Reserved. Unpublished. PROPRIETARY TO MSCI. For illustrative purposes only. It is not possible to invest directly in an index. Every investment program has the opportunity for losses as well as profits. Past results are not indicative of future results.
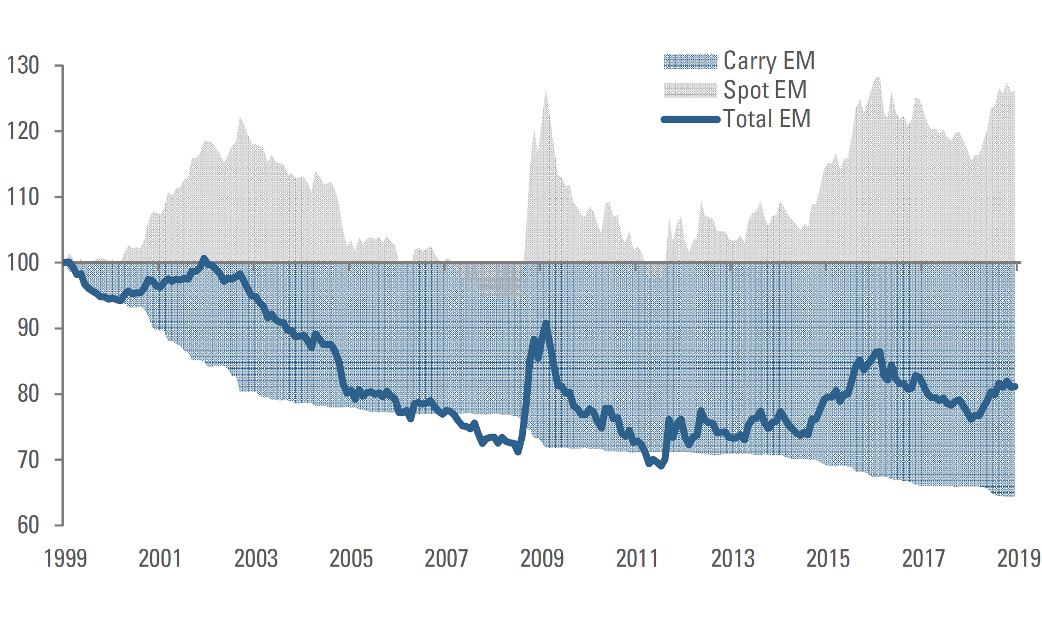
Figure 7) Cumulative spot and carry contributions to implied return on currency hedge (EM)
Composite FX spot return calculated from individual currency spot returns versus USD and aggregated based on weights from the relevant equity index. Implied carry calculated as implied currency return /spot Index. Sources: Acadian calculations based on index composition data from MSCI, spot FX levels from Bloomberg. Copyright MSCI 2019. All Rights Reserved. Unpublished. PROPRIETARY TO MSCI. For illustrative purposes only. It is not possible to invest directly in an index. Every investment program has the opportunity for losses as well as profits. Past results are not indicative of future results.
Figure 7 presents a much different picture for EM. Currencies have weakened considerably since 2013, which has benefitted hedgers by an average 1.2% worth of depreciation protection per year. But that benefit has been more than offset by drag from carry costs averaging 2.2% per year, reflecting the substantial wedge between EM and U.S. interest rates. EM carry costs have been declining in recent years, however, contributing to better hedge performance. (See Appendix Figure A4.)
CONCLUSION: PUTTING IT ALL TOGETHER
The net benefits of long-term currency hedging have been inconsistent over the years, leaving open enduring questions as to whether and in what contexts hedging is a “free lunch.” Given the lack of certainty regarding these issues, it’s understandable that many investors have thrown up their hands and adopted completely unhedged, fully hedged, or other static positions, such as the 50 50 hedge of “least regret” based on heuristics. However, these heuristic approaches have not spared investors from extended periods of relative underperformance.
From this complex picture, we can still glean broad insights. In DM, currency-hedged U.S. investors have benefitted from a long regime of low implied carry costs; in fact, carry has at times been accretive to hedgers, providing some cushion during periods of DM currency strength relative to the U.S. dollar. In EM, implied carry costs have been higher than in DM. Earlier in our sample, punitive carry costs tilted the balance in favor of unhedged investors. However, recent declines in carry costs have contributed to better risk adjusted performance for currency-hedged investors.
Investors sensitive to these dynamic risk-reward tradeoffs can benefit from a more holistic consideration of drivers of returns, risks, and costs for both equities and currencies. This could include outlooks on currency valuation, macroeconomics, sentiment, and carry as well as the use of dynamic risk models that incorporate views on risk over various horizons. Risk models can also accommodate temporal and cross-sectional variation in equity and currency volatility as well as the covariation between currencies and equities. Informed approaches may be better positioned than uncertainty-driven heuristics to help investors navigate transient imbalances and secular trends that affect risk-reward tradeoffs in currency hedging.
APPENDIX
Figure A1: Currency-Equity correlations – USD vs. DM-composite Numeraire (Jan 1976 – Dec 2018)
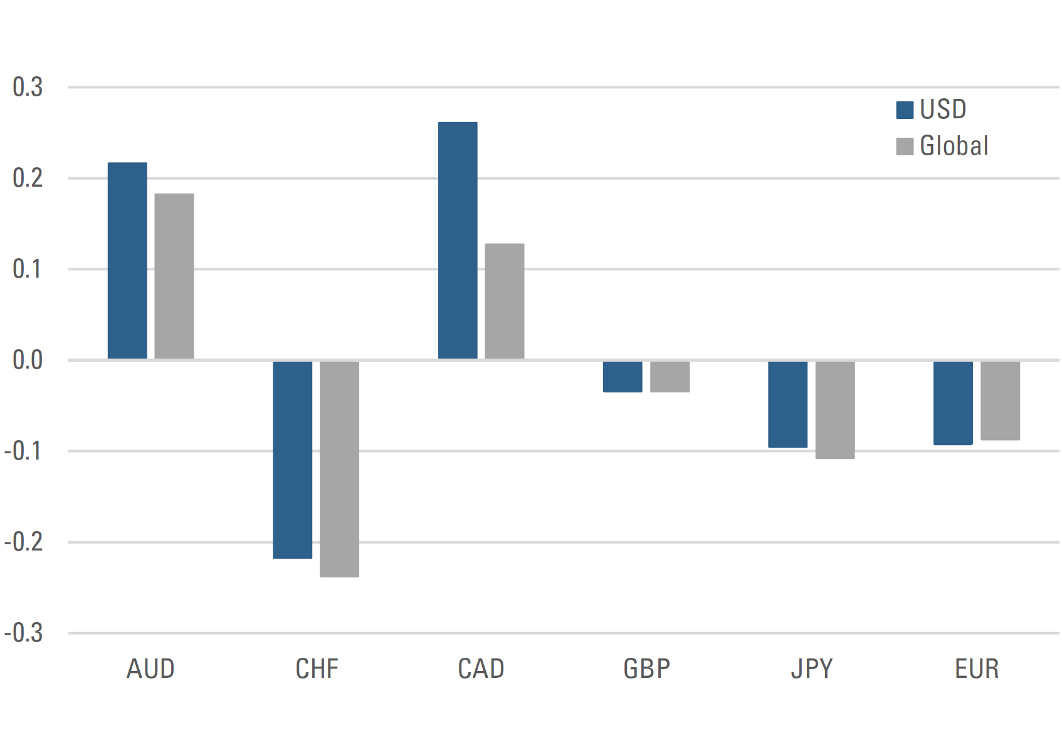
Developed currency-equity correlations using a U.S. dollar numeraire versus a global numeraire (equal-weighted). Sources: Acadian analysis, MSCI data. Copyright MSCI 2019. All Rights Reserved. Unpublished. PROPRIETARY TO MSCI. For illustrative purposes only. Every investment program has the opportunity for losses as well as profits. Past results are not indicative of future results.
Figure A2: Currency-Equity correlations – USD vs. DM-Composite Numeraire (Jan 1999- Dec 2018)
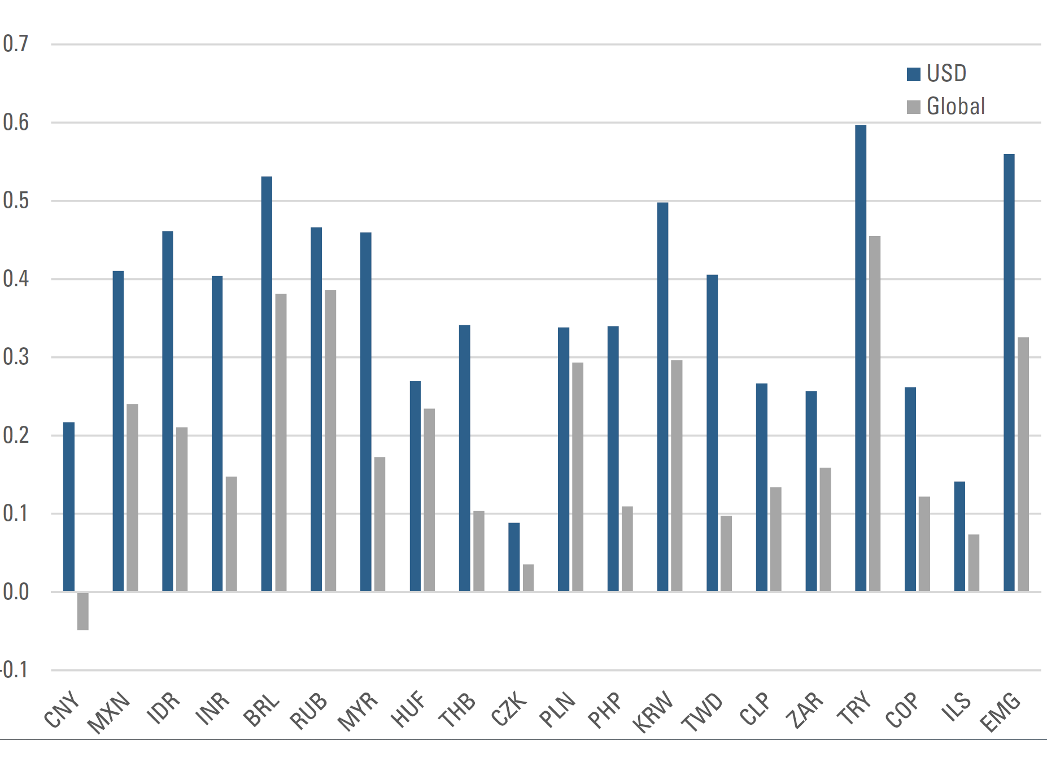
Emerging currency-equity correlations using a U.S. dollar numeraire versus a global numeraire (equal- weighted). Sources: Acadian analysis, MSCI data. Copyright MSCI 2019. All Rights Reserved. Unpublished. PROPRIETARY TO MSCI. For illustrative purposes only. Every investment program has the opportunity for losses as well as profits. Past results are not indicative of future results.
Figure A3: Variance decomposition for DM — DM-Composite Numeraire (Jan 1976– Dec 2018)
Variance contribution for the Developed Markets ex-U.S. index using a DM-composite numeraire. The DM index is constructed using market capitalization weighted MSCI country indices. Sources: Acadian analysis, MSCI data. For illustrative purposes only. It is not possible to invest directly in an index. Every investment program has the opportunity for losses as well as profits. Past results are not indicative of future results. Index source: MSCI. Copyright MSCI 2019. All Rights Reserved. Unpublished. PROPRIETARY TO MSCI.
Figure A4: Carry earned on currency forward baskets in DM and EM
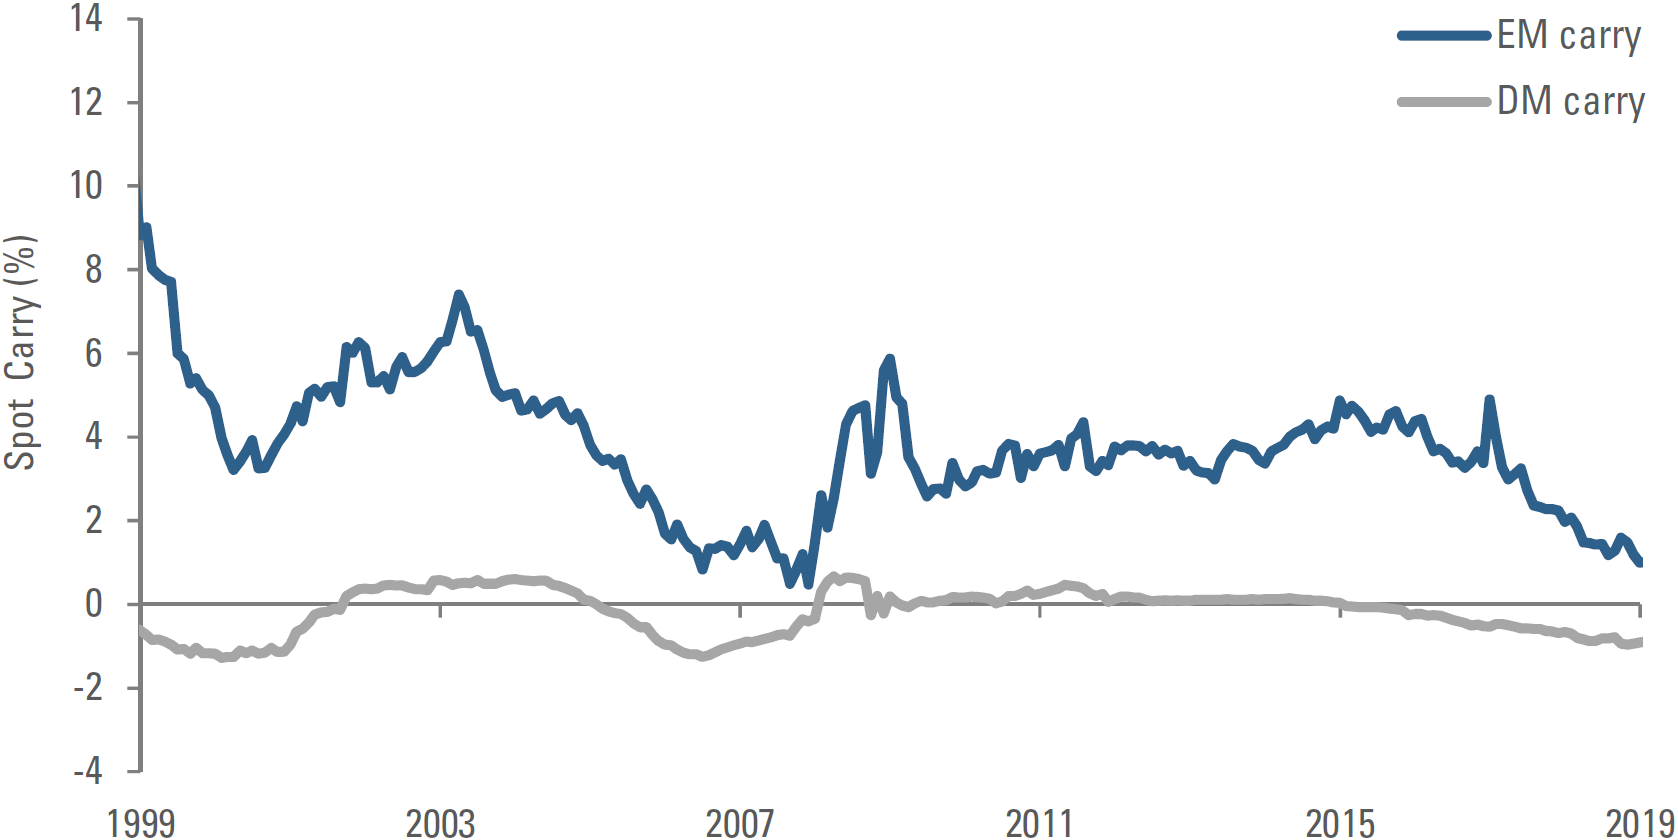
Carry earned on DM and EM baskets using liquid, investible 3m currency forwards weighted by equity market capitalization. Sources: Acadian analysis, MSCI data, and Reuters data. Copyright MSCI 2019. All Rights Reserved. Unpublished. PROPRIETARY TO MSCI. For illustrative purposes only. Every investment program has the opportunity for losses as well as profits. Past results are not indicative of future results.
Endnotes
- DM FX returns = MSCI EAFE returns – 100% FX hedged MSCI EAFE returns. EM FX returns = MSCI EM returns – 100% FX hedged MSCI EM returns. All returns are in USD.
- Data as of 31-Dec-18. Sources: MSCI index factsheets. Copyright MSCI 2019. All Rights Reserved. Unpublished. PROPRIETARY TO MSCI.
- The decomposition assumes that currency forwards are used to hedge. It ignores transaction costs.
- Portfolio constructed from MSCI DM country index components, as classified on the relevant date, weighted by float-adjusted market capitalization. Portfolio excludes returns for markets during periods where the associated currency was not clearly in a floating regime. I.e., it was pegged or managed.
- To be clear, in the variance decompositions we report variability attributable to currencies based on returns of FX forwards rather than changes in FX spot rates in isolation. Variance of forward returns also reflects a relatively small contribution from variation in the financing cost of the forward (carry).
- If the variance of the hedged portfolio were roughly 75% of the unhedged, then its volatility would be roughly 86.6% of the unhedged.
- For DM-composite numeraire analyses, we adopt the framework from: Campbell John, Karine Serfaty-De Medeiros, and Luis Viceira, “Global Currency Hedging,” Journal of Finance, 2010, vol. 65(1), 2010, pages 87-121, 02.
- To hedge long exposure to foreign currencies in an equity portfolio, a USD investor would borrow foreign currency to buy USD, paying interest on the former and earning interest on the latter.
Legal Disclaimer
These materials provided herein may contain material, non-public information within the meaning of the United States Federal Securities Laws with respect to Acadian Asset Management LLC, Acadian Asset Management Inc. and/or their respective subsidiaries and affiliated entities. The recipient of these materials agrees that it will not use any confidential information that may be contained herein to execute or recommend transactions in securities. The recipient further acknowledges that it is aware that United States Federal and State securities laws prohibit any person or entity who has material, non-public information about a publicly-traded company from purchasing or selling securities of such company, or from communicating such information to any other person or entity under circumstances in which it is reasonably foreseeable that such person or entity is likely to sell or purchase such securities.
Acadian provides this material as a general overview of the firm, our processes and our investment capabilities. It has been provided for informational purposes only. It does not constitute or form part of any offer to issue or sell, or any solicitation of any offer to subscribe or to purchase, shares, units or other interests in investments that may be referred to herein and must not be construed as investment or financial product advice. Acadian has not considered any reader's financial situation, objective or needs in providing the relevant information.
The value of investments may fall as well as rise and you may not get back your original investment. Past performance is not necessarily a guide to future performance or returns. Acadian has taken all reasonable care to ensure that the information contained in this material is accurate at the time of its distribution, no representation or warranty, express or implied, is made as to the accuracy, reliability or completeness of such information.
This material contains privileged and confidential information and is intended only for the recipient/s. Any distribution, reproduction or other use of this presentation by recipients is strictly prohibited. If you are not the intended recipient and this presentation has been sent or passed on to you in error, please contact us immediately. Confidentiality and privilege are not lost by this presentation having been sent or passed on to you in error.
Acadian’s quantitative investment process is supported by extensive proprietary computer code. Acadian’s researchers, software developers, and IT teams follow a structured design, development, testing, change control, and review processes during the development of its systems and the implementation within our investment process. These controls and their effectiveness are subject to regular internal reviews, at least annual independent review by our SOC1 auditor. However, despite these extensive controls it is possible that errors may occur in coding and within the investment process, as is the case with any complex software or data-driven model, and no guarantee or warranty can be provided that any quantitative investment model is completely free of errors. Any such errors could have a negative impact on investment results. We have in place control systems and processes which are intended to identify in a timely manner any such errors which would have a material impact on the investment process.
Acadian Asset Management LLC has wholly owned affiliates located in London, Singapore, and Sydney. Pursuant to the terms of service level agreements with each affiliate, employees of Acadian Asset Management LLC may provide certain services on behalf of each affiliate and employees of each affiliate may provide certain administrative services, including marketing and client service, on behalf of Acadian Asset Management LLC.
Acadian Asset Management LLC is registered as an investment adviser with the U.S. Securities and Exchange Commission. Registration of an investment adviser does not imply any level of skill or training.
Acadian Asset Management (Singapore) Pte Ltd, (Registration Number: 199902125D) is licensed by the Monetary Authority of Singapore. It is also registered as an investment adviser with the U.S. Securities and Exchange Commission.
Acadian Asset Management (Australia) Limited (ABN 41 114 200 127) is the holder of Australian financial services license number 291872 ("AFSL"). It is also registered as an investment adviser with the U.S. Securities and Exchange Commission. Under the terms of its AFSL, Acadian Asset Management (Australia) Limited is limited to providing the financial services under its license to wholesale clients only. This marketing material is not to be provided to retail clients.
Acadian Asset Management (UK) Limited is authorized and regulated by the Financial Conduct Authority ('the FCA') and is a limited liability company incorporated in England and Wales with company number 05644066. Acadian Asset Management (UK) Limited will only make this material available to Professional Clients and Eligible Counterparties as defined by the FCA under the Markets in Financial Instruments Directive, or to Qualified Investors in Switzerland as defined in the Collective Investment Schemes Act, as applicable.