
Leverage, an Essential Tool: Using the full set of portfolio characteristics to create investments
Key Takeaways
- Three essential characteristics of an active equity portfolio are risk, expected return (“alpha”), and leverage.
- These characteristics are sufficiently independent to allow expression in many combinations, and the resulting ability to design portfolios for a wide range of applications is a valuable and underappreciated consequence.
- This paper surveys three Acadian equity strategies that together demonstrate the range of possibilities, a range which includes the potentially surprising result that higher-leverage portfolios can have higher information ratios and less active risk than their lower-leverage counterparts.
Table of contents
Introduction
Tradeoffs: Risk Versus Return
Investors know about tradeoffs. For example, monitoring the balance between risk and return is a vital aspect of sound investment management. In active management, the tradeoff between risk and return is so essential that it earns its own ratio, the “information ratio,” which quantifies what is gained (active returns) at what cost (active risk).
Tradeoffs in 3D: Adding the Missing Dimension
There is another characteristic that is sufficiently unrelated to risk and return that it merits separate categorization, namely, leverage. In practice, this essential third dimension is not as clearly understood as the other two, and investors may confuse risk and leverage especially. While it is true that taking a long-only portfolio to 130/301 may entail taking additional active risk, it is not the case that the mapping is one-to-one, with a specific tracking error being associated with each amount of leverage. In fact, for any given amount of leverage, there are many tracking errors that could obtain at that leverage. Similarly, there are many amounts of expected return (“alpha”) that could be achieved as well.
With three essential and independent characteristics— risk, return, and leverage—investors have many customization opportunities and many margins on which to adjust. For example, they can adjust alpha and tracking error while holding leverage constant, adjust alpha and leverage while holding tracking error constant, or adjust tracking error and leverage while holding alpha constant.
Moreover, investors have considerable choice in how their portfolios respond to changes in the investing environment. For example, if the environment suddenly became riskier, an investor could absorb that change partially in leverage (by bringing it down), rather than absorb it fully in expected return.
Two Reference Strategies
To highlight these opportunities and tradeoffs, this paper discusses two Acadian strategies: a “dynamic leverage” strategy that does not exceed 160/60 leverage and a more traditional fixed-leverage strategy that maintains strict 130/30 leverage. Both portfolios are good portfolios, and each is appropriate for different investor situations. However, the two strategies are different.
Notably, the 160/60 (dynamic leverage) strategy is not simply a leveraging of the 130/30 strategy. More detailed discussion follows, but briefly, the dynamic leverage strategy is designed to have alpha similar to that of the 130/30 strategy, but with materially lower tracking error and consequently higher information ratio. Thus, it would be impossible to replicate the dynamic leverage strategy simply by leveraging the 130/30 strategy; each strategy must be built on its own, with design intent.
These are only two portfolios out of the many that are feasible, given the full range of possibilities afforded by the three dimensions of return, risk, and leverage. Customization opportunities abound, but we believe these two standardized strategies will meet the needs of a broad set of investors.
The Strategies
Table 1 presents characteristics of three Global ACW strategies: the two extension strategies mentioned above, plus a long-only strategy for comparison.
Table 1: Summary Comparison — Three Global ACW Strategies
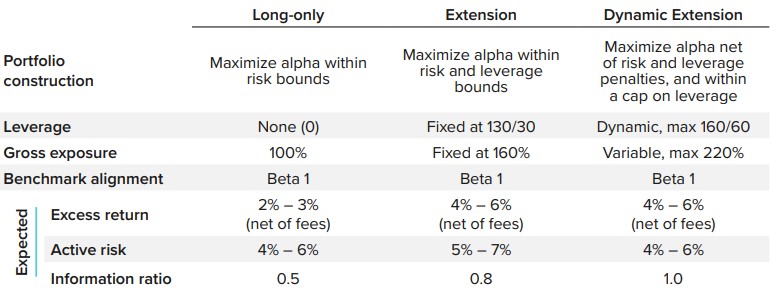
As the table indicates, all three strategies aim to maximize alpha exposure subject to risk bounds or penalties; in the case of the extension strategies, the maximization also is subject to requirements on leverage. The long-only and 130/30 strategies have constant (or no) leverage, while the dynamic 160/60 strategy may exhibit variable leverage, to be discussed further below. Return expectations are higher for the extension strategies relative to the long-only strategy by a meaningful amount, at least 100 basis points. However, active risk is not monotonic in leverage, and the higher-leverage extension portfolio is not expected to have active risk materially different from the long-only portfolio.
The first row of the table reports differences in portfolio construction. The long-only and traditional extension strategies maximize alpha (expected active return) subject to constraints on tracking error and leverage, while the dynamic extension strategy maximizes alpha net of risk and leverage penalties and subject to a leverage upper bound. It is this last difference in portfolio construction that permits the dynamic extension strategy to exhibit time-varying leverage, according to market conditions.
The following subsections review these and related strategy attributes in detail.
Leverage
Figure 1 plots leverage over time for the three hypothetical Global ACW strategies (left panel), and, for additional comparison, for three hypothetical EAFE strategies (right panel). In both panels, the strategies are long-only (gray lines), traditional 130/30 (light blue), and dynamic 160/60 (dark blue). All hypothetical portfolios are observed over the same 15-year period, 2010–2024.
Figure 1: Leverage in Hypothetical Global ACW and EAFE Strategies, 2010–2024
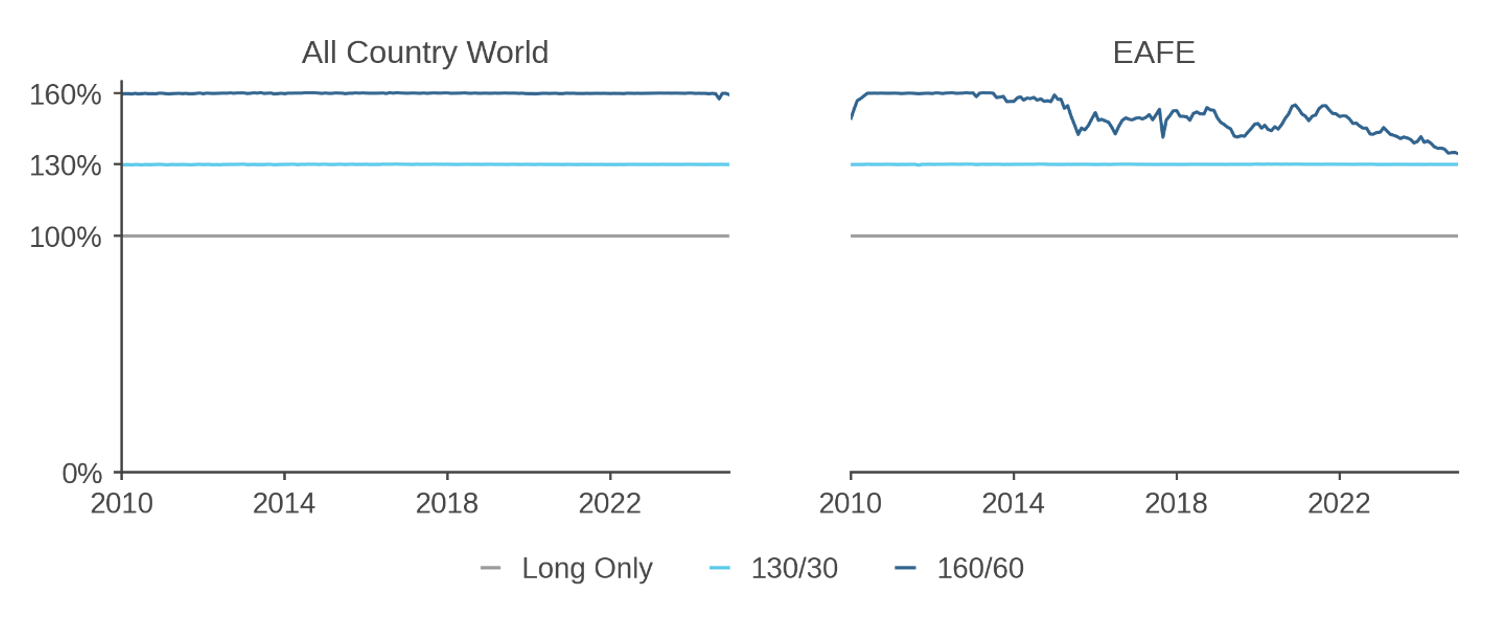
In both panels, the strategies clearly separate, as expected and consistent with their names. The long-only strategies naturally sit at precisely 100% long-side weight, i.e., at zero leverage, with no variation over the full sample. Short positions are forbidden in these strategies, and modest cash holdings, which are de minimis in any case, do not count as “negative” leverage.
The traditional 130/30 strategies also exhibit stable leverage.2 In contrast, the dynamic 160/60 strategy is different: as advertised, it is often at or near its permitted upper bound of 160% weight on its long side, as in ACW over this period, but it can evidence more variation than the other two strategies, as in EAFE. The dynamic strategy can reduce leverage when the investing environment has higher volatility, higher transaction costs, or when the dispersion of return forecasts in the investable universe is lower.3 Sections below discuss the variable-leverage design feature in additional detail.
Realized Risk and Return
Figure 2 presents realized cumulative active returns for the three hypothetical ACW strategies, together with their annualized averages and tracking errors. All strategies earn positive active returns over the period, but the two levered strategies accumulate active performance faster than the long-only strategy. This pattern is an expected and natural result of the levered strategies’ access to shorting, discussed further below.
Figure 2: Realized Active Returns
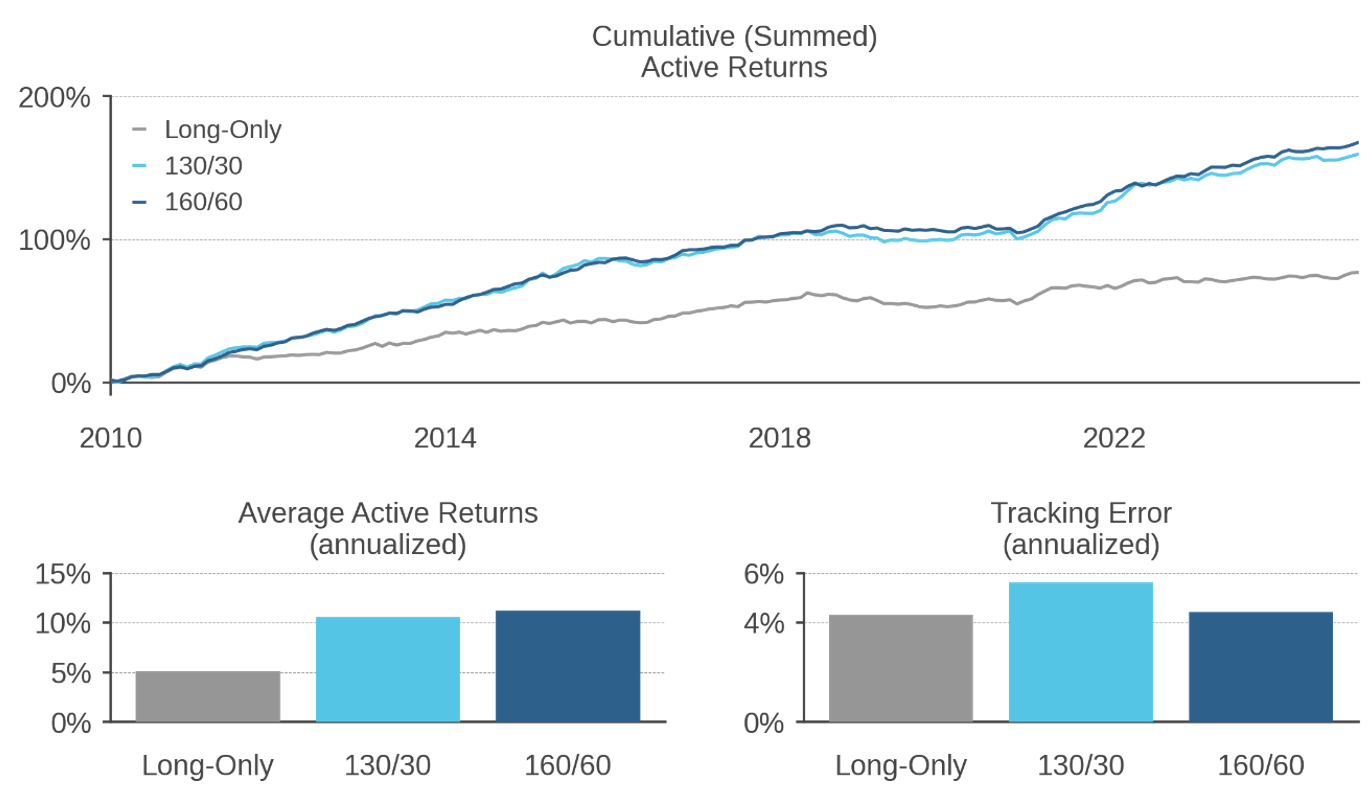
The two levered strategies’ average returns are not statistically distinguishable from each other at conventional levels, though these strategies’ returns are reliably higher than the long-only strategy’s returns. This pattern also is an intentional design feature: the dynamic 160/60 strategy and the standard 130/30 strategy are calibrated to have the same total alpha exposure and thus similar average returns.4
However, as evidenced in the lower right panel, the dynamic strategy has lower tracking error than the standard 130/30 strategy. This final and important distinction also is intentional and results in a higher information ratio in the dynamic 160/60 strategy.
Additional Features
Table 1 also presents the three strategies’ market “alignments” or CAPM betas. In all three cases, the strategies are designed to have unit market beta, that is, full (but not levered) exposure to the market. When markets fluctuate, all three strategies are expected to fluctuate similarly to the market and to each other, and to other strategies that maintain full market exposure.
In summary, the long-only, traditional extension, and dynamic extension strategies have leverage of zero, 130/30, and variable with a 160/60 maximum, respectively. Expectations for excess returns are higher for the leveraged strategies (4% – 6% net of fees) than for the long-only strategy (2% – 3% net of fees), but there is no expected return difference between the two levered strategies. Expectations for active risk (tracking error) are the same for the long-only and dynamic extension strategies (4% – 6%) and higher (5% – 7%) for the traditional extension strategy. These characteristics are the result of intentional design choices, and they result in an information ratio ordering that increases steadily from long-only (0.5) to traditional extension (0.8) to dynamic extension (1.0).
Discussion
Return
The two extension strategies share an advantage: both have higher average returns than the similar long-only strategy (Figure 2). This difference is consistent with the most common motivation for allowing at least some leverage into net-long, beta-one portfolios, namely the improvement in expected returns that obtains when the set of expressible negative views expands. To take a positive view on a stock, a portfolio simply needs an overweight, a position that any portfolio can take for any available stock. But negative views are harder to express, since they require underweighting a stock relative to the portfolio’s benchmark. When a stock has low or no weight in the benchmark, it becomes impossible to express any meaningful negative view. Thus, relaxing the shorting constraint and permitting underweights to the substantial portion of stocks with negative alpha forecasts naturally improves active return potential. The extension portfolios, traditional and dynamic, both benefit from having this (vastly) expanded universe of potential underweights.
Figure 3: Stock-Specific Share of Active Variance (Ex Ante5)
Hypothetical global ACW strategies, 2010–2024
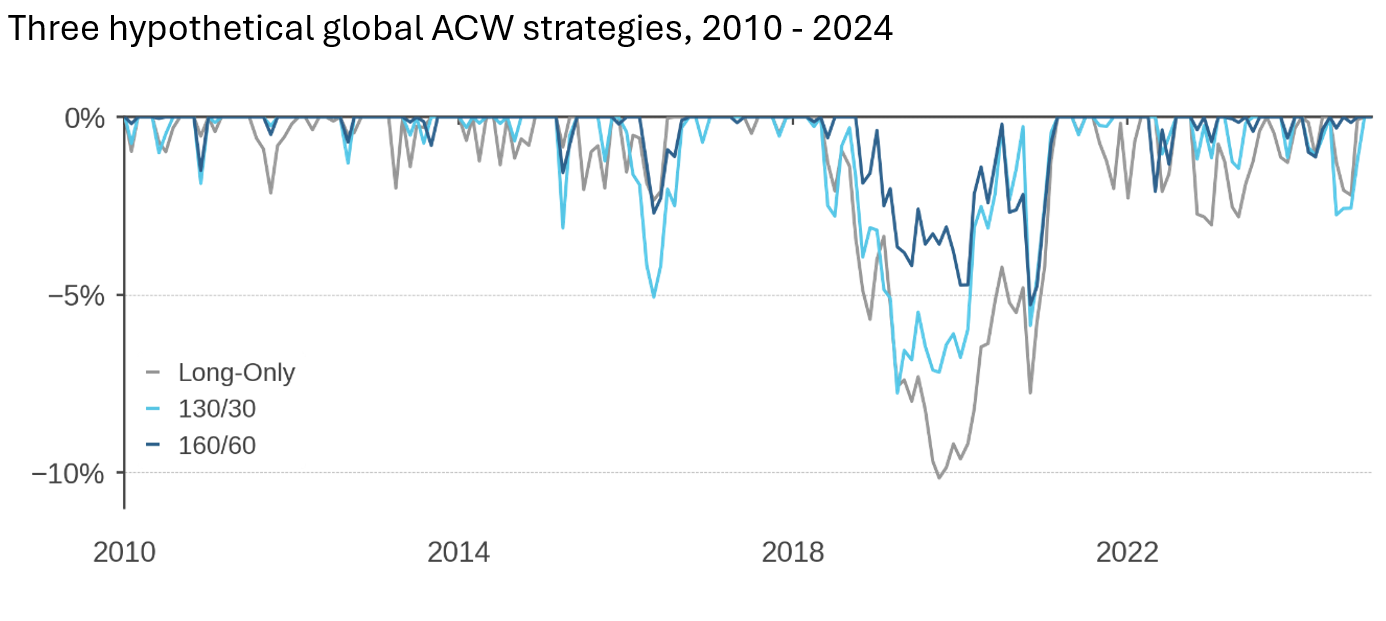
Figure 4: Active Drawdowns
Three hypothetical global ACW strategies, 2010 - 2024
Risk
As Table 1 indicates, the long-only and dynamic extension strategies are expected to realize tracking errors in the range of 4-6%, while the traditional extension strategy is expected to realize tracking error in the range of 5-7%. These relationships are the result of specific design choices: for example, Acadian could have designed the traditional extension strategy to exhibit the same or even lower tracking error than the long-only strategy, and it is not unusual to see extension portfolios designed with such a feature in mind. However, such a design choice would have required a corresponding reduction in expected return of the strategy, holding leverage constant at 130/30. In conversations with asset owners, Acadian learned that for many traditional extension investors, expected return is paramount, and so we designed our traditional extension strategy to maximize return. We set the tracking error budget to be marginally higher than the corresponding long-only strategy, to produce as much expected return as possible at 130/30 leverage.
Higher Leverage, Lower Risk?
The preceding figures and table show that Acadian’s dynamic extension strategy, typically at 160/60 leverage, has expected active returns that are similar to Acadian’s traditional extension strategy, reliably at 130/30 leverage, and that the dynamic extension strategy also has lower active risk and thus a higher information ratio. (The lower risk of the dynamic 160/60 strategy is robust to definitions of risk that go beyond tracking error, including higher moments of the active returns distribution, observed likelihood of tail outcomes, and—as shown in Figure 4— drawdowns.) But how is it possible to have higher leverage and lower tracking error?
The dynamic extension strategy lowers risk while increasing leverage in two principal ways, which in turn have useful additional characteristics. First, as shown in Figure 3, the dynamic extension strategy prioritizes diversifiable idiosyncratic risk, which facilitates reduced exposure to more systematic and less diversifiable factor and “style” risks. Idiosyncratic risk allows diversification and consequent risk reduction, even in the presence of leverage. Second, the dynamic extension strategy takes more diversified exposure to Acadian's positive and negative return forecasts. Figure 5 demonstrates this pattern graphically: three panels, one for each strategy, show portfolio weights to stocks sorted by alpha (Acadian forecast).
Figure 5: Portfolio Weights by Alpha (Forecast Return)
Three hypothetical global ACW strategies, as of Dec 31, 2024
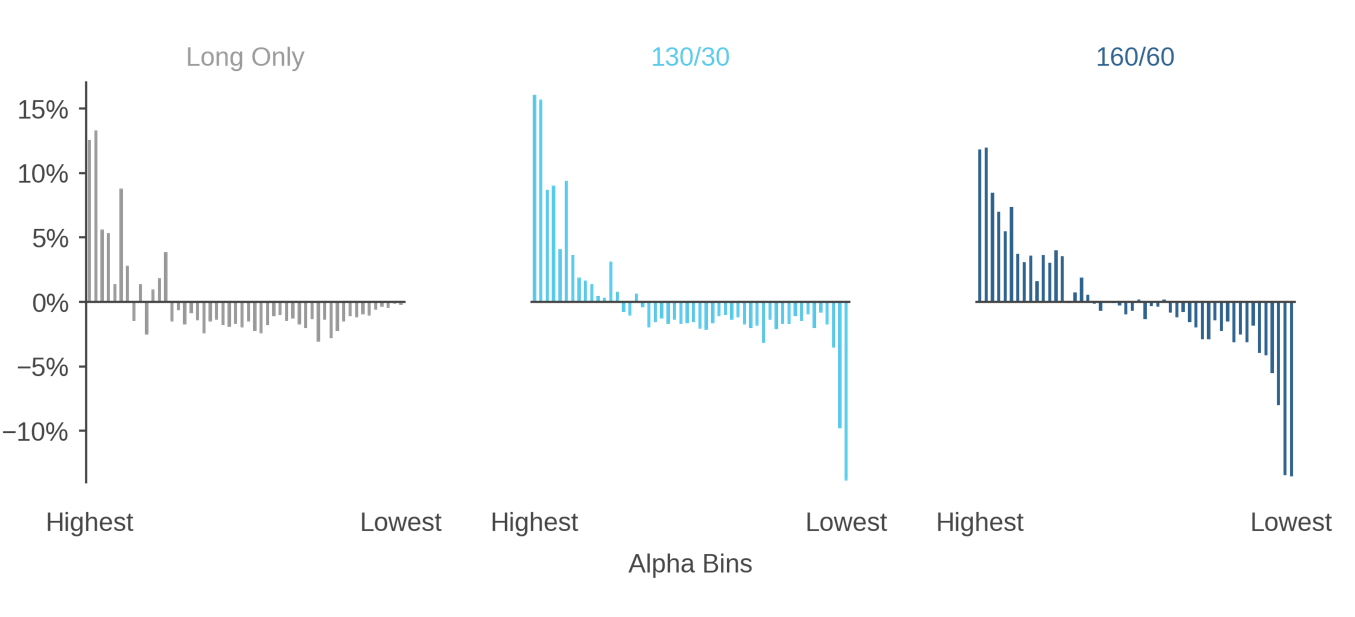
In the left-hand panel, the long-only portfolio gets modest exposure to the stocks with the highest return forecasts, and it funds those overweights with underweights principally to stocks with middle-of-the-road forecasts, many of them large caps. In sharp contrast, the middle panel shows that the traditional 130/30 extension strategy is able to gain materially greater exposure to the strongest return forecasts, which it funds partly via underweights to mid-range, neutral forecasts as in the long-only case, but also via strong underweights to the worst forecasts, many of which are non-benchmark stocks that a long-only portfolio cannot underweight due to its no-shorting constraint. In the right-hand panel, the dynamic extension also takes advantage of its ability to short the lowest-alpha stocks, but it expresses smoother and broader exposures to high- and low-alpha names without taking as much exposure to mid-range, neutral forecasts. In total, the dynamic extension strategy has roughly the same aggregate alpha as the traditional extension strategy, but the dynamic extension’s smoother allocation across alpha forecasts helps it moderate risk.
As an additional associated effect, particularly of its preference for diversified alpha exposures, the dynamic 160/60 generally holds more exposure to liquid stocks with greater market capitalizations, which in turn reduces shorting and margin costs. These additional benefits come at the expense of having lower expected return compared to other possibilities at 160/60 leverage, as well as having modestly higher total financing costs than 130/30.
“Dynamic” Leverage
In the same way that the dynamic extension strategy penalizes active risk in its optimization, it also penalizes leverage (Table 1). This method of creating a “leverage aversion” allows the strategy to make a tradeoff between leverage and other portfolio characteristics, rather than being subject to a hard constraint as in traditional extension strategies, including Acadian’s. The flexibility to make these tradeoffs allows the strategy to reduce leverage in times of extreme market volatility, and to increase leverage when markets are calmer. Similarly, the strategy may make a leverage tradeoff under changing conditions in alpha dispersion (as in EAFE, Figure 1) or expected trading costs as well. The strategy incorporates a hard upper bound on leverage, so that leverage will not exceed 160/60, as shown in Table 1 and Figure 1.
By allowing changes in the investing environment to be absorbed in leverage, the strategy stabilizes its information ratio (relative to the maximum feasible information ratio) more than traditional strategies with fixed leverage, whether extension or long-only. For example, if the investing environment were to become riskier, the dynamic strategy could reduce leverage, versus holding leverage constant as in traditional strategies which consequently have greater variation in information ratio relative to the feasible maximum.
Drawdown Behavior
Investments in common shares are risky, and no equity strategy experiences exclusively positive active returns. From time to time, any Acadian equity strategy can experience active underperformance (an active “drawdown”), including the three strategies surveyed in this paper.
Expected patterns of drawdown behavior depend on a strategy’s design, but also on the source of or reason for the drawdown. For example, a strategy may underperform because Acadian’s alpha forecasts underperform, if there is a period in which high Acadian return forecasts are associated with low realized returns and vice-versa. In such a case, given that both extension strategies have greater exposure to Acadian alpha than a corresponding long-only strategy, the extension strategies may experience a deeper (more negative) drawdown than the long-only strategy. Because the dynamic and traditional extension strategies have, by design, roughly the same exposure to Acadian alpha, the magnitude of their alpha-driven drawdowns may be similar, with the potential for some relative outperformance of the dynamic extension strategy due to its more diversified alpha exposure as discussed above.
Drawdowns also can arise from sources unrelated (orthogonal) to Acadian’s return forecasts. In these instances, since the dynamic extension strategy is exposed to lower total active risk and lower systematic active risk, it may experience a lesser drawdown than the traditional extension strategy.
In any strategy that involves shorting, Acadian supplements its standard risk management processes with additional relevant controls. For example, guardrails prevent the opening of new short positions when borrow costs exceed a specified threshold and prompt covering of short positions when borrow costs exceed a higher specified threshold. The dynamic and extension strategies discussed here both use standard Acadian controls in their implementations.
Conclusion
Leverage is an independent portfolio characteristic that can be used in combination with other characteristics to design investment solutions. In many applications, using leverage as a third portfolio-construction dimension allows finer control over portfolios’ risk and return properties, which in turn enables better tailoring to investors’ specific needs.
The two hypothetical extension portfolios discussed in this paper have many similar properties, including better exposure to return forecasts (versus a similar long-only portfolio) via short-side expressions of negative views, a market beta of one, and similar total exposure to Acadian’s alpha model.
The two strategies have some distinctions as well, apart from their different amounts of leverage. The dynamic extension is expected to have lower tracking error than the traditional extension, and thus to have a higher information ratio. Additionally, the dynamic extension strategy has variable leverage (up to a cap of 160/60), whereas the traditional extension strategy is tightly bound to 130/30.
Each hypothetical extension strategy could be a sound investment. However, their differences suggest that each may have one or more applications in which it is the better fit. For example, many investors are constrained on leverage, with 130/30 being a common ceiling; many of these investors also are hungry for expected return and are less concerned about information ratio. For them, the traditional extension strategy may be more suitable.
For investors with more tolerance for leverage— including dynamic leverage—the dynamic extension offers a better risk-return tradeoff in the form of a higher information ratio, with increased exposure to idiosyncratic (versus systematic factor) risk, shallower drawdowns, and more diversified alpha exposure. This strategy also is expected to have higher liquidity and lower transaction costs. Any one of these differences could appeal to a reasoned investor, for whom the dynamic extension strategy may be a good choice.
At first, investors may be surprised to learn that higher-leverage portfolios can come with lower tracking error, but it is a myth that leverage always increases risk. Leverage is a tool, and when used properly, it can decrease risk. Increasing leverage is, in effect, the relaxing of a constraint, which allows the investor to “ask for more” on the other two dimensions of risk and return. While reducing risk ordinarily might require a corresponding loss in expected return, permitting greater leverage can allow full recovery of the lost expected return while still reducing tracking error. Such a maneuver is only possible because leverage is sufficiently independent of the other two dimensions. Critically, leverage is not merely a proxy for tracking error. Rather, the two are partially separable: there is a minimum level of tracking error for each amount of leverage, but beyond that point, there is a wide range of tracking errors available at any particular leverage.
When investors are free to use three dimensions of portfolio construction—risk, return, and leverage—many different combinations of these fundamental characteristics become available, and investors are more able to choose solutions tailored to their needs. The three strategies surveyed in this paper are good representatives of the feasible range of thoughtfully constructed equity strategies, and they make sound starting points for investors looking for well-researched solutions.
Endnotes
- This standard notation indicates a long-short portfolio that has 130% of invested capital on its long side, with the 30 percentage-point surplus funded by short positions that total 30% of invested capital. Such strategies often are called “extension” strategies: for an introduction, see Systematic 130/30: A Better Path to High Conviction, Acadian, February 2018.
- Leverage in the 130/30 strategy exhibits a small amount of variation nearly undetectable in the figure. In order to guarantee that the optimization process finds a solution, the portfolio is allowed to hover between 129/29 and 131/31 leverage, but for all practical purposes, as the panels demonstrate, these traditional extension strategies are reliably “130/30.”
- Over the period 2010–2024, the U.S. had higher “alpha dispersion,” i.e., a greater range between the highest and lowest forecasts of expected return, such that ACW also had higher alpha dispersion, while non-U.S. developed markets (EAFE) had lower alpha dispersion by comparison. Greater alpha dispersion means greater investment opportunity and will incline the dynamic leverage strategy toward maintaining maximal permitted leverage. The lower leverage taken by the dynamic strategy in EAFE reflects the lower alpha dispersion in that universe in this time period. Portfolio construction in both strategies is the same, and the ACW strategy has the potential to exhibit leverage variation in the way that the EAFE strategy has done, while maintaining the same ceiling of 160/60 leverage.
- The relative performance of the two strategies depends on properties of the relevant investment universe, such as its forecast breadth and alpha dispersion. As a result, we do not expect the 160/60 strategy to have alpha exposure greater than the 130/30 strategy in all cases. Please contact us to discus further.
- Ex ante tracking error is a risk model’s forward-looking estimate of the tracking error that a stock or portfolio will realize in the future.
Hypothetical
Acadian is providing hypothetical performance information for your review as we believe you have access to resources to independently analyze this information and have the financial expertise to understand the risks and limitations of the presentation of hypothetical performance. Please immediately advise if that is not the case.
Hypothetical performance results have many inherent limitations, some of which are described below. No representation is being made that any account will or is likely to achieve profits or losses similar to those shown. In fact, there are frequently sharp differences between hypothetical performance results and the actual performance results subsequently achieved by any particular trading program.
One of the limitations of hypothetical performance results is that they are generally prepared with the benefit of hindsight. In addition, hypothetical trading does not involve financial risk, and no hypothetical trading record can completely account for the impact of financial risk in actual trading. For example, the ability to withstand losses or to adhere to a particular trading program in spite of trading losses are material points which can also adversely affect actual trading results. There are numerous other factors related to the markets in general or to the implementation of any specific trading program which cannot be fully accounted for in the preparation of hypothetical performance results and all of which can adversely affect actual trading results.
Legal Disclaimer
These materials provided herein may contain material, non-public information within the meaning of the United States Federal Securities Laws with respect to Acadian Asset Management LLC, Acadian Asset Management Inc. and/or their respective subsidiaries and affiliated entities. The recipient of these materials agrees that it will not use any confidential information that may be contained herein to execute or recommend transactions in securities. The recipient further acknowledges that it is aware that United States Federal and State securities laws prohibit any person or entity who has material, non-public information about a publicly-traded company from purchasing or selling securities of such company, or from communicating such information to any other person or entity under circumstances in which it is reasonably foreseeable that such person or entity is likely to sell or purchase such securities.
Acadian provides this material as a general overview of the firm, our processes and our investment capabilities. It has been provided for informational purposes only. It does not constitute or form part of any offer to issue or sell, or any solicitation of any offer to subscribe or to purchase, shares, units or other interests in investments that may be referred to herein and must not be construed as investment or financial product advice. Acadian has not considered any reader's financial situation, objective or needs in providing the relevant information.
The value of investments may fall as well as rise and you may not get back your original investment. Past performance is not necessarily a guide to future performance or returns. Acadian has taken all reasonable care to ensure that the information contained in this material is accurate at the time of its distribution, no representation or warranty, express or implied, is made as to the accuracy, reliability or completeness of such information.
This material contains privileged and confidential information and is intended only for the recipient/s. Any distribution, reproduction or other use of this presentation by recipients is strictly prohibited. If you are not the intended recipient and this presentation has been sent or passed on to you in error, please contact us immediately. Confidentiality and privilege are not lost by this presentation having been sent or passed on to you in error.
Acadian’s quantitative investment process is supported by extensive proprietary computer code. Acadian’s researchers, software developers, and IT teams follow a structured design, development, testing, change control, and review processes during the development of its systems and the implementation within our investment process. These controls and their effectiveness are subject to regular internal reviews, at least annual independent review by our SOC1 auditor. However, despite these extensive controls it is possible that errors may occur in coding and within the investment process, as is the case with any complex software or data-driven model, and no guarantee or warranty can be provided that any quantitative investment model is completely free of errors. Any such errors could have a negative impact on investment results. We have in place control systems and processes which are intended to identify in a timely manner any such errors which would have a material impact on the investment process.
Acadian Asset Management LLC has wholly owned affiliates located in London, Singapore, and Sydney. Pursuant to the terms of service level agreements with each affiliate, employees of Acadian Asset Management LLC may provide certain services on behalf of each affiliate and employees of each affiliate may provide certain administrative services, including marketing and client service, on behalf of Acadian Asset Management LLC.
Acadian Asset Management LLC is registered as an investment adviser with the U.S. Securities and Exchange Commission. Registration of an investment adviser does not imply any level of skill or training.
Acadian Asset Management (Singapore) Pte Ltd, (Registration Number: 199902125D) is licensed by the Monetary Authority of Singapore. It is also registered as an investment adviser with the U.S. Securities and Exchange Commission.
Acadian Asset Management (Australia) Limited (ABN 41 114 200 127) is the holder of Australian financial services license number 291872 ("AFSL"). It is also registered as an investment adviser with the U.S. Securities and Exchange Commission. Under the terms of its AFSL, Acadian Asset Management (Australia) Limited is limited to providing the financial services under its license to wholesale clients only. This marketing material is not to be provided to retail clients.
Acadian Asset Management (UK) Limited is authorized and regulated by the Financial Conduct Authority ('the FCA') and is a limited liability company incorporated in England and Wales with company number 05644066. Acadian Asset Management (UK) Limited will only make this material available to Professional Clients and Eligible Counterparties as defined by the FCA under the Markets in Financial Instruments Directive, or to Qualified Investors in Switzerland as defined in the Collective Investment Schemes Act, as applicable.