
China A-Shares: The More Things Change, the Stronger the Case for Active
Key Takeaways
- The case for active investing in China A-shares remains compelling, even as the market has expanded and matured.
- Investors who allocate to China via standard emerging market benchmarks are substantially underweight the country. This reflects the fact that those indexes capture a small—and increasingly distorted—share of the investable A-shares universe.
- A-shares remain an attractive market for systematic stock selection, given their combination of persistent inefficiency, liquidity, and expanding breadth. By contrast, narrow discretionary strategies have struggled in recent years as speculative trades reversed.
Table of contents
China’s onshore equity market has evolved meaningfully over the past decade. The number of listed companies has grown steadily, access for foreign investors has improved, and trading infrastructure has modernized. Yet several features still distinguish it from other major equity markets. Benchmark providers apply restrictive inclusion rules and capitalization haircuts, retail investors account for a large share of trading activity, and analyst coverage is thin across much of the listed universe.
These features reinforce the case for active investing in China A-shares for two reasons. First, passive allocations based on standard emerging market (EM) and global benchmarks leave investors underexposed to one of the world’s largest equity markets. Second, the combination of inefficiency and liquidity creates a fertile environment for stock selection.
That said, not all active approaches are equally well suited to exploit this opportunity set. Growth-oriented discretionary strategies that once thrived amid speculative froth have struggled in recent years as fundamentals and sentiment turned. We believe that systematic approaches offer the breadth and balance to generate stable outperformance—but they require sophistication and adaptation to the A-share market’s unique features.
EM Benchmarks: Still Underweight China
China’s investable onshore universe is a diverse set of over 5,000 companies, representing roughly $5.5 trillion in float-adjusted capitalization.1 By number of listings, it is the largest investable equity universe in the world; by capitalization, it ranks second. The market has continued to grow and modernize, supported by regulatory reforms.
These reforms included the launch of the STAR market, which piloted a registration-based listing framework that has been adopted across other domestic exchanges.2 The changes have shifted regulatory focus in the IPO process from assessing investment merits to enforcing disclosure compliance, provided mechanisms for more firms to list, and made new-issue pricing and trading more market-driven.
Investors who allocate to China based on EM or global benchmark weights are materially underweight the vast onshore market—and by extension, China’s public equities as a whole. On a pure investable-cap basis, China accounts for roughly 50% of EM’s public equities, which coincides with the country’s GDP share.3 Yet standard EM equity benchmarks assign the country only about a 25% index weight.
This gap exists because only a small portion of A-share investable capitalization—about $400 billion, or roughly 7% of the investable total—is reflected in the index (Figure 1).
Figure 1: China’s Onshore Equity Universe
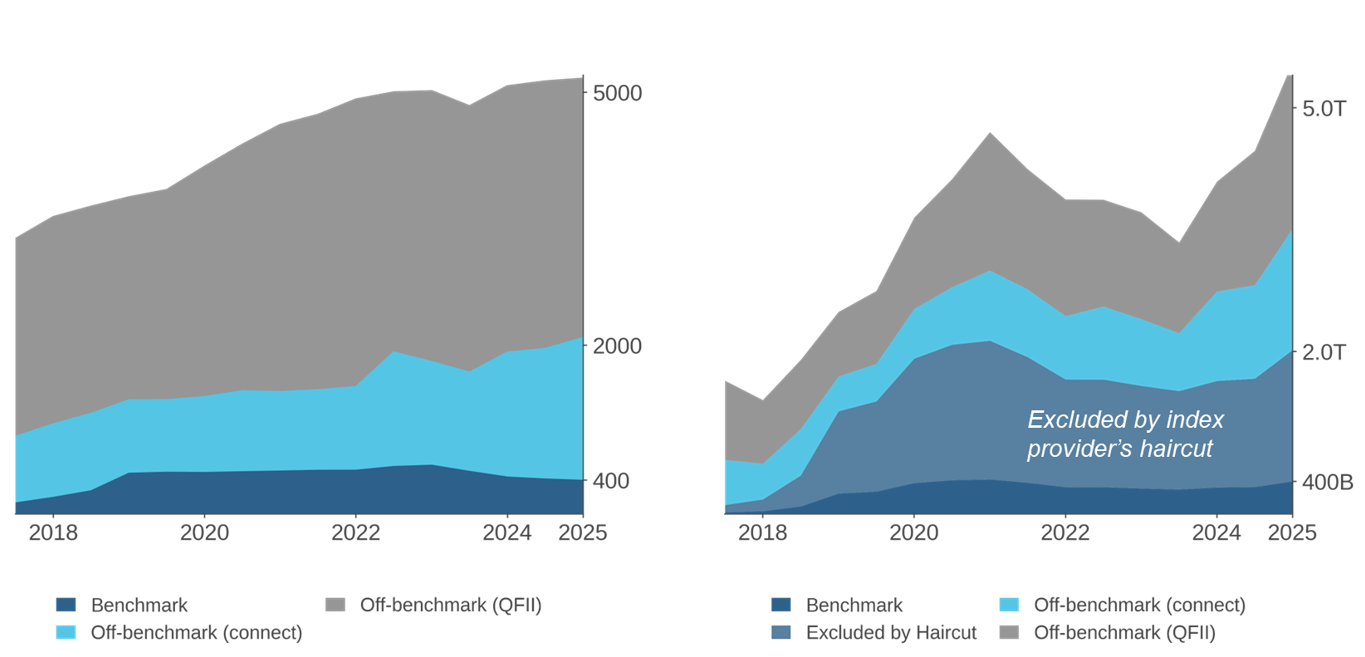
This gap results from how index providers treat A-shares and the contours of the onshore listed market itself. First, major index providers, including MSCI, FTSE Russell, and S&P Dow Jones, still maintain significant inclusion constraints and capitalization haircuts of roughly 75% to 80%. In the absence of MSCI’s 80% haircut, investable A-shares’ implied weight would exceed 33%.
The index restrictions reflect the providers’ subjective judgments about investability and accessibility (and, in some cases, geopolitical risk). Yet there has been material improvement in aspects of market accessibility that index providers highlighted in inclusion reviews from 2017–2019. Investment quotas have been eliminated, foreign exchange and remittance rules have become more flexible, and the expansion of the Stock Connect program reduced reliance on more onerous license-based access.4
Even absent the inclusion constraints, A-shares would still be less fully represented than many other EM markets because China’s onshore equity universe is unusually tilted toward smaller-cap stocks. In Figure 1, the thousands of off-benchmark names accessible through Stock Connect and QFII licenses have average investable capitalizations of $1 billion and $640 million, respectively.
As a result, while conventional EM mid- and large-cap benchmarks typically capture roughly 85% to 90% of constituent countries’ investable capitalization, the comparable number for China A is closer to 41%. Figure 1 also documents that this differential has grown in the 2020s. Figure 1 shows that recent issuance has been concentrated in off-benchmark names.
There are two practical consequences. First, an allocator with a benchmark allocation to EM would find their China exposure concentrated in a narrow slice of the country’s investable equities, one emphasizing large offshore listings while leaving much of the domestic universe unrepresented. While some investors’ views on China may happen to align with this impact of the index providers’ judgments, allocators should not assume that alignment.5 In particular, for those anchoring exposures to economic production, unwinding benchmark inclusion and weighting constraints on A-shares can bring China exposure back in line with the country’s global economic footprint.6 More broadly, we would recommend openness to modulating exposure to onshore China through dedicated A-share allocations alongside EM or EM ex-China mandates.
Second, the small-cap orientation of the A-share market has distinct investing value. Its small firms tend to be domestically oriented, making full A-share market exposure a useful diversifier in a global portfolio. China’s onshore market also offers a particularly attractive environment for stock selection.
Stock Selection in China A-Shares
Several features of China’s onshore equity market contribute to this compelling opportunity set.
First, retail investors account for an uncommonly large share of A-share trading volume, roughly 60%. Although this share has declined somewhat, Figure 2 shows that it remains far above levels in most developed markets, where retail activity typically accounts for less than one-third of turnover. It is also higher than in other major EMs, including Korea, Taiwan, and India. This matters because retail trading tends to create and amplify inefficiencies, supporting stock selection opportunities. In China’s onshore market, for example, sell-side research confirms that retail participation is often associated with short-term overreaction to news and subsequent reversals.7
Figure 2: Retail Participation across Major Global Markets
Fraction of total turnover

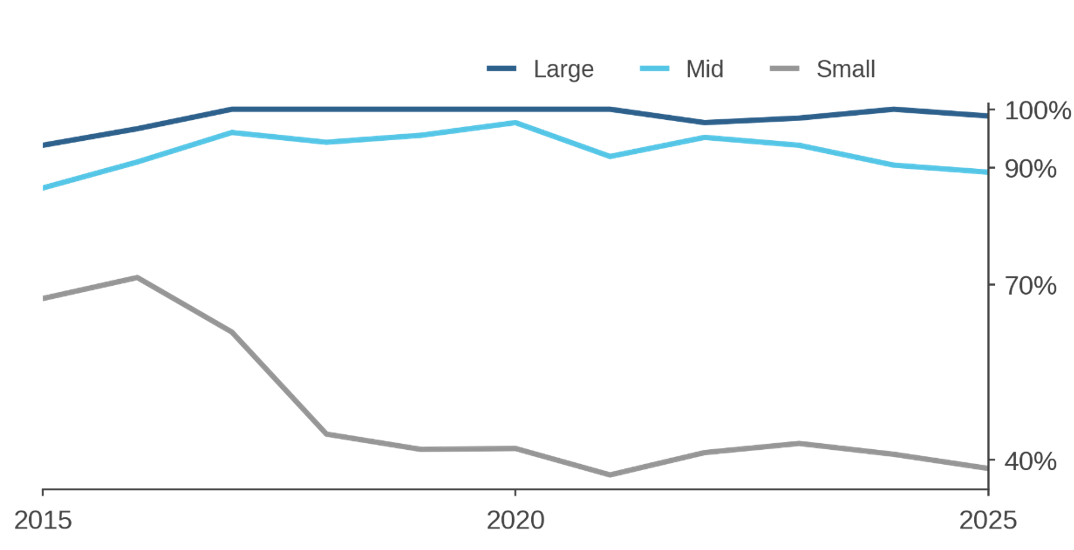
A second source of inefficiency is thin analyst coverage, particularly outside the large-cap segment. Figure 3 shows that analyst coverage among small-cap A-shares roughly halved between 2016 and 2018, and it has hovered around 40% since.8 Our research also highlights an interesting pattern in where analysts focus: In order to pick up coverage on new issues, they tend to drop more-seasoned firms.
Figure 3: Analyst Coverage in Onshore Equities
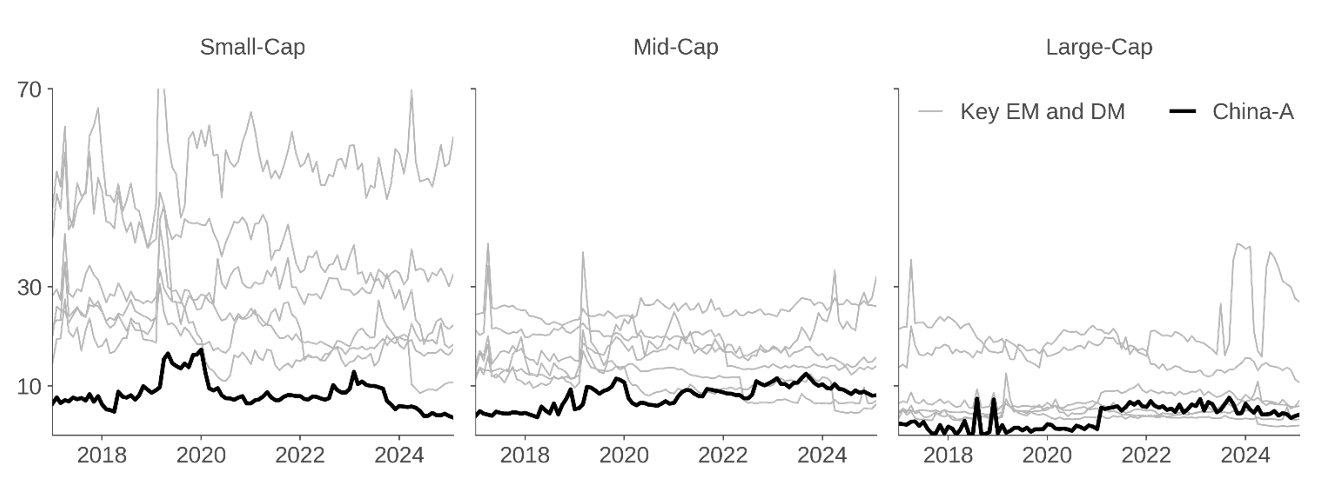
While the A-share market is relatively inefficient, it is also highly liquid despite its small-cap orientation. A-share stocks below the $1 billion threshold are three to six times more actively traded than similarly sized firms in other markets.9 Small-cap A-shares also have lower trading costs. Figure 4 shows that their bid-ask spreads are consistently tighter than for comparably sized stocks in other major developed and emerging markets; their spreads more closely resemble those of global mid- and large-cap stocks.
Figure 4: Median Bid-Ask Spreads in China-A Shares
September 2017 – February 2026
Together, these features create a rare combination for active investors: persistent inefficiency alongside enough liquidity to harvest stock-selection alpha at scale. Moreover, the limited analyst coverage does not imply limited information. For investors who are equipped to make use of it, there is plenty of data available outside of traditional research channels.
Better Outcomes from Breadth and Balance
Between 2017 and 2020, discretionary growth strategies in China A-shares delivered exceptional benchmark-relative returns. As Figure 5 shows, the median manager in this cohort generated approximately 11% annualized excess return, effectively doubling benchmark performance. But that regime turned in 2021. Over the subsequent five years, the median manager in the same group produced annualized excess returns of about -3%.
Figure 5: Active Manager Performance – Excess Returns
Distribution of annualized excess returns net of dividends

What changed? Our analysis suggests that many of these portfolios were unbalanced in several respects. They were concentrated—holding only 40 to 50 companies, tilted toward large- and mega-cap stocks, and were overweight real estate-linked financials and related industries. These portfolios initially benefited from performance chasing that propelled a narrow frothy trade, but they became vulnerable as stress emerged in the real estate sector and regulators cracked down.
By contrast, high-breadth systematic strategies have delivered more stable outcomes. As Figure 5 shows, the median systematic manager generated positive excess returns during both periods.
In our view, this contrast in performance is not accidental. Scalable systematic forecasting, portfolio construction, and implementation methods are especially well suited to a market as broad, inefficient, and liquid as China A-shares. For investors with the right processes, these conditions are conducive to stable generation of stock-specific alpha from diverse sources rather than relying on narrow thematic exposures.
For traditional discretionary managers, however, leveraging the expansive opportunity set poses steep challenges: How to cover the full market and manage a portfolio with sufficient breadth to fully leverage the opportunity set? Lack of process scalability helps to explain why discretionary A-share managers tend to pursue stock selection based on narrow drivers.
But even for systematic managers, the unique features of the A-share market call for special process adaptations. These include investment analysis of diverse alternative information sources, including company and exchange releases, news flow, social media posts, and management discussions, all in the local language. The peculiar market structure also implies that some predictive signals function differently in A-shares than elsewhere, such as the relationship between trading volume and future prices. Such differences in signal behavior favor systematic approaches with forecasting models that are flexible enough to capture market-specific nuance.
Finally, improvements in trading infrastructure call for ongoing refinement of execution to maximize returns. Progressive market structure reforms, including tighter controls on trading suspensions, improved trading continuity, and more efficient post-trade processing, have created a more predictable and institutionally mature execution environment.10 Such changes have facilitated broader adoption of algorithmic execution, raising the potential for improved outcomes for managers who incorporate thoughtful portfolio construction and implementation.
Conclusion
China’s onshore equity market has evolved, but not in ways that diminish the case for active investing—if anything, the case has strengthened. Among active strategies, this market’s breadth, composition, and information environment favor high-breadth, scalable, and sophisticated systematic investing approaches. The market offers such managers an uncommon opportunity to deliver meaningful and stable benchmark-relative outperformance.
Endnotes
- We base the definition of investability here on float-adjusted market cap and volume thresholds. We also unwind index providers’ inclusion haircuts on market capitalization.
- China’s STAR Market, formally the Science and Technology Innovation Board of the Shanghai Stock Exchange, is a Nasdaq-style equities market focused on high-growth technology firms.
- China represents approximately 48% of EM GDP based on data from the IMF World Economic Outlook (April 2026) and World Bank national accounts data.
- Expansion of Stock Connect eligibility (HKEX, 2023); Unified QFII/RQFII regime (CSRC, 2020); Simplification of remittance and foreign-exchange procedures (SAFE, 2020); Removal of QFII/RQFII quota limits (SAFE, September 2019).
- Please see Polarizing Views: China’s Impact on EM Investing, Acadian 2021, for further discussion about how governance considerations might shape investors’ approaches to investing in China.
- As of March 2026, China’s weight in the MSCI EM IMI Index would rise to approximately 47% after unwinding the capitalization haircut and expanding coverage to the full onshore opportunity set.
- Source: UBS Quant Research. Please see Additional Disclosure 1 at the end of this document for specific references to research.
- Independent sell-side estimates show that low analyst coverage holds true for both domestic and international analysts. Please contact us for details.
- Based on the ratio of average daily volume to market cap
- Synapse Settlement Acceleration Platform Launch (HKEX, 2023); Stock Connect Trading Calendar Enhancement (HKEX, 2023); Guidelines for the Suspension and Resumption of Trading of Listed Companies (Shanghai/Shenzhen, 2016.
Legal Disclaimer
These materials provided herein may contain material, non-public information within the meaning of the United States Federal Securities Laws with respect to Acadian Asset Management LLC, Acadian Asset Management Inc. and/or their respective subsidiaries and affiliated entities. The recipient of these materials agrees that it will not use any confidential information that may be contained herein to execute or recommend transactions in securities. The recipient further acknowledges that it is aware that United States Federal and State securities laws prohibit any person or entity who has material, non-public information about a publicly-traded company from purchasing or selling securities of such company, or from communicating such information to any other person or entity under circumstances in which it is reasonably foreseeable that such person or entity is likely to sell or purchase such securities.
Acadian provides this material as a general overview of the firm, our processes and our investment capabilities. It has been provided for informational purposes only. It does not constitute or form part of any offer to issue or sell, or any solicitation of any offer to subscribe or to purchase, shares, units or other interests in investments that may be referred to herein and must not be construed as investment or financial product advice. Acadian has not considered any reader's financial situation, objective or needs in providing the relevant information.
The value of investments may fall as well as rise and you may not get back your original investment. Past performance is not necessarily a guide to future performance or returns. Acadian has taken all reasonable care to ensure that the information contained in this material is accurate at the time of its distribution, no representation or warranty, express or implied, is made as to the accuracy, reliability or completeness of such information.
This material contains privileged and confidential information and is intended only for the recipient/s. Any distribution, reproduction or other use of this presentation by recipients is strictly prohibited. If you are not the intended recipient and this presentation has been sent or passed on to you in error, please contact us immediately. Confidentiality and privilege are not lost by this presentation having been sent or passed on to you in error.
Acadian’s quantitative investment process is supported by extensive proprietary computer code. Acadian’s researchers, software developers, and IT teams follow a structured design, development, testing, change control, and review processes during the development of its systems and the implementation within our investment process. These controls and their effectiveness are subject to regular internal reviews, at least annual independent review by our SOC1 auditor. However, despite these extensive controls it is possible that errors may occur in coding and within the investment process, as is the case with any complex software or data-driven model, and no guarantee or warranty can be provided that any quantitative investment model is completely free of errors. Any such errors could have a negative impact on investment results. We have in place control systems and processes which are intended to identify in a timely manner any such errors which would have a material impact on the investment process.
Acadian Asset Management LLC has wholly owned affiliates located in London, Singapore, and Sydney. Pursuant to the terms of service level agreements with each affiliate, employees of Acadian Asset Management LLC may provide certain services on behalf of each affiliate and employees of each affiliate may provide certain administrative services, including marketing and client service, on behalf of Acadian Asset Management LLC.
Acadian Asset Management LLC is registered as an investment adviser with the U.S. Securities and Exchange Commission. Registration of an investment adviser does not imply any level of skill or training.
Acadian Asset Management (Singapore) Pte Ltd, (Registration Number: 199902125D) is licensed by the Monetary Authority of Singapore. It is also registered as an investment adviser with the U.S. Securities and Exchange Commission.
Acadian Asset Management (Australia) Limited (ABN 41 114 200 127) is the holder of Australian financial services license number 291872 ("AFSL"). It is also registered as an investment adviser with the U.S. Securities and Exchange Commission. Under the terms of its AFSL, Acadian Asset Management (Australia) Limited is limited to providing the financial services under its license to wholesale clients only. This marketing material is not to be provided to retail clients.
Acadian Asset Management (UK) Limited is authorized and regulated by the Financial Conduct Authority ('the FCA') and is a limited liability company incorporated in England and Wales with company number 05644066. Acadian Asset Management (UK) Limited will only make this material available to Professional Clients and Eligible Counterparties as defined by the FCA under the Markets in Financial Instruments Directive, or to Qualified Investors in Switzerland as defined in the Collective Investment Schemes Act, as applicable.
Additional Disclosure 1
UBS AG or its affiliate which published the UBS Material ("UBS") grants [Acadian Asset Management Inc] ("Client") a royalty free, non-exclusive and non-transferable license to use the extract of the research report set out below (the "UBS Material") [to host on external paper on the company website] (the “Purpose”). Client acknowledges ownership by UBS of all intellectual property and proprietary rights in the UBS Material, whether registered or unregistered, legal or beneficial. Client also agrees to display the following copyright notice indicating that UBS is the owner of the copyright in the UBS Material, "Source: [What you need to know about quant investing in China, Risk and alpha: Investor positioning in China amid volatility] © UBS 2026. All rights reserved. Reproduced with permission. May not be forwarded or otherwise distributed." UBS EXPRESSLY EXCLUDES ANY AND ALL WARRANTIES OF ANY KIND WITH RESPECT TO THE UBS MATERIAL. THE UBS MATERIAL IS LICENSED "AS IS" AND "AS AVAILABLE" WITHOUT REPRESENTATIONS OR WARRANTIES OF ANY KIND (INCLUDING, WITHOUT LIMITATION, IMPLIED WARRANTIES OF TITLE, ACCURACY OR FITNESS FOR A PARTICULAR PURPOSE) AND CLIENT ASSUMES THE ENTIRE AND SOLE RISK OF ITS USE AND RELIANCE THEREON. CLIENT WILL HOLD UBS HARMLESS ON DEMAND FROM ANY ACTUAL OR THREATENED LIABILITY WHICH MAY ARISE FROM CLIENT'S USE OF THE UBS MATERIAL. Client is not permitted to assign, sublicense, transfer or otherwise dispose of all or any of its rights or obligations under this email. Use of the UBS Material will constitute acceptance of the terms of this email. The disclaimer and other terms applicable to the UBS Material as set out therein continue to apply save as varied by this email solely in order to fulfil the Purpose.
Additional Disclosure 2
Every investment program has an opportunity for loss as well as profit. Benchmarks are individual to each manager based on the benchmarks reported to eVestment. Past performance is no guarantee of future returns. eVestment Alliance, LLC and its affiliated entities (collectively, “eVestment”) collect information directly from investment management firms and other sources believed to be reliable, however, eVestment does not guarantee or warrant the accuracy, timeliness, or completeness of the information provided and is not responsible for any errors or omissions. Performance results may be provided with additional disclosures available on eVestment’s systems and other important considerations such as fees that may be applicable. Not for general distribution and limited distribution may only be made pursuant to client’s agreement terms. All managers in an eVestment category are not necessarily included. Copyright 2012-2026 eVestment Alliance, LLC. For illustrative purposes only. All Rights Reserved.