The information provided on our website is not intended for distribution to, or use by, any person or entity in any jurisdiction or country where such distribution or use would be contrary to law or regulation, or which would subject Acadian, its wholly owned affiliates or any of its products to any registration requirement within such jurisdiction or country. Acadian assumes no responsibility for access to this website by any person located within a country or jurisdiction where such access would be contrary to any law or regulation in that country.
Our website and its contents are for informational purposes only and does not constitute an offer to sell or a solicitation of an offer to buy any security that may be referenced on or through our website. Further, our website and its contents does not constitute an offering or recommendation by Acadian or its wholly owned affiliates of any transaction, product or service, including securities transactions and investment management or advisory services. Acadian does not provide investment advice, tax advice, or legal advice through this website, and you agree that this website will not be used by you for such purposes.
The content of this website is not intended for the use of retail investors. By your use of this website you confirm to Acadian that you are both an “Accredited Investor” as defined under Regulation D of the U.S. Securities Act and a “Qualified Purchaser” within the meaning of the U.S. Investment Company Act of 1940, or an institutional investor, or a Professional Client and Eligible Counterparty as defined by the FCA under the Markets in Financial Instruments Directive.
I ACKNOWLEDGE THAT I HAVE READ AND UNDERSTAND THIS AGREEMENT AND MEET THE CONDITIONS OUTLINED ABOVE.
As of November 2026, U.S. corporations are selling equity. Prior to 2026, they were repurchasing equity on net, but today they are issuing equity on net. I call issuance the Third Horseman of the Bubble Apocalypse, and this horseman has now galloped onto the scene with $2.4T in net equity issuance over the past 12 months.
Firms are the smart money: they repurchase shares when their stock is undervalued and issue shares when it’s overvalued. Buy low, sell high. Everyone tries to do it; firms actually succeed on average. That makes net issuance a valuable signal for both individual stocks and the market as a whole.
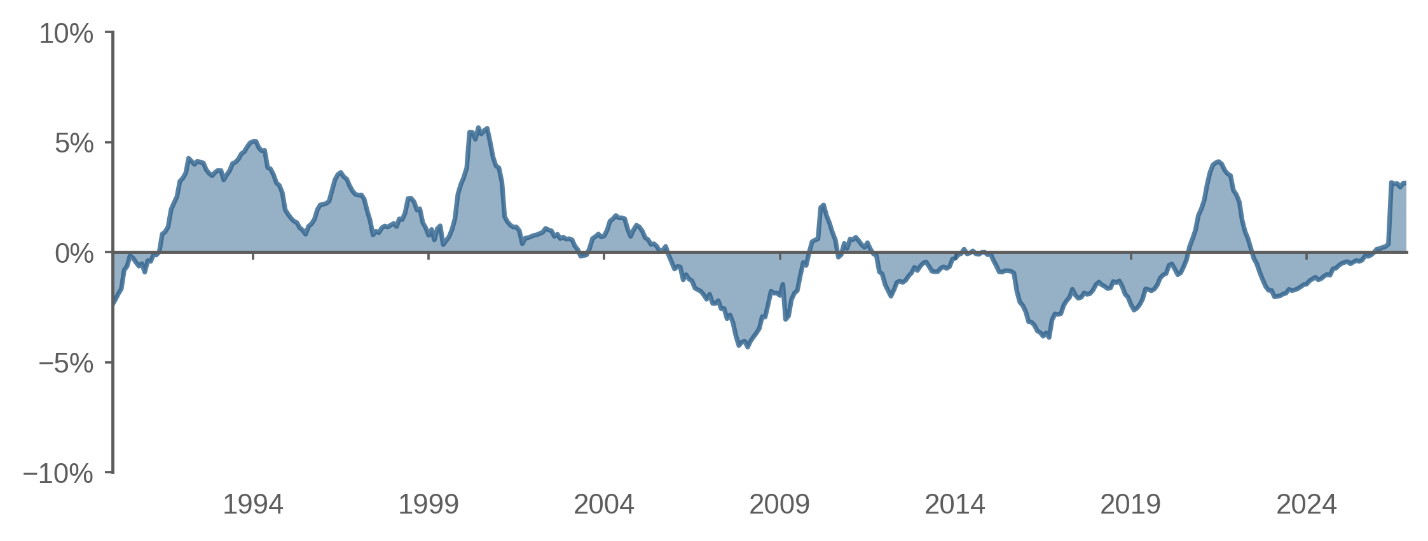
Figure 1 shows trailing 12-month net issuance for the entire U.S. stock market, expressed as a percentage of market cap.[1] As of November 12, 2026, net issuance is significantly positive at 3.1% of total market cap. While net issuance is still below the peaks reached during the tech bubble of 1999–2000 and the COVID bubble of 2021, it is clear that the era of repurchases has ended and an era of issuance has begun. Figure 1 does not include the impact of the scheduled Anthropic IPO; if that IPO proceeds as expected, the line in Figure 1 will rise above its 2021 peak.[2]
Figure 1: 12-Month net issuance as a percent of market cap
January 1990 to November 2026
Source: Acadian based on data from Bloomberg and CRSP Research Data Products from Morningstar. For illustrative purposes only.
Table 1: Net issuance over trailing 12 months, USD billions
Nov 2024
Nov 2025
Nov 2026
All U.S. common stock
−397
−69
2,398
SpaceX only
0
0
2,206
All U.S. excluding SpaceX
−397
−69
192
Magnificent Seven only
−144
−57
276
Source: Acadian based on data from Bloomberg and CRSP Research Data Products from Morningstar. For illustrative purposes only. November 2026 data is as of November 12, 2026.
The increase in net issuance is largely, but not entirely, driven by the SpaceX IPO of June 2026. Table 1 shows net issuance with and without SpaceX. In the 12 months ending in November 2024, firms repurchased $397B of equity on net. In the subsequent 12 months, they were still net repurchasers, albeit on a smaller scale. But that’s all changed. Even excluding SpaceX (both its IPO and its post-IPO issuance), U.S. corporations have issued $192B in net equity over the past 12 months.
We can also look at the much-discussed Magnificent Seven. Table 1 shows that the increase in net issuance outside of SpaceX can be traced to these firms. In the 12 months ending in November 2024, the Magnificent Seven collectively repurchased $144B of equity on net. But over the past 12 months, they’ve instead issued $276B of equity on net, with Alphabet and Meta flipping from repurchasing to issuing, and Tesla greatly increasing its issuance.
The many faces of issuance
Issuance is complicated for two reasons. First, firms issue equity for many reasons, only one of which is their desire to buy low and sell high. Second, issuance takes many different forms, so different ways of measuring it can produce different results. I define issuance as any corporate action that changes the number of (split-adjusted) shares outstanding, and I measure net issuance using the following simple formula, which applies to both individual stocks and the market as a whole:[3]
At the market level, Equation (1) provides a comprehensive measure of all forms of issuance. Share repurchases and firms going private result in negative net issuance, while secondary offerings and IPOs result in positive net issuance. In recent months, existing firms have reduced repurchases and increased various forms of issuance, including shares issued as executive compensation (Tesla’s issuance of shares to Elon Musk), stock-financed takeovers (SpaceX’s takeover of Cursor), and secondary offerings (Intel).[4]
Equation (1) counts an IPO as issuance equal to the firm’s initial market cap. For example, the SpaceX IPO of June 12, 2026, contributes $2.1T in net equity issuance to Figure 1 and Table 1. That’s the market cap reported by Bloomberg, based on the closing price and shares outstanding across the different share classes on the IPO date. But you could argue that Equation (1) should use float-adjusted market cap instead.
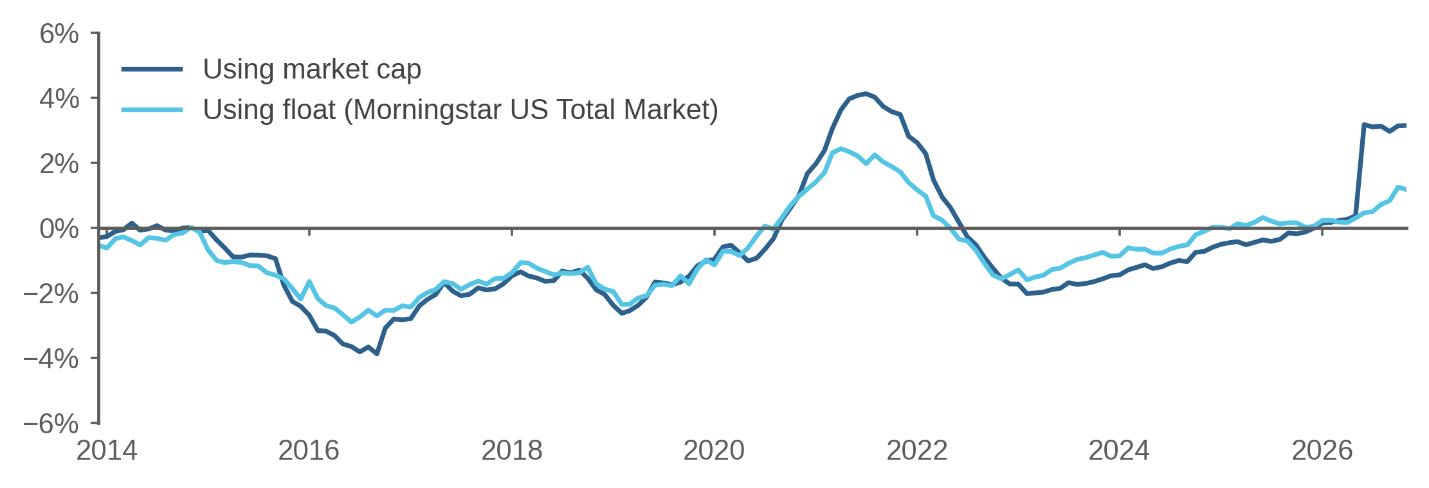
The Morningstar US Total Market Index measures the float-adjusted market cap of the U.S. stock market. Figure 2 compares net issuance calculated using the Morningstar index with Figure 1’s net issuance based on market cap. Because the Morningstar index measures the SpaceX IPO based on its initial float, it shows a smaller swing toward net issuance in 2026. Even so, both measures show net issuance turning decidedly positive in recent months.
Figure 2: Net issuance using market cap vs. float
January 2014 to November 2026
Source: Acadian based on data from Bloomberg and CRSP Research Data Products from Morningstar. For illustrative purposes only.
I never Meta capital expenditure I didn’t like
To understand the sea change in net issuance, consider Meta. In 2021, Mark Zuckerberg renamed Facebook’s parent company Meta and embarked on a spending campaign to develop the metaverse. The spending was widely criticized at the time,[5] and the huge metaverse investment is now seen by many as “a well-documented blunder.”[6]
Today, Meta is once again spending heavily, this time on AI. Whether today’s AI spending will turn out to be another Zuckerblunder, I don’t know. But I do know that Meta’s issuance behavior has changed dramatically. Throughout its quixotic metaverse spending spree, Meta continued to repurchase equity. That changed by mid-2026, when Meta switched from repurchasing equity on net to issuing equity on net. And last month, Meta announced plans to raise additional equity, up to $98B, to fund its AI capital expenditures.
Why the change? One theory is that Zuckerberg previously viewed Meta shares as undervalued but now sees them as overvalued. Another theory is that Meta’s issuance is not motivated by valuation but rather by the need to fund its AI buildout. According to this view, Meta has already spent its available internal funds and exhausted its borrowing capacity, leaving it little choice but to issue equity.
Debt vs. equity
Another way to measure the recent change in corporate behavior is through the equity share of Baker and Wurgler (2000). They define the equity share as gross equity issuance divided by the sum of gross equity issuance and corporate bond issuance, using data from the Fed. For the SpaceX IPO, this approach measures issuance using the dollars raised rather than SpaceX’s total or float-adjusted market cap.
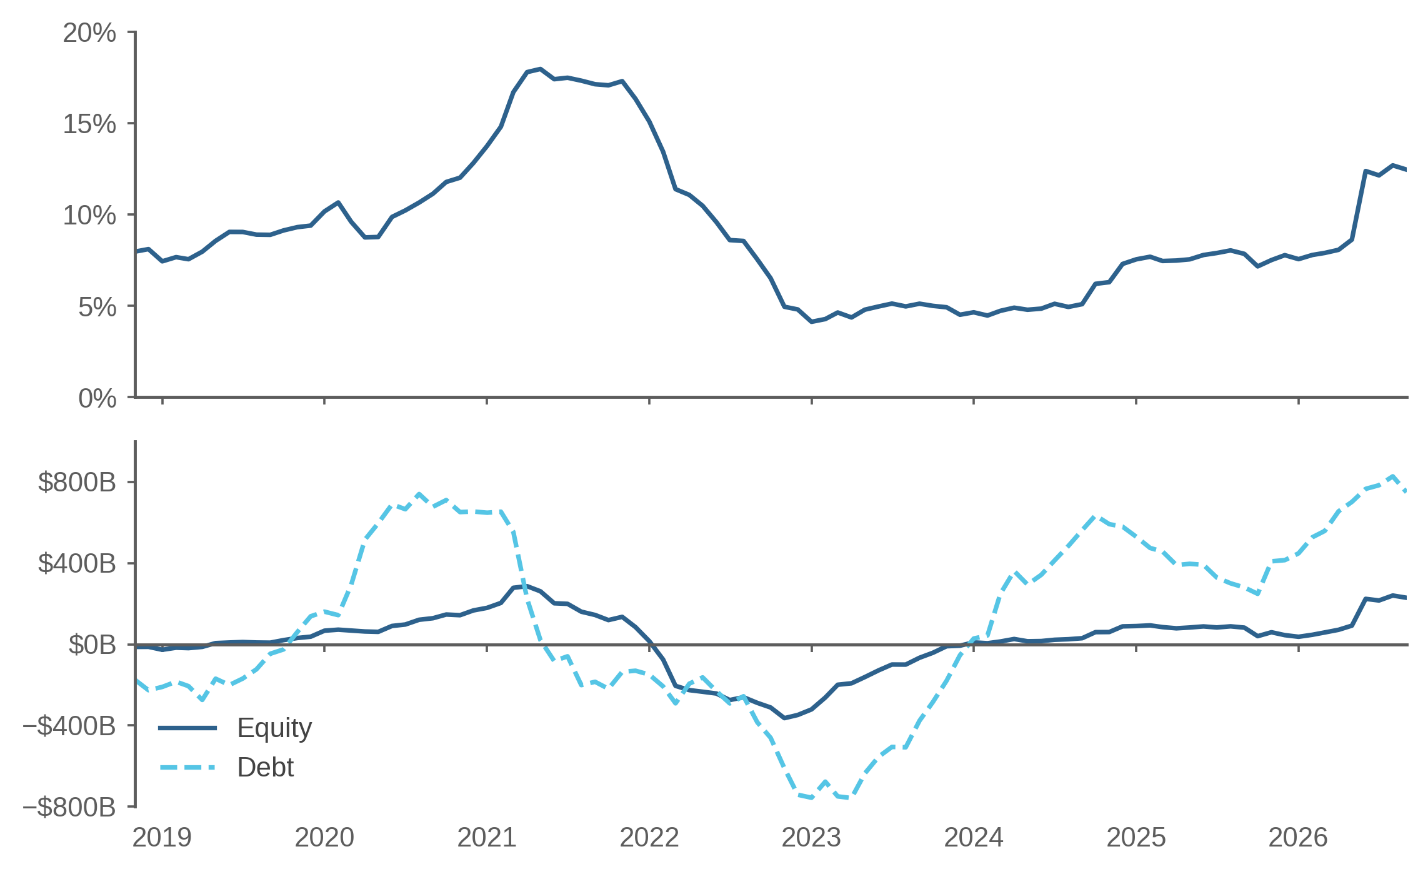
The Baker-Wurgler equity share is shown in the top panel of Figure 3. It peaked at around 18% during the COVID bubble of 2021. Like the issuance measures in Figures 1 and 2, it has risen substantially in recent months, though it remains below its 2021 peak.
Baker and Wurgler (2000) say that:
… firms issue relatively more equity than debt just before periods of low market returns … firms time the market component of their returns when issuing securities.
The COVID bubble provides striking out-of-sample evidence for the equity share’s predictive power: the measure peaked in 2021, and the stock market fell thereafter.
Figure 3: Equity share (top) and changes in issuance (bottom)
November 2018 to September 2026
Source: Acadian based on data from the Federal Reserve Board. For illustrative purposes only. The top panel shows E/(E+D) and the bottom panel shows 12-month changes in E and D, where E is the trailing 12-month sum of gross stock issues and D is the trailing 12-month sum of gross corporate debt issues from FRB Table 1.46.
The bottom panel of Figure 3 shows 12-month changes in the two components of the equity share. During the COVID bubble, debt issuance rose first (in 2020), followed by equity issuance (in 2021). We’ve seen a similar pattern recently, with a sharp increase in debt issuance beginning in 2024 followed by a surge in equity issuance in 2026.
Why is the smart money selling?
I hope I have convinced you that the smart money is selling equity today. No matter how you measure it, U.S. corporations have changed their behavior over the past two years, switching from repurchasing in 2024 to issuing today.
The question you should be asking is: why is the smart money selling? There are two explanations. First, the smart money is selling because the market is overpriced. In that case, you don’t want to be the dumb money, buying what the smart money is selling. Second, firms are selling because they need to fund the AI buildout. In that case, buying today need not be a mistake. Perhaps the truth lies somewhere in between these two explanations.
What is clear is that prior to 2026, firms were repurchasing equity on net, consistent with the idea that they viewed their shares as undervalued. Today, for whatever reason, firms are issuing equity on net.
Since March 2024, I’ve written about equity issuance repeatedly, arguing on at least eight occasions that the U.S. stock market was not in a bubble because firms were not issuing equity.[7] As recently as January 2026, I titled an article “We are not in an AI bubble.” Today, I would no longer write those words.
Endnotes
[1] The U.S. stock market is defined as the common stock of all firms incorporated in the U.S. and includes REITs and SPACs but excludes other investment trusts such as ETFs and closed-end funds. This investment universe is slightly broader than the one I’ve previously used, for example in “We are not in an AI bubble.”
[2] References to this and other companies should not be interpreted as recommendations to buy or sell specific securities. Acadian and/or the author of this post may hold positions in one or more securities associated with these companies.
[4] As the SpaceX float unlocks, we’d expect the two lines in Figure 2 to converge. The Morningstar index also excludes SPACs, which explains much of the divergence between the two lines in 2021.
These materials provided herein may contain material, non-public information within the meaning of the United States Federal Securities Laws with respect to Acadian Asset Management LLC, Acadian Asset Management Inc. and/or their respective subsidiaries and affiliated entities. The recipient of these materials agrees that it will not use any confidential information that may be contained herein to execute or recommend transactions in securities. The recipient further acknowledges that it is aware that United States Federal and State securities laws prohibit any person or entity who has material, non-public information about a publicly-traded company from purchasing or selling securities of such company, or from communicating such information to any other person or entity under circumstances in which it is reasonably foreseeable that such person or entity is likely to sell or purchase such securities.
Acadian provides this material as a general overview of the firm, our processes and our investment capabilities. It has been provided for informational purposes only. It does not constitute or form part of any offer to issue or sell, or any solicitation of any offer to subscribe or to purchase, shares, units or other interests in investments that may be referred to herein and must not be construed as investment or financial product advice. Acadian has not considered any reader's financial situation, objective or needs in providing the relevant information.
The value of investments may fall as well as rise and you may not get back your original investment. Past performance is not necessarily a guide to future performance or returns. Acadian has taken all reasonable care to ensure that the information contained in this material is accurate at the time of its distribution, no representation or warranty, express or implied, is made as to the accuracy, reliability or completeness of such information.
This material contains privileged and confidential information and is intended only for the recipient/s. Any distribution, reproduction or other use of this presentation by recipients is strictly prohibited. If you are not the intended recipient and this presentation has been sent or passed on to you in error, please contact us immediately. Confidentiality and privilege are not lost by this presentation having been sent or passed on to you in error.
Acadian’s quantitative investment process is supported by extensive proprietary computer code. Acadian’s researchers, software developers, and IT teams follow a structured design, development, testing, change control, and review processes during the development of its systems and the implementation within our investment process. These controls and their effectiveness are subject to regular internal reviews, at least annual independent review by our SOC1 auditor. However, despite these extensive controls it is possible that errors may occur in coding and within the investment process, as is the case with any complex software or data-driven model, and no guarantee or warranty can be provided that any quantitative investment model is completely free of errors. Any such errors could have a negative impact on investment results. We have in place control systems and processes which are intended to identify in a timely manner any such errors which would have a material impact on the investment process.
Acadian Asset Management LLC has wholly owned affiliates located in London, Singapore, and Sydney. Pursuant to the terms of service level agreements with each affiliate, employees of Acadian Asset Management LLC may provide certain services on behalf of each affiliate and employees of each affiliate may provide certain administrative services, including marketing and client service, on behalf of Acadian Asset Management LLC.
Acadian Asset Management LLC is registered as an investment adviser with the U.S. Securities and Exchange Commission. Registration of an investment adviser does not imply any level of skill or training.
Acadian Asset Management (Singapore) Pte Ltd, (Registration Number: 199902125D) is licensed by the Monetary Authority of Singapore. It is also registered as an investment adviser with the U.S. Securities and Exchange Commission.
Acadian Asset Management (Australia) Limited (ABN 41 114 200 127) is the holder of Australian financial services license number 291872 ("AFSL"). It is also registered as an investment adviser with the U.S. Securities and Exchange Commission. Under the terms of its AFSL, Acadian Asset Management (Australia) Limited is limited to providing the financial services under its license to wholesale clients only. This marketing material is not to be provided to retail clients.
Acadian Asset Management (UK) Limited is authorized and regulated by the Financial Conduct Authority ('the FCA') and is a limited liability company incorporated in England and Wales with company number 05644066. Acadian Asset Management (UK) Limited will only make this material available to Professional Clients and Eligible Counterparties as defined by the FCA under the Markets in Financial Instruments Directive, or to Qualified Investors in Switzerland as defined in the Collective Investment Schemes Act, as applicable.
About the Authors
Owen A. Lamont, Ph.D.
Senior Vice President, Portfolio Manager, Research
Owen joined the Acadian investment team in 2023. In addition to more than 20 years of experience in asset management as a researcher and portfolio manager, Owen has been a member of the faculty at Harvard University, Princeton University, The University of Chicago Graduate School of Business, and Yale School of Management. His professional and academic focus is behavioral finance, and he has published papers on short selling, stock returns, and investor behavior in leading academic journals, and he has testified before the U.S. House of Representatives and the U.S. Senate. Owen earned a Ph.D. in economics from the Massachusetts Institute of Technology and a B.A. in economics and government from Oberlin College.