The information provided on our website is not intended for distribution to, or use by, any person or entity in any jurisdiction or country where such distribution or use would be contrary to law or regulation, or which would subject Acadian, its wholly owned affiliates or any of its products to any registration requirement within such jurisdiction or country. Acadian assumes no responsibility for access to this website by any person located within a country or jurisdiction where such access would be contrary to any law or regulation in that country.
Our website and its contents are for informational purposes only and does not constitute an offer to sell or a solicitation of an offer to buy any security that may be referenced on or through our website. Further, our website and its contents does not constitute an offering or recommendation by Acadian or its wholly owned affiliates of any transaction, product or service, including securities transactions and investment management or advisory services. Acadian does not provide investment advice, tax advice, or legal advice through this website, and you agree that this website will not be used by you for such purposes.
The content of this website is not intended for the use of retail investors. By your use of this website you confirm to Acadian that you are both an “Accredited Investor” as defined under Regulation D of the U.S. Securities Act and a “Qualified Purchaser” within the meaning of the U.S. Investment Company Act of 1940, or an institutional investor, or a Professional Client and Eligible Counterparty as defined by the FCA under the Markets in Financial Instruments Directive.
I ACKNOWLEDGE THAT I HAVE READ AND UNDERSTAND THIS AGREEMENT AND MEET THE CONDITIONS OUTLINED ABOVE.
Owenomics
Earnings-Day Volatility Is a Feature, Not a Bug
On October 28th, Alphabet announced earnings.[1] In response, its price fell nearly 13%, wiping approximately half a trillion dollars off its market capitalization. We saw similar price reactions to earnings announcements at the end of July. Should we be alarmed by these colossal moves in market prices? Does it mean we are in an AI frenzy?
No, huge price moves on earnings announcements are not evidence of market irrationality. Perhaps we’re in an AI frenzy, but if so, earnings-related volatility is not a reliable symptom. Stock prices reacting to earnings news is a desirable and rational phenomenon. Alphabet’s price should move when fundamental news is released. You should worry if Alphabet’s price fails to move in response to fundamental news, or if it moves in the absence of fundamental news. I’m not claiming that Alphabet’s giant price move was necessarily rational; I’m claiming that prices moving in response to information is a necessary but not sufficient condition for rationality.
You can’t have an efficient market unless prices move when new information arrives. If you don’t agree, then I must appeal to the highest authority in the land: the U.S. Supreme Court. You might be surprised to learn that the Court has weighed in on the Efficient Market Hypothesis (EMH), declaring that stock prices respond to public information and making the EMH central to securities fraud litigation.
Let me give you some background. Fama, Fisher, Jensen and Roll (1969) developed the event study, a statistical method for studying the reaction of stock prices to news. The basic idea is that in an efficient market, prices should react promptly to new information, a prediction that was largely confirmed in many academic studies since 1969. These results, among others, led Jensen (1978) to say that “I believe there is no other proposition in economics which has more solid empirical evidence supporting it than the Efficient Market Hypothesis.” The Supreme Court apparently agreed, because in 1988 they adopted (in Basic v. Levinson) the EMH as part of the “fraud-on-the-market” doctrine. After 1988, if you wanted to sue a publicly traded firm for securities fraud, you probably needed to hire an expert witness to do an event study. For example, in Enron’s class action securities litigation in 2006, the plaintiffs performed an event study showing that Enron’s stock price reacted to information released by the company.
In 2014, the Halliburton II case presented the Court with the opportunity to reject the EMH and instead embrace behavioral finance. The Court could have decided to go full behavioral, declaring that market prices do not properly reflect fundamental value. The Court instead chose to stick with the EMH. Chief Justice Roberts approvingly described event studies as “regression analyses that seek to show that the market price of the defendant’s stock tends to respond to pertinent publicly reported events.” Justice Thomas disagreed, displaying a fondness for behavioral finance and dismissing the EMH as outdated: “This view of market efficiency has since lost its luster.”
Is Alphabet’s decline of almost 13% obviously too big? No, not in the context of today’s levels of idiosyncratic volatility and dispersion, which remain high in the U.S. stock market, although somewhat lower than the extreme levels earlier this year.
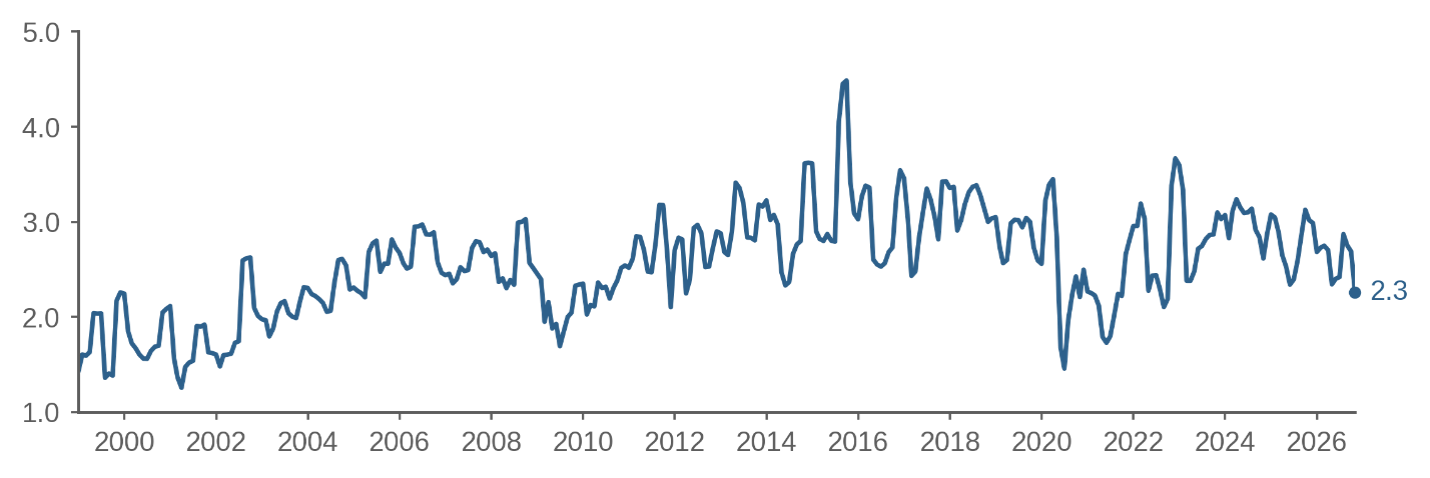
Information arrives every day, not just on earnings announcement days. It’s just that more information arrives on earnings days, so that prices are more volatile on earnings days.[2] How much more volatile? About twice as much, judging by the standard deviation of abnormal returns. Figure 1 shows, for the largest and most liquid U.S. stocks, the cap-weighted ratio of earnings-day volatility to non-earnings-day volatility. Beaver, McNichols, and Wang (2018) show similar results.
The impact of earnings announcements on volatility has risen over time. In December 1998, volatility around earnings was 1.4x higher than normal, while in October 2026 it was 2.3x higher (Alphabet’s recent announcement is reflected in the October 2026 ratio). Beaver, McNichols, and Wang (2018) similarly find “a dramatic increase in information content at earnings dates from 2001 onward.” This increase perhaps reflects Regulation FD (2000) and Sarbanes-Oxley (2002).
Figure 1: Ratio of earnings-day volatility to non-earnings-day volatility—large liquid U.S. stocks
Chart shows the square root of the cap-weighted average, across stocks, of each stock's squared abnormal return in the three-day window around its latest earnings announcement divided by its average squared abnormal three-day return over the three months before that announcement, excluding earnings windows. Universe of large liquid U.S. stocks. Source: Acadian. For illustrative purposes only.
Let me comment on a few episodes. First, the ratio was not especially high during the tech stock bubble, a fact confirmed by Beaver, McNichols, and Wang (2018). Second, during times of great market stress, such as the GFC in 2008-2009 and COVID in 2020, the ratio falls. This pattern makes perfect sense: the earnings announcements immediately after March 2020 contained outdated information and much of the initial information about COVID did not arrive on earnings days. Third, you could argue that the low level of the ratio as of mid-2021 is consistent with a less rational market as the COVID bubble peaked. GameStop, for example, was a stock with very high volatility that was not concentrated around earnings dates.
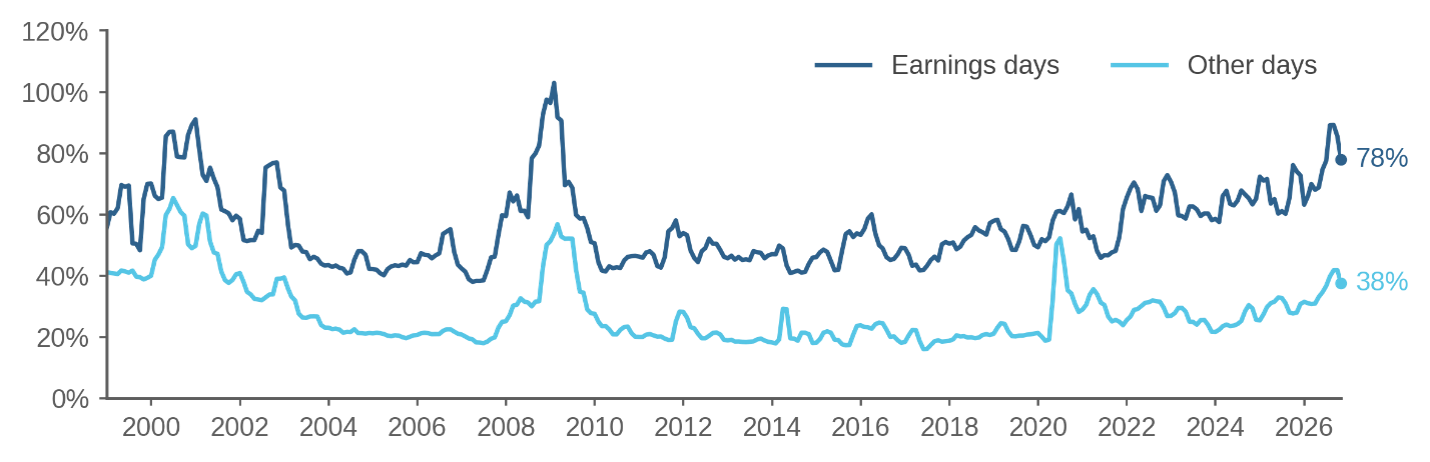
Figure 2: Annualized volatility on earnings days versus other days—large liquid U.S. stocks
The dark blue line is the square root of cap-weighted squared abnormal returns in the three-day window surrounding the latest earnings announcement. The light blue line is the square root of prior 3-month cap-weighted squared abnormal returns. Universe of large liquid U.S. stocks. Source: Acadian. For illustrative purposes only.
Figure 2 gives a different perspective by showing abnormal return volatility on earnings days and other days separately.[3] The darker line shows that idiosyncratic volatility around earnings days is currently extremely high, at 78% annualized. Only in the GFC and the aftermath of the tech stock bubble has earnings-related volatility been higher. So, yes, the volatility of Alphabet and other large tech stocks has been very high on earnings announcements.
On the other hand, the lighter line in Figure 2 shows that non-earnings volatility is also very high. Thus, what’s exceptional about today’s market is not the fact that volatility is high around earnings announcements; what’s exceptional is that volatility is high on both earnings days and non-earnings days.
So where does that leave us? The stock market is acting like it’s rationally assessing fundamental information. Of course, the market may be getting the answers wrong as it grapples with the implications of the AI economy. But at least it’s asking the right questions.
Endnotes
[1] References to this and other companies should not be interpreted as recommendations to buy or sell specific securities. Acadian and/or the author of this post may hold positions in one or more securities associated with these companies.
[2] Zdorovtsov (2009) provides related evidence that both public news arrivals and private information revealed through trading contribute to stock-return volatility.
[3] Since Figure 2 shows cap-weighted averages while Figure 1 shows cap-weighted ratios, the ratio of the lines in Figure 2 is not equal to the ratio shown in Figure 1.
References
Beaver, William H., Maureen F. McNichols, and Zach Z. Wang. “The information content of earnings announcements: new insights from intertemporal and cross-sectional behavior.” Review of Accounting Studies 23, no. 1 (2018): 95-135.
Fama, Eugene F., Lawrence Fisher, Michael C. Jensen, and Richard Roll. “The adjustment of stock prices to new information.” International Economic Review 10, no. 1 (1969): 1-21.
Jensen, Michael C. “Some anomalous evidence regarding market efficiency.” Journal of Financial Economics 6, no. 2/3 (1978): 95-101.
Zdorovtsov, Volodymyr M. News, trading, and stock return volatility. SSRN, 2009.
Don't miss the next Owenomics
Subscribe to receive new articles as they are published from Senior Portfolio Manager and Research, Owen Lamont
These materials provided herein may contain material, non-public information within the meaning of the United States Federal Securities Laws with respect to Acadian Asset Management LLC, Acadian Asset Management Inc. and/or their respective subsidiaries and affiliated entities. The recipient of these materials agrees that it will not use any confidential information that may be contained herein to execute or recommend transactions in securities. The recipient further acknowledges that it is aware that United States Federal and State securities laws prohibit any person or entity who has material, non-public information about a publicly-traded company from purchasing or selling securities of such company, or from communicating such information to any other person or entity under circumstances in which it is reasonably foreseeable that such person or entity is likely to sell or purchase such securities.
Acadian provides this material as a general overview of the firm, our processes and our investment capabilities. It has been provided for informational purposes only. It does not constitute or form part of any offer to issue or sell, or any solicitation of any offer to subscribe or to purchase, shares, units or other interests in investments that may be referred to herein and must not be construed as investment or financial product advice. Acadian has not considered any reader's financial situation, objective or needs in providing the relevant information.
The value of investments may fall as well as rise and you may not get back your original investment. Past performance is not necessarily a guide to future performance or returns. Acadian has taken all reasonable care to ensure that the information contained in this material is accurate at the time of its distribution, no representation or warranty, express or implied, is made as to the accuracy, reliability or completeness of such information.
This material contains privileged and confidential information and is intended only for the recipient/s. Any distribution, reproduction or other use of this presentation by recipients is strictly prohibited. If you are not the intended recipient and this presentation has been sent or passed on to you in error, please contact us immediately. Confidentiality and privilege are not lost by this presentation having been sent or passed on to you in error.
Acadian’s quantitative investment process is supported by extensive proprietary computer code. Acadian’s researchers, software developers, and IT teams follow a structured design, development, testing, change control, and review processes during the development of its systems and the implementation within our investment process. These controls and their effectiveness are subject to regular internal reviews, at least annual independent review by our SOC1 auditor. However, despite these extensive controls it is possible that errors may occur in coding and within the investment process, as is the case with any complex software or data-driven model, and no guarantee or warranty can be provided that any quantitative investment model is completely free of errors. Any such errors could have a negative impact on investment results. We have in place control systems and processes which are intended to identify in a timely manner any such errors which would have a material impact on the investment process.
Acadian Asset Management LLC has wholly owned affiliates located in London, Singapore, and Sydney. Pursuant to the terms of service level agreements with each affiliate, employees of Acadian Asset Management LLC may provide certain services on behalf of each affiliate and employees of each affiliate may provide certain administrative services, including marketing and client service, on behalf of Acadian Asset Management LLC.
Acadian Asset Management LLC is registered as an investment adviser with the U.S. Securities and Exchange Commission. Registration of an investment adviser does not imply any level of skill or training.
Acadian Asset Management (Singapore) Pte Ltd, (Registration Number: 199902125D) is licensed by the Monetary Authority of Singapore. It is also registered as an investment adviser with the U.S. Securities and Exchange Commission.
Acadian Asset Management (Australia) Limited (ABN 41 114 200 127) is the holder of Australian financial services license number 291872 ("AFSL"). It is also registered as an investment adviser with the U.S. Securities and Exchange Commission. Under the terms of its AFSL, Acadian Asset Management (Australia) Limited is limited to providing the financial services under its license to wholesale clients only. This marketing material is not to be provided to retail clients.
Acadian Asset Management (UK) Limited is authorized and regulated by the Financial Conduct Authority ('the FCA') and is a limited liability company incorporated in England and Wales with company number 05644066. Acadian Asset Management (UK) Limited will only make this material available to Professional Clients and Eligible Counterparties as defined by the FCA under the Markets in Financial Instruments Directive, or to Qualified Investors in Switzerland as defined in the Collective Investment Schemes Act, as applicable.
About the Authors
Owen A. Lamont, Ph.D.
Senior Vice President, Portfolio Manager, Research
Owen joined the Acadian investment team in 2023. In addition to more than 20 years of experience in asset management as a researcher and portfolio manager, Owen has been a member of the faculty at Harvard University, Princeton University, The University of Chicago Graduate School of Business, and Yale School of Management. His professional and academic focus is behavioral finance, and he has published papers on short selling, stock returns, and investor behavior in leading academic journals, and he has testified before the U.S. House of Representatives and the U.S. Senate. Owen earned a Ph.D. in economics from the Massachusetts Institute of Technology and a B.A. in economics and government from Oberlin College.