America is aging. The median age of U.S. residents increased from 30 years in 1980 to 39 years in 2024. Oddly enough, this trend in America’s human population is mirrored in America’s equity population. By some measures, the age of the U.S. stock market is near all-time highs. For both the human and the equity populations, the main cause of this aging is lack of new entrants (babies for humans, new issues for equities).
Should we be alarmed by our elderly stock market? Does it reflect declining American dynamism, an ossifying corporate hierarchy, and rising market decrepitude? Should you dump U.S. stocks and shop around for a younger market? No. Rising age may be undesirable for human populations, but for equity markets, lack of young firms indicates high future returns. Based only on its age, today’s geriatric market is a screaming buy.
Consider Microsoft.[1] Microsoft was founded on April 4, 1975, and thus its current founding age is 50.9 years. Its IPO was March 13, 1986, and thus its current listing age is 40. It turns out that Microsoft is representative of the cap-weighted U.S. stock market both in its current listing age and its founding age at IPO.
Figure 1 shows the average listing age of U.S. common stocks from 1980 to 2025, using either value-weighted or equally-weighted averages. It also shows median founding age for operating firm IPOs, from Professor Jay Ritter’s data.
The rising trend in all three age measures is clear. As I’ve previously discussed, the number of IPOs has declined since 2000, resulting in a decrease in the total number of listed firms and an increase in listing age.[2] Founding age at listing has also risen (an extreme example being the recent IPO of Birkenstock, founded in 1774). One explanation is that the growth of private markets has caused firms to stay private longer, as discussed in Huang, Ritter, and Zhang (2023).
Figure 1: Age of U.S. common stock
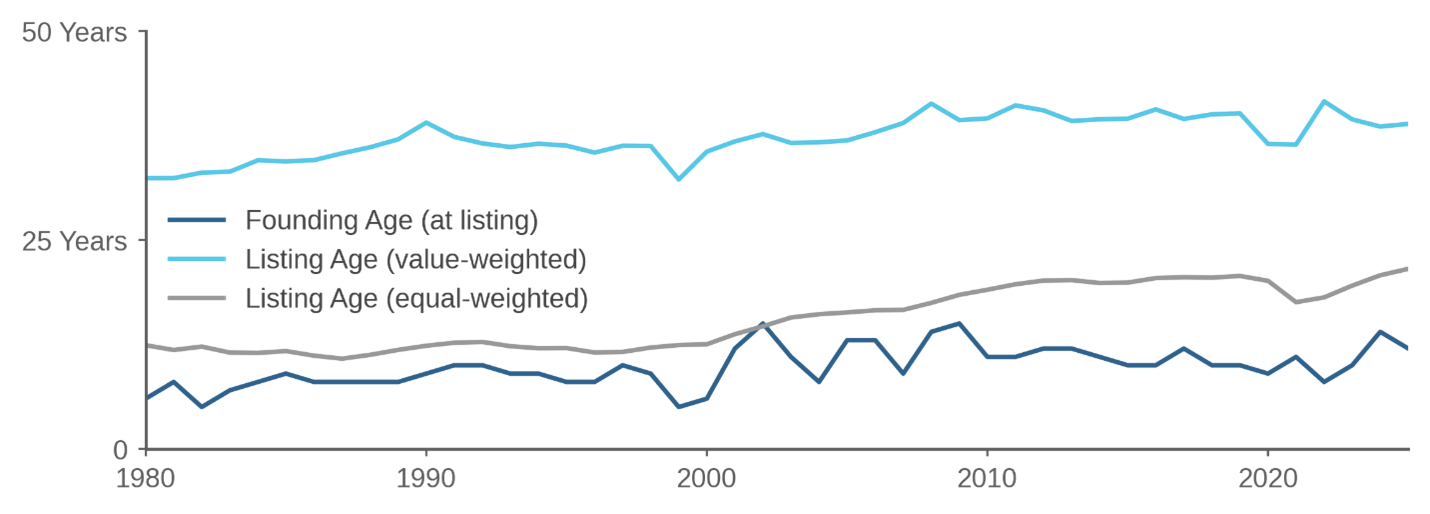
Listing date is defined as the first date that the stock’s PERMCO appears in the CRSP database. The seven Baby Bells which spun off from AT&T in 1984 are assigned the listing date of AT&T. Source: Acadian based on data from CRSP® (Center for Research in Security Prices. Graduate School of Business, The University of Chicago. Used with permission. All rights reserved. Crsp.uchicago.edu.) Founding age at listing is median age from Professor Jay Ritter. For illustrative purposes only. All three age measures tend to fall during new issue waves, with value-weighted listing age falling partly due to new issues and partly due to younger firms rising in price relative to older firms. Greenwood, Shleifer, and You (2019) find that when young firms outperform, that’s a symptom of an emerging bubble.
Exuberant stock markets involve exciting new technology, new personalities, new investors, and new firms. Markets with many young firms tend to be overvalued, because private firms rush to go public to take advantage of high equity prices.
Figure 2: New issue weight vs. subsequent market return
 The new issue weight is the sum of the market cap of all new issues, normalized by total cap of the whole market. February 1929 to November 2025. Source: Acadian based on data from CRSP® (Center for Research in Security Prices. Graduate School of Business, The University of Chicago. Used with permission. All rights reserved. Crsp.uchicago.edu.) For illustrative purposes only.
 Another way to measure market composition is the new issue weight, defined as the percent of the stock market’s total capitalization that has listing age less than three years. Figure 2 shows the new issue weight from 1929 to 2025 and is an update of a similar figure in Lamont (2002).[3] When the new issue weight goes up, that means the market is getting younger as new entrants arrive or as recent entrants outperform the market.
Let me give you a whirlwind tour of the history of new issue waves as seen in Figure 2:
- A huge new issue wave in 1929 with weight peaking over 14% in January 1930.
- A smaller new issue wave in 1968/1969, which Graham (1973) condemned as an “unprecedented outpouring of issues of lowest quality” and which was depicted in season six of Mad Men when the fictional firm of Sterling Cooper Draper Pryce planned an IPO. Weight subsequently peaked over 8% in September 1971.
- A giant wave during the tech stock bubble, with weight peaking over 12% in February 2000.
- A relatively modest wave with weight peaking over 6% in October 2021.
As of November 2025, the new issue weight is 1.3%, far below the historical average of 4.6%. Relatively few firms have gone public in the past three years, and those firms currently have low valuations. While today’s low weight partly reflects the long-term decline in the propensity to go public, it’s still striking that the weight has fallen so dramatically just in the past three years. It’s not just that we don’t have a new issue wave; what we have is an epic new issue drought.
Prior to the current drought, the only years in U.S. history with lower new issue weight were 1934, 1976, 1977, and 1978; times when the U.S. stock market was dirt cheap. Those were fabulous buying opportunities; the dashed line in Figure 2 shows subsequent five-year cumulative market returns. The correlation of the two lines in Figure 2 is -0.37; young markets have low subsequent returns.
In Lamont (2002), I ran a regression that predicted one-month ahead market returns with the new issue weight from 1929 to 2001. I found that the weight:
… is a powerful forecaster of future returns … when the market is overweight in new lists, market excess returns are subsequently low. These results suggest that firms issue equity when expected returns on equity are low (or when equity prices are high).
In the out-of-sample period from 2001 to 2026, the new issue weight continued to work well as a market predictor, correctly identifying 2021 as a bad time to buy stocks. The regression currently predicts high returns going forward.
Of course, unlike in the late 1970s, the market currently does not look cheap based on valuation ratios, and it is entirely possible that the new issue weight is no longer a reliable predictor due to the rise of private markets. But one thing’s for sure: seen through the lens of corporate issuance, today’s stock market looks nothing at all like the 1990s. Instead, the U.S. stock market is a silver fox like George Clooney: old but attractive.
Endnotes
[1] References to this and other companies should not be interpreted as recommendations to buy or sell specific securities. Acadian and/or the author of this post may hold positions in one or more securities associated with these companies.
[2] For more details on the number and composition of listed firms, see Mauboussin and Callahan (2023) and Doidge, Karolyi, Shen, and Stulz (2025).
[3] Any firms entering in August 1962 (when CRSP added coverage for stocks from the American Stock Exchange) and January 1973 (when CRSP added NASDAQ) are classified as old, as are the Baby Bells in 1984.
References
Doidge, Craig, George Andrew Karolyi, Kris Shen, and René M. Stulz. "Are there too few publicly listed firms in the US?." Financial Review 60, no. 2 (2025): 317-329.
Greenwood, Robin, Andrei Shleifer, and Yang You. "Bubbles for Fama." Journal of Financial Economics 131.1 (2019): 20-43.
Graham, Benjamin. The Intelligent Investor. 1973.
Huang, Rongbing, Jay R. Ritter, and Donghang Zhang. "IPOs and SPACs: recent developments." Annual Review of Financial Economics 15, no. 1 (2023): 595-615.
Lamont, Owen. Evaluating value weighting: Corporate events and market timing. No. w9049, National Bureau of Economic Research, 2002.
Mauboussin, Michael J., and Dan Callahan. "Birth, Death, and Wealth Creation." Counterpoint Global Insights (2023)




