How can you tell if you’re in a speculative bubble? Well, bubbles are all about frenzied trading activity. And who benefits from frenzied trading activity? Brokers and other providers of trading services. Just as it’s profitable to sell picks and shovels during a gold rush, it’s profitable to sell trading services during a speculative bubble. Thus, when retail brokerages are extremely successful, that’s a clue that you may be in a bubble.
Today, retail broker stocks are ripping. As shown in Figure 1, Robinhood is up more than 15x in the past two years, with Interactive Brokers up more than 3x.[1] Both were added to the S&P 500 this year (Interactive Brokers in August and Robinhood in September).
Figure 1: Cumulative Return on Robinhood and Interactive Brokers
Normalized to 100 as of Nov 3, 2023. Through Oct 31, 2025.
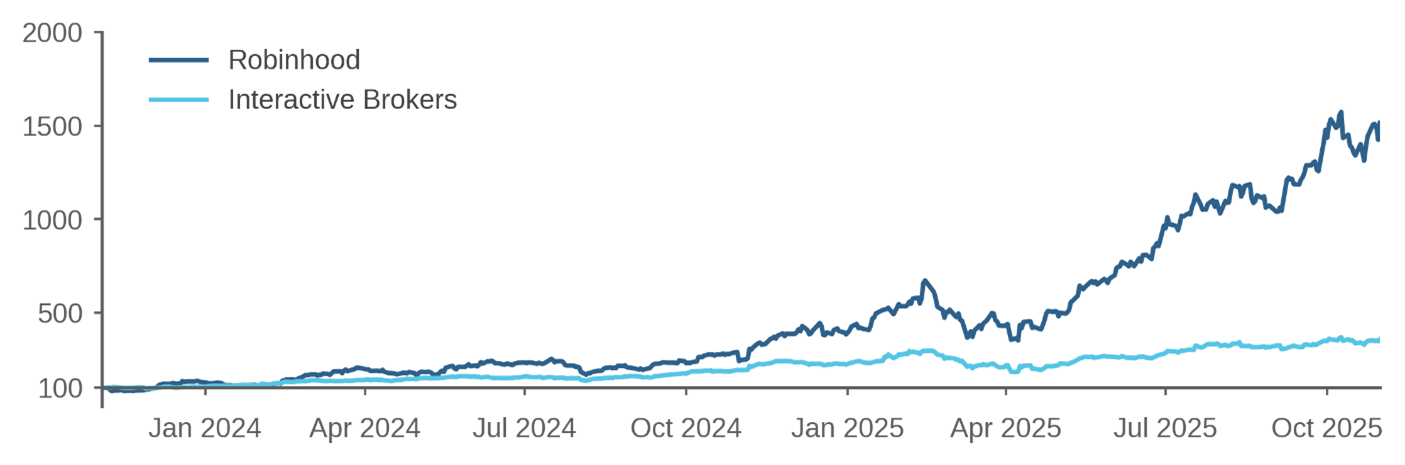
Source: Acadian, based on data from Bloomberg. Past performance is no guarantee of future results. For illustrative purposes only.This outperformance by brokers is yet another sign of speculative excess in the U.S. stock market today. Throughout history, periods when brokers have prospered amid frenetic trading have been followed by market declines.
Let’s go on a whirlwind tour of historical bubbles. We start in Paris in 1719. Here’s Mackay (1841) describing John Law’s Mississippi Bubble:
The public enthusiasm, which had been so long rising, could not resist a vision so splendid. At least three hundred thousand applications were made for the fifty thousand new shares, and Law’s house in the Rue de Quincampoix was beset from morning to night by the eager applicants …
… The Rue de Quincampoix was the grand resort of the jobbers, and it being a narrow, inconvenient street, accidents continually occurred in it, from the tremendous pressure of the crowd. Houses in it, worth, in ordinary times, a thousand livres of yearly rent, yielded as much as twelve or sixteen thousand. A cobbler, who had a stall in it, gained about two hundred livres a day by letting it out, and furnishing writing materials to brokers and their clients. The story goes, that a hunchbacked man who stood in the street gained considerable sums by lending his hump as a writing-desk to the eager speculators!
While today we have trading apps on mobile phones, the technology of 1719 supposedly involved human beings acting as mobile writing desks. While I’m guessing that the Hunchback of the Rue de Quincampoix is as fictional as the Hunchback of Notre Dame, Mackay was probably right that providers of trading services prospered during the Mississippi Bubble.
Moving 210 years ahead, we go to Wall Street in 1929. Here’s The Commercial and Financial Chronicle of April 6, 1929:
And the buyers from the hinterland roll up a tremendous volume of trading, in which the fools splash and swim like frantic salmon running over a dam, and where brokers gather commissions like manna falling from heaven …
Now let’s jump to Japan of the late 1980s, with a stock market bubble peaking in December 1989. The inflating bubble brought prosperity to Japan’s “Big Four” securities companies, including Daiwa Securities. Their prices peaked in mid-1987, with Daiwa up about 5x over two years. Here’s how Daiwa prospered:[2]
Daiwa is first of all a brokerage house with commission revenues approaching $2.5 billion a year … Every morning, at precisely 8 o'clock, a senior manager in Daiwa's sales division turns on a microphone that will carry his voice over leased lines to loudspeakers in Daiwa's 105 branches scattered around the islands. His message consists of an analysis of the action on the market the previous day and a ''suggestion'' of one or more stocks salesmen should push at their customers ... The salesmen sell, these days, most frequently to housewives … Daiwa now hires housewives part time to give parties in their homes, like Tupperware parties, at which investing becomes a social activity.
Next, let’s go ten years forward to 1999 and the U.S. tech-stock bubble. The cutting-edge online brokerages of the late 1990s were Ameritrade, E*Trade, and Schwab. Figure 2 shows their performance from April 1997 to April 2003.
Figure 2: Cumulative Return on E*Trade, Ameritrade, and Schwab
Normalized to 100 on April 1, 1997. Through April 1, 2003.
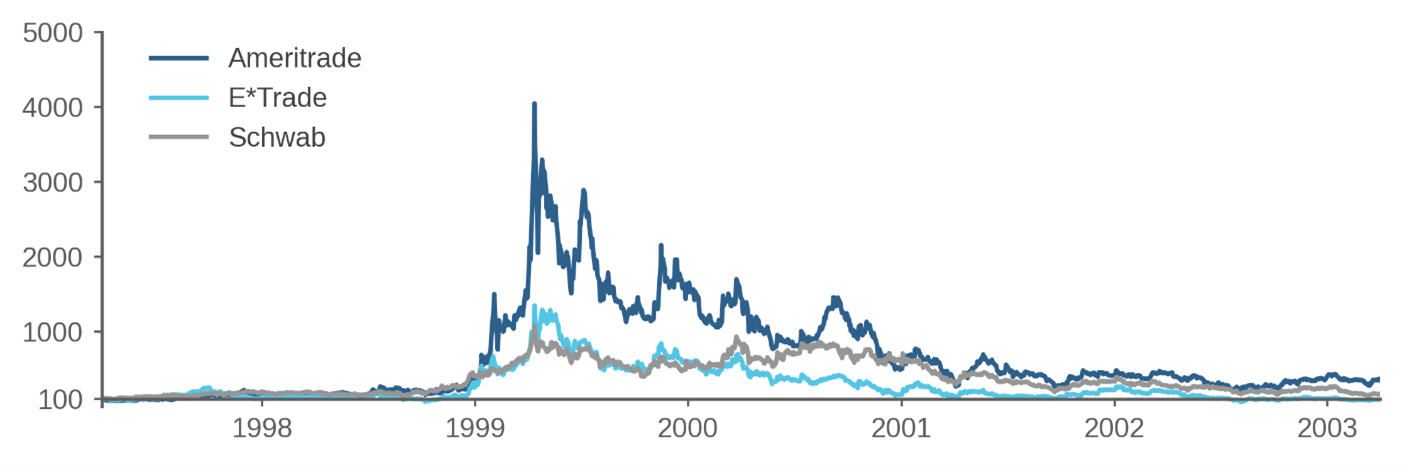
Source: Acadian, based on data from Bloomberg. Past performance is no guarantee of future results. For illustrative purposes only.All three peaked in April 1999, with Ameritrade up 40x from two years prior. The New York Times reported that:[3]
Having evolved from a nation of savers to one of investors, America is rapidly becoming a country of traders.
As proof, several brokerage firms have just reported record profits, fueled in large part by a surge in stock trading among both individuals and institutions.
Part of the frenzy comes from day traders, who take advantage of the low cost of trading stocks over the Internet to buy and sell rapidly and profit from small changes in stock prices. A formidable market force, this group has recently focused on one of the areas they like best, brokerage firms, bidding up the stocks of the very companies profiting from their business.
… The stock price of Schwab, which operates the largest on-line brokerage, has soared 40 percent in the last five days … Shares of Ameritrade, another on-line discount broker, have more than doubled in the last five days …
The whole stock market peaked 11 months later.
Last, we go to the Chinese stock market bubble peaking around May 2015. It involved companies offering stock trading apps, such as East Money and Hithink Flush. Both of these had shares that were up more than 15x over two years, peaking at about the same time as the entire China A shares market.
So, in summary, many past bubbles have seen surging broker share prices, peaking either prior to or concurrent with the bubble. Of course, here I have not performed a rigorous study demonstrating reliable predictive power; I’ve just cherry-picked extreme examples. All I can say is that, for me, these historical instances sure resonate.
Another bubble indicator is issuance; I call it the Third Horseman of the bubble apocalypse. When you see many IPOs, that means you might be in a bubble. Let me now go further: when you see many IPOs of brokers, that really means you might be in a bubble, as it indicates both high trading activity and selling by the smart money (issuers).
Looking at the tech-stock bubble peaking in March 2000, E*Trade had its IPO in August 1996 and Ameritrade had its IPO in March 1997. Looking at the COVID-era bubble peaking in December 2021, Robinhood’s IPO was July 2021. So far in 2025, we’ve seen two retail brokers go public in the U.S. (eToro via IPO in May 2025 and Webull via SPAC in April 2025), not counting the wave of crypto-related IPOs flooding the stock market.
What does it all mean? Brokerage stocks have soared, just as they did in April 1999. So is it obvious you should get out of U.S. stocks immediately? Maybe you should short the market? No way. The Nasdaq composite approximately doubled from April 1999 to March 2000. Euphoric brokerage stocks might be a sign of excess, but excess can always get more excessive.
Is the U.S. stock market in a bubble? I don’t know. Ask me again after prices double from their current level.
Endnotes
[1] References to this and other companies should not be interpreted as recommendations to buy or sell specific securities. Acadian and/or the author of this post may hold positions in one or more securities associated with these companies.
[2] “Japan Roils the Market,” The New York Times, September 20, 1987.
[3] “THE MARKETS: Market Place; Day Traders Are Formidable Market Force,” The New York Times, April 14, 1999.
References
Mackay, Charles. Extraordinary Popular Delusions and the Madness of Crowds. London, 1841.




