Many asset owners are looking to invest in a global shift to a lower carbon economy, believing that the transition will help to determine corporate winners and losers for many years to come. For such investors, however, the potential scope of the energy transition poses both an opportunity and a challenge. While the most conspicuous beneficiaries may include companies that make or distribute clean technologies, less-apparent winners may include consumers of those technologies as well as producers of their raw materials and components. As a result, the universe of potential participants in the energy transition is expansive, diverse, and, at first blush, ambiguous.
In this note, therefore, we illustrate benefits of applying advanced natural language processing (NLP) techniques in constructing transition-aligned thematic portfolios. Specifically, we introduce a systematic predictive signal, called GEO (Green Economy Opportunities), that can identify companies associated with the transition more comprehensively, using richer information, and on a more timely basis than traditional methods.
Using the GEO signal, we then highlight often-overlooked design decisions in the creation of thematic investment strategies. In particular, we demonstrate the financial benefits of applying sophisticated systematic portfolio construction methods as opposed to following the more conventional approach of selecting from a limited universe of companies that are most manifestly aligned with the theme of interest.
Introducing GEO
To identify companies that are directly or indirectly linked to the energy transition, we took a novel approach and developed a predictive signal. The methodology uses sophisticated NLP techniques applied to a wide range of corporate disclosures to 1) identify firms with transition-related products, services, and policies and 2) gauge their commitment to sustainability and the environment.
This application of NLP techniques to analyze text has three advantages over conventional data produced by ESG analysts without the aid of such technological sophistication:
-
Scope: NLP is orders of magnitude more efficient than human beings in processing company documents, and it can be applied across many languages. Moreover, while data coverage for many traditional climate metrics is often limited to large companies, the text-based approach generates far greater coverage, particularly among mid- and small-cap stocks. (Figure 1)
-
Richness: The ability to process both qualitative and quantitative information from diverse sources allows for greater breadth and nuance in measuring thematic alignment. For example, traditional data providers frequently rely on information about companies’ revenue sources to identify thematic exposure, but that often limits coverage to “pure plays.” But because many environmental projects are long-term and capital intensive, it is especially important to expand the information set in the context of the energy transition. NLP allows investors to account for companies’ future plans through the inclusion of forward-looking statements.
-
Timeliness: The GEO signal updates automatically as new information arrives and is algorithmically processed. There is no need to wait for a scheduled review, as is the norm for traditional data providers.
Figure 1: Securities with Data Coverage by Market-Cap Tercile—GEO versus Clean Energy Metrics
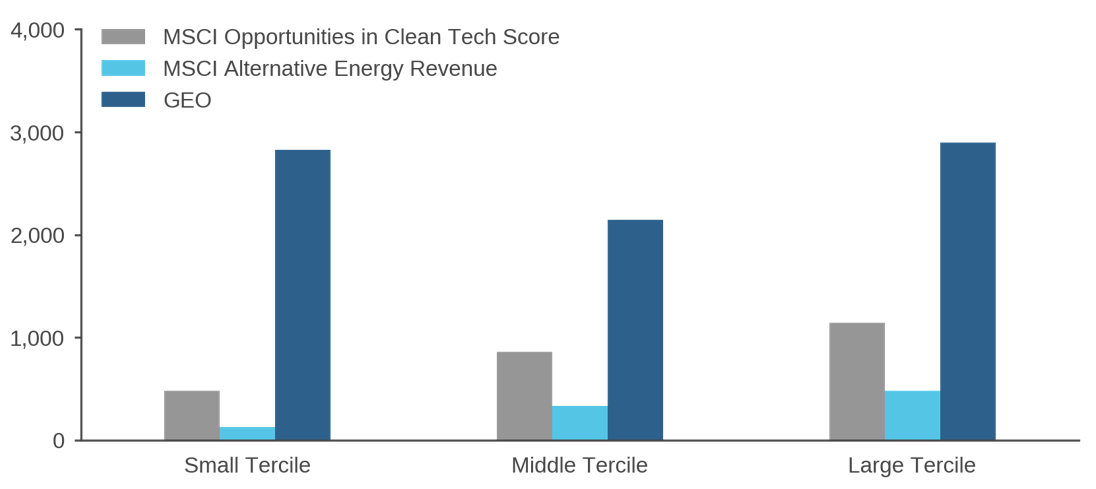
Data as of January 2022. Number of global stocks where the indicated data items are available, sorted into terciles by market capitalization. Sources: Acadian, MSCI. MSCI data copyright MSCI 2023. All rights reserved. Unpublished. PROPRIETARY TO MSCI. For illustrative purposes only.
The methodology underlying GEO involves training a complex machine-learning algorithm to recognize and quantify the extent to which individual companies discuss environmental themes, including decarbonization plans, renewable energy, and carbon capture. The first step in that process is to train the algorithm to recognize salient characteristics of information related to the energy transition by having it process reports on the topic published by various industry organizations.
Using a subset of ML called supervised learning, we then apply an algorithm to analyze a wide range of company disclosures, among them earnings call transcripts, regulatory filings, and annual shareholder meetings, to measure firms’ alignment with the energy transition. Figure 2 provides illustrative examples that highlight the breadth and industry-specific nature of energy transition topics that GEO can recognize. For instance, the words highlighted in dark blue reflect discussions about decarbonization, while the words in light blue refer to discussions about renewable energy.
Figure 2: Illustrative GEO Text Processing Examples
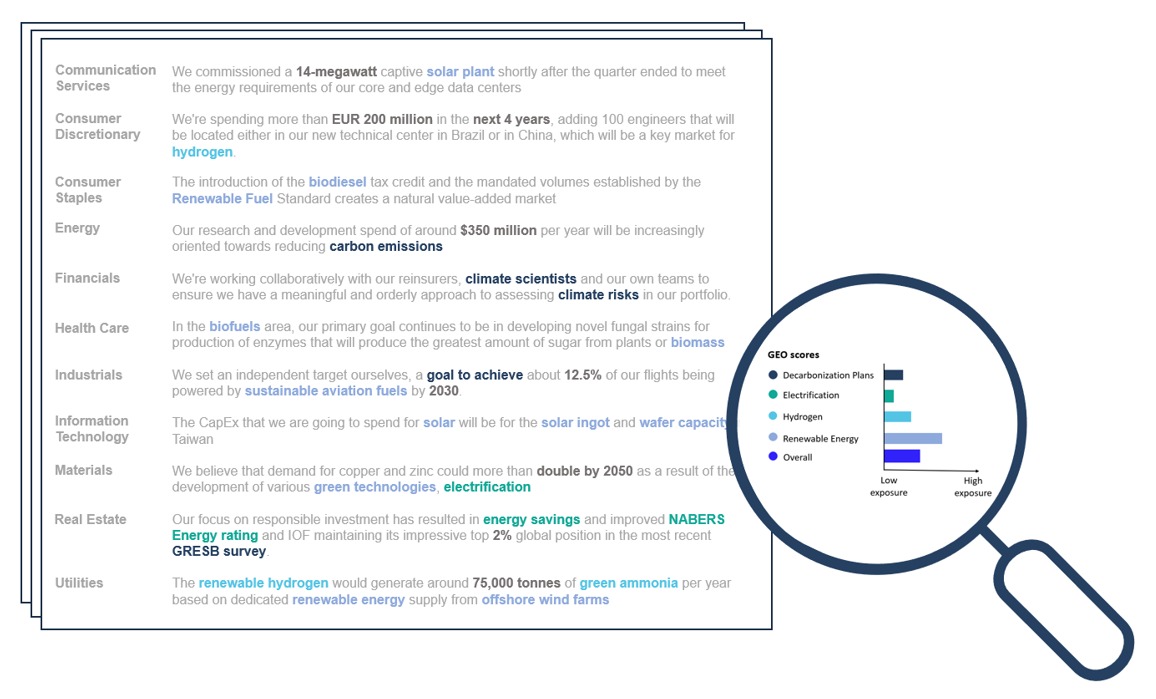
Source: Acadian.
But the model does more than simply quantify the extent to which companies speak about the transition. It also assesses the credibility of what they say by integrating prescriptive guidelines from leading climate frameworks, including the Task Force on Climate-related Financial Disclosures and the Science Based Targets initiative. For example, the NLP algorithm takes into account the granularity of decarbonization plans, including whether they refer to dates, baselines, and targets.
Figure 3 provides hard evidence of the GEO signal’s ability in measuring company-level alignment with the energy transition. The left panel shows that GEO scores predict one-year-ahead changes in carbon intensity. Specifically, if we sort stocks in a combined developed and emerging market universe by the GEO signal, we see a monotonic pattern of subsequent peer-relative declines in carbon intensity. The right panel provides corroborative evidence, showing that companies with the highest GEO scores are more likely to commit to science-based targets or hold a higher proportion of green patents. The demonstrably forward-looking nature of GEO contrasts with conventional climate metrics, such as scope 1 and 2 emissions, which are backwards-looking and often reported with a lag.
Figure 3: GEO Environmental Characteristics
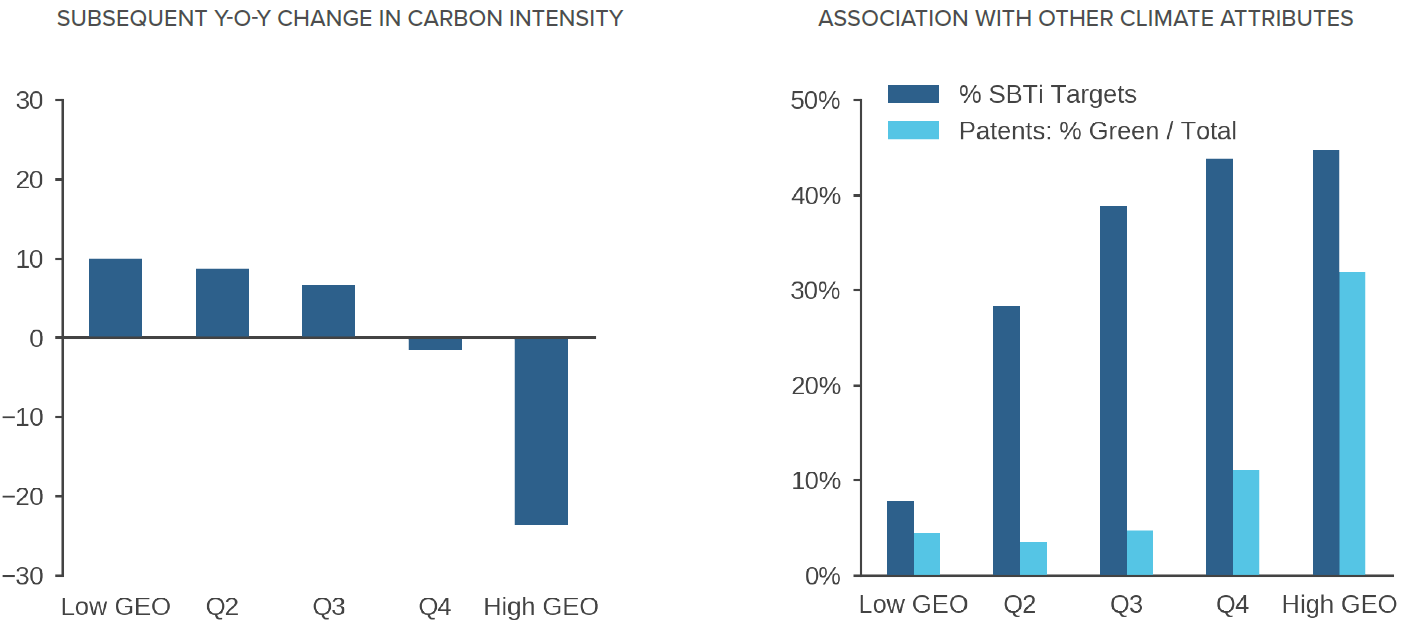
Both charts: Data for stocks in a DM + EM equity universe is sorted into quintiles by proprietary GEO score. Left chart: Average one-year forward change in peer-relative (demeaned) carbon intensity 2010-2020. Right chart: Patent data is from MSCI as of April 2022. Sources: Acadian based on data from the Science Based Targets initiative and MSCI. MSCI data copyright MSCI 2023. All rights reserved. Unpublished. PROPRIETARY TO MSCI. For illustrative purposes only.
GEO-Based Portfolios: Benefits of a Systematic Implementation
Because the GEO signal allows for better exploitation of the full opportunity set in creating low-carbon-transition portfolios, it also brings to the fore certain design decisions that often go overlooked in the creation of thematic strategies, specifically in relation to the breadth of the investment universe and portfolio construction.
To illustrate, we compare three implementations of the GEO signal. As a common baseline, we start with a hypothetical Low Carbon strategy that is benchmarked to the MSCI World Index. While this baseline integrates ESG-related alpha signals, a net zero glidepath, and exclusions of climate laggards based on fossil fuel revenues and forward-looking considerations, it does not make use of GEO to identify stocks associated with the energy transition.1
In framing hypothetical GEO-based strategies, we consider a conventional use case where an investor seeks positive active exposure to companies that are aligned to and might benefit from the energy transition.2 We compare three approaches to achieving this objective:
-
Restricted Universe: Although systematic in implementation, this approach echoes a key aspect of conventional discretionary thematic strategies, which tend to draw from restricted investment universes composed of those companies that are most manifestly aligned with the desired theme. As such, we rank stocks in the investable developed market universe by the GEO signal and only consider the top-20% for portfolio inclusion. To isolate the impact of limiting the investment universe in building the Restricted Universe strategy, we retain most of the other major features of the Low Carbon baseline, including its returns forecasting and portfolio construction elements.3 Nevertheless, we relax the decarbonization constraints themselves, because similar restrictions are not commonly found in discretionary thematic strategies aimed at capitalizing on the energy transition.
-
Integrated: Relative to the Restricted Universe approach, this implementation makes better use of the broader investment universe that the GEO signal affords. Specifically, the Integrated GEO strategy applies an additional portfolio-level tilt to the Low Carbon baseline (including the decarbonization constraints), requiring that its (ex-ante) GEO exposure exceed the benchmark’s by 20%.
-
Thematic: This implementation is similar to Integrated, except that it includes a stronger tilt towards GEO exposure, two times the benchmark, with the intent of providing exposure to green companies that is similar to the Restricted Universe GEO strategy.
To reiterate, each of the hypothetical strategies seeks to maximize risk-adjusted returns using Acadian’s multi-factor stock selection and portfolio construction process while also ensuring the specified minimum GEO exposure (if any). They are all rebalanced monthly from January 2016 – August 2022, and the exercises assume starting AUM of USD 1bn.4
Figure 4 shows headline results. The left panel focuses on the ESG objective. Despite the challenges associated with green revenue, one way to independently measure the effectiveness of applying GEO is to assess the exposure to companies with a material portion of their revenue from green sources, including a range of environmental solutions such as alternative energy, products that promote energy efficiency, and pollution prevention.5 While the Low Carbon baseline actually exhibits lower exposure to green revenue companies than the MSCI World Index, despite its otherwise climate-favorable construction, all three of the GEO strategies deliver positive active exposure to green revenue companies as at the end of the simulation period. Thematic GEO generates the largest increase, slightly higher than Restricted Universe GEO.
Figure 4: Key Environmental Characteristics and Financial Results—Hypothetical Strategies
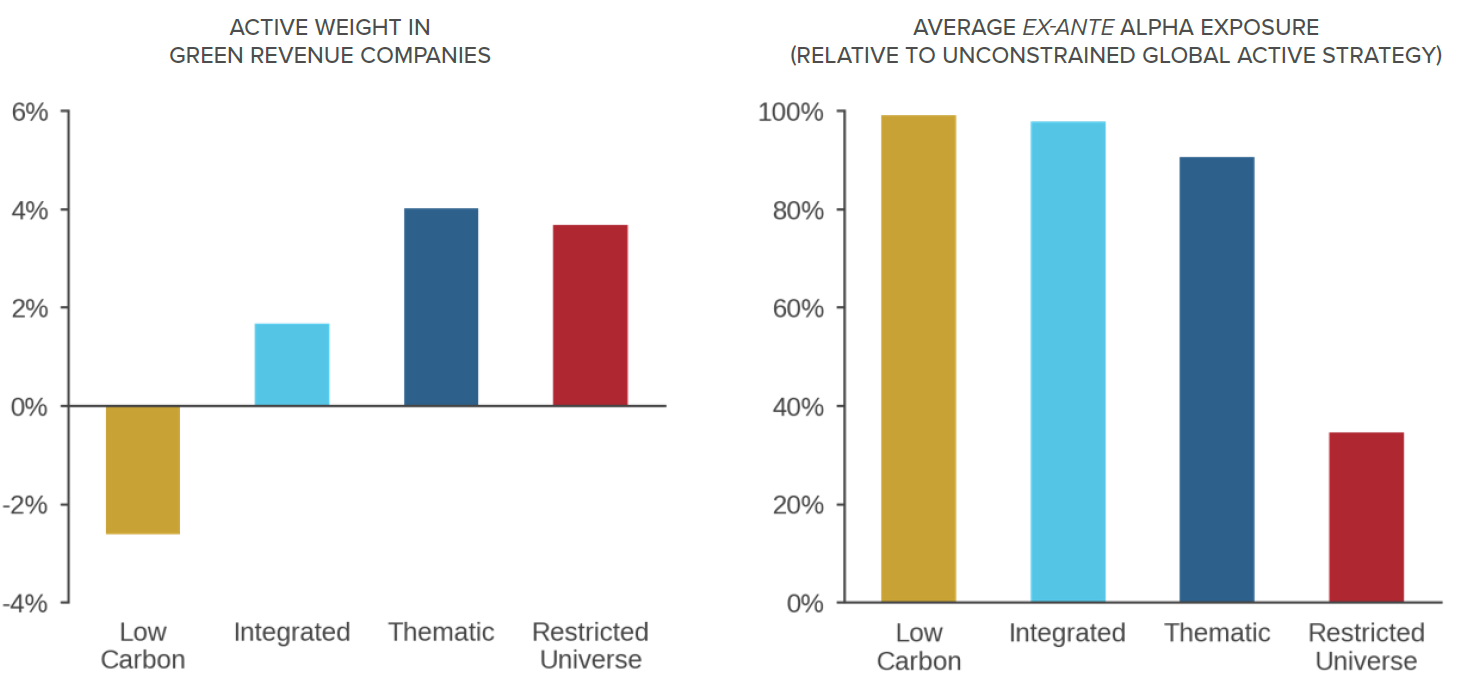
Charts represent average performance of hypothetical portfolios based on long-only strategies benchmarked to the MSCI World Index from January 2016 – August 2022. Key assumptions include USD1BN starting AUM, monthly rebalancing, and others noted in the text. Green revenue companies are those with more than 10% of their revenue from green opportunities. Please contact us for further details about portfolio construction. Sources: Acadian using green revenue data from MSCI. This is meant to be an educational illustrative example and is not intended to represent investment returns of an actual portfolio. Results do not represent actual trading or an actual account. They do not reflect transaction costs, other implementation costs, and advisory fees or their potential impact. Hypothetical results are not indicative of actual future results. Reference to the benchmark is for comparative purposes only and is not intended to indicate that the simulated portfolio contained or will contain the same investments or weights as the benchmark. Every investment program has the opportunity for loss as well as profit. MSCI data copyright MSCI 2023. All rights reserved. Unpublished. PROPRIETARY TO MSCI. For illustrative purposes only.
The key issue for investors, however, is the financial impact of achieving the ESG gains. The right panel of Figure 4 shows that the Restricted Universe approach, which limits the investment universe as conventional thematic strategies tend to do, has a substantial cost in terms of exposure to Acadian’s alpha model, with nearly a 50% reduction relative to Acadian’s standard global equity strategy. In contrast, the Integrated and Thematic implementations, which make use of portfolio-level tilts to boost GEO exposure, exhibit minimal deterioration.6
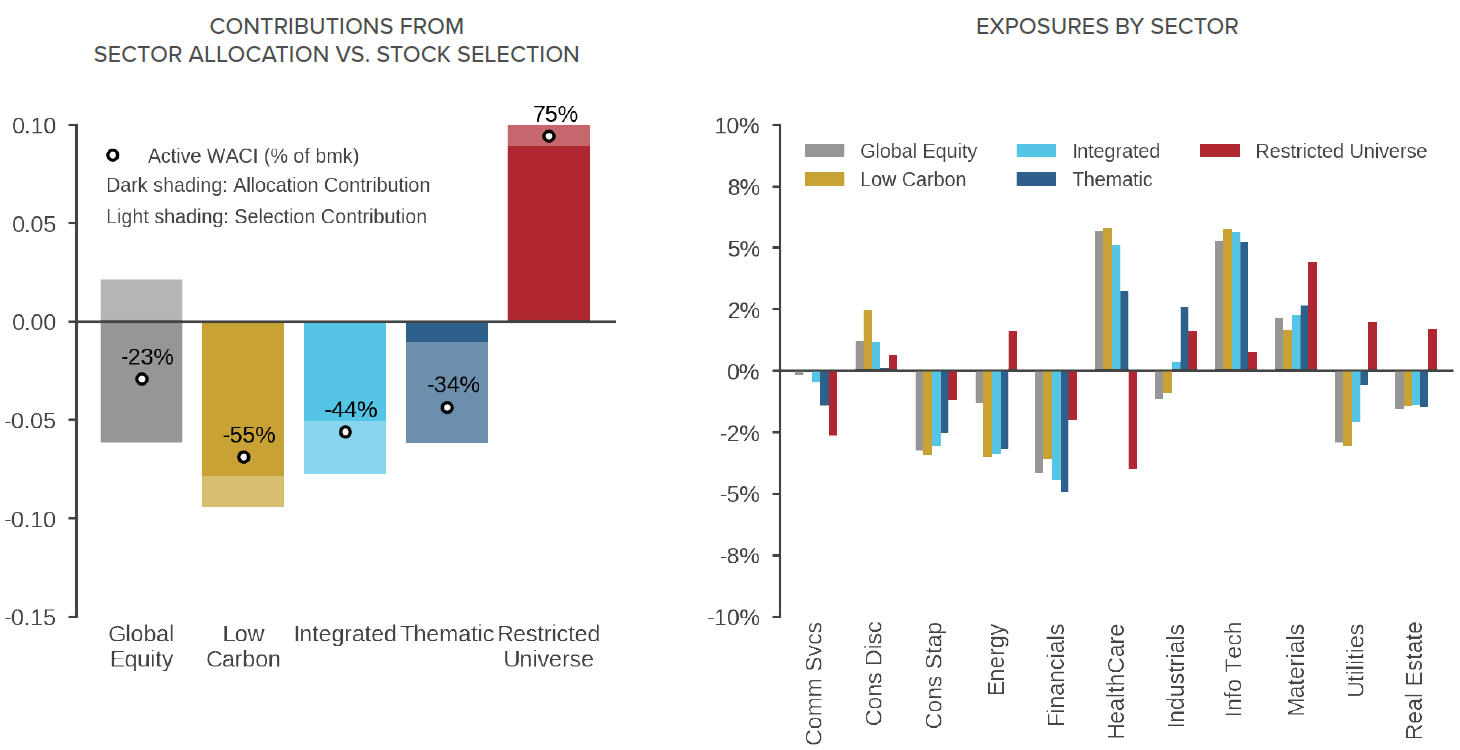
Figure 5 provides insight as to how the Thematic GEO implementation generates both attractive environmental characteristics and financial results. For each hypothetical strategy, the left panel breaks out contributions to weighted-average carbon intensity (WACI) from stock selection and sector allocation. WACI is an important attribute to track in the context of energy transition-oriented investments, because many companies that have high clean energy exposure also have high current fossil fuels exposure. As a result, thematic strategies that focus on the energy transition also tend to have high WACI because they overweight carbon-intensive sectors. Consistent with that observation, the Restricted Universe GEO implementation, which does not include decarbonization constraints, indeed exhibits WACI in excess of the benchmark (left panel) reflective of overweights in both energy and utilities (right panel).
But the portfolio tilt-based Integrated and Thematic implementations manage to avoid this elevated WACI profile—in fact still meeting the baseline Low Carbon constraints—while also achieving their GEO targets and maintaining high alpha model exposure. The reason is that these constraint-based GEO implementations extract significant increases in GEO exposure through stock selection rather than blunt sector reallocation.
The charts in Figure 5 illustrate this point. In particular, the left panel shows that stock selection, on average, accounts for nearly all of the Thematic strategy’s benchmark-relative WACI reduction. The right panel shows that the Thematic portfolio maintains an overall sector allocation profile that is reasonably similar to the Low Carbon baseline, including underweights to both energy and utilities. The key to achieving this outcome is that the portfolio tilt-based approaches make use of the GEO signal’s ability to identify diverse companies from across sectors that are highly exposed to the energy transition, which provides greater flexibility to meet the aggressive GEO exposure target while still meeting the Low Carbon strategy’s decarbonization constraints and retaining alpha exposure.
Figure 5: Average Active WACI—Hypothetical Strategies
WACI represents Scope 1 + 2 emissions. Hypothetical portfolios based on strategies as described in note to Figure 4 and the text. Data represents averages from January 2016 – August 2022. Sources: Acadian using index and carbon data from MSCI; we estimate carbon emissions where MSCI data is missing. This is meant to be an educational illustrative example and is not intended to represent investment returns of an actual portfolio. Results do not represent actual trading or an actual account. They do not reflect transaction costs, other implementation costs, and advisory fees or their potential impact. Hypothetical results are not indicative of actual future results. Reference to the benchmark is for comparative purposes only and is not intended to indicate that the simulated portfolio contained or will contain the same investments or weights as the benchmark. Every investment program has the opportunity for loss as well as profit. MSCI data copyright MSCI 2023. All rights reserved. Unpublished. PROPRIETARY TO MSCI. For illustrative purposes only.
Figure 6 highlights another advantage of the portfolio tilt-based GEO implementations by showing the Thematic strategy’s active revenue exposure to different sub-themes of green energy, as measured using data from a third-party source (MSCI). Intuitively, the strategy exhibits positive exposure to many of these sub-themes, including recycling, sustainable agriculture, insulation, and pollution control. But it also has negative active exposure to zero emission vehicles (largely Tesla) and clean transport infrastructure.7 The underweights reflect the influence of valuation signals on stock selection, which help to ensure that the strategies do not buy thematic exposure at any price.
Moreover, many other company attributes that help to predict future returns also influence the portfolio, including governance signals that measure management’s quality and alignment with shareholder incentives. We view such governance considerations as especially important in the development of energy transition thematic portfolios, because the capital flowing into green technologies has increased the risk of overinvestment and other agency problems. Incorporating an alpha model that considers financial and non-financial characteristics may be critical to successful investment outcomes.
Figure 6: Hypothetical Thematic GEO Active Revenue Exposure—By Green Energy Sub-Theme
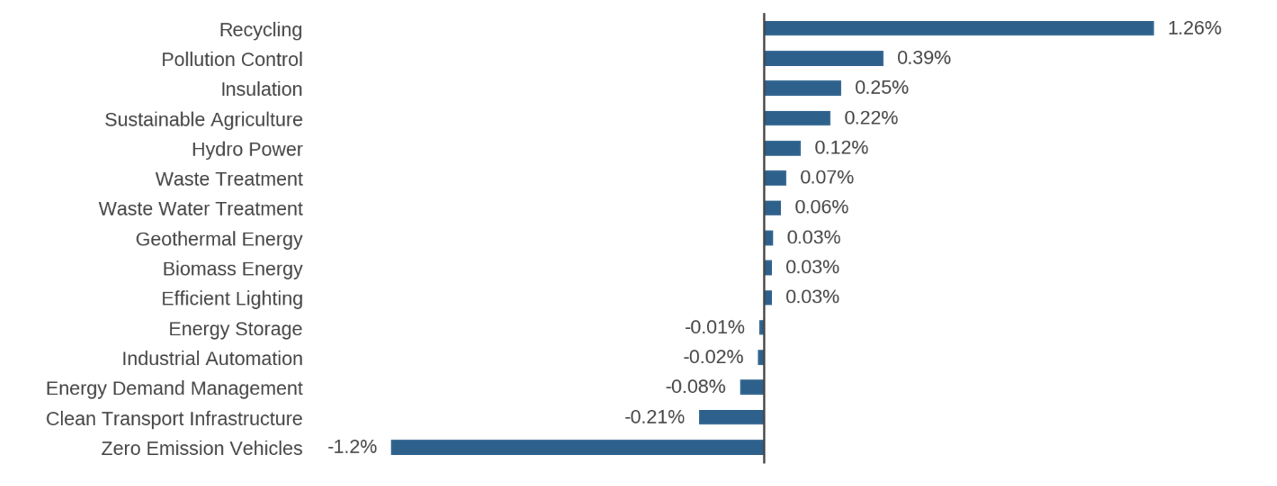
Results represent a snapshot of the simulated thematic strategy as of the end of the simulation period from January 2016 – August 2022 for hypothetical Thematic GEO portfolio constructed as described in note to Figure 4 and the text. These hypothetical results are meant to be an educational illustrative example. They do not represent results of an actual portfolio and are not indicative of actual future results. Sources: Acadian using green revenue data from MSCI. MSCI data copyright MSCI 2023. All rights reserved. Unpublished. PROPRIETARY TO MSCI. For illustrative purposes only.
Conclusion
Most investors probably don’t readily associate systematic investing with thematic strategies. Yet in the thematic context, the increasingly sophisticated analysis of alternative data that has become a central focus of systematic investing offers substantial benefits.
For example, as we’ve demonstrated in the context of the energy transition, we can apply scalable machine-learning algorithms, and specifically NLP-based textual analysis, to identify a more expansive set of relevant companies on the basis of richer, more forward-looking, and more timely information than conventional methods of stock selection. Moreover, the sophisticated portfolio construction machinery that underlies modern systematic investment processes can extract greater financial value from the resulting investment universe. In the energy transition case study, we show that it better preserves exposure to a holistic stock-selection alpha model and better controls for uncompensated risk exposures than traditional methods of forming thematic portfolios.
Profitably applying these tools isn’t easy, however. It requires significant algorithmic expertise and high-performance computing infrastructure. From the standpoint of a sophisticated systematic investor, however, these foundational investments are part of a much broader and ongoing evolution of the information set and the analytical toolkit. As such, their adaptation to the development of thematic portfolios is, perhaps, surprisingly natural.