
What to do about Fixed Income? Fresh Perspective
Key Takeaways
- In reassessing prospects for sovereign bond allocations, we show why the outlook remains bleak with respect to return generation and why the equity-risk offset that many investors have come to rely on may degrade.
- We present a clarifying framework for evaluating fixed income replacement strategies and allocations, including direct hedging, hedge funds, and gold.
- We outline desirable characteristics of candidate replacements, starting with clear objectives with respect to return generation and equity risk reduction.
Table of contents
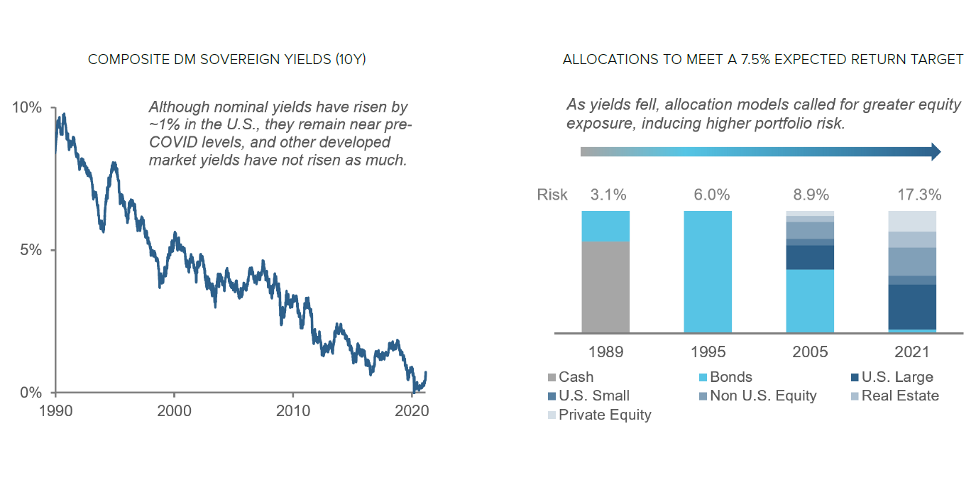
Over the past four decades, the long-term sovereign bonds that typically dominate asset owners’ fixed income allocations have delivered outstanding returns. Moreover, since 2000, they have also been exemplary risk-reducing assets. Nevertheless, as the secular bull market in bonds progressed and yields fell, expectations of future returns diminished, and investors felt increasing pressure to find alternatives to those allocations. To meet stubbornly high nominal portfolio return expectations, conventional asset allocation models responded by progressively increasing equity holdings, both public and private. This has come at the cost, however, of higher overall risk and greater vulnerability to equity market shocks. (Figure 1)
Figure 1: Global Bond Yields and Their Impact on Asset Allocation Models
In this note, we reconsider alternatives to fixed income allocations in the current market context. We first disentangle the primary benefits that bonds have offered historically—risk reduction and return generation—and we consider the outlook for each going forward. We then consider the two major approaches that investors have sought to meet those objectives, hedging equity exposure and reallocating to uncorrelated positive return streams, and why such approaches have often met with disappointment. We then outline hallmarks of investing approaches that we believe investors should seek in reallocating from fixed income.
The Evolving Role of Fixed Income Allocations
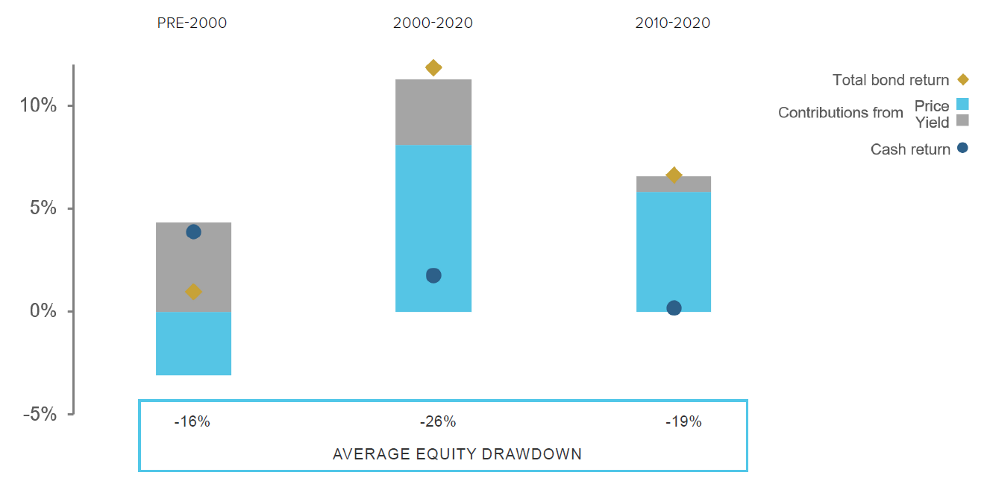
Over the past two decades, the primary role of fixed income allocations has evolved from that of a return source with modest risk reduction benefits to an offset for equity risk with a much more attractive return profile than explicit hedging strategies. Although bonds’ income has diminished, their price appreciation has softened the impact of declining yields.
Figure 2 illustrates the changing mix of bond return drivers. For decades prior to the 2000s, bond price movements did not provide much of a hedge during severe equity market drawdowns.1 High bond yields counterbalanced that lack of protection, however. In contrast, over the last two decades, bond price appreciation has offered a more material hedge against equity losses, while the yield benefit has declined to currently low levels, de minimis or even negative in some markets.
Figure 2: U.S. Bonds — Returns Decomposition
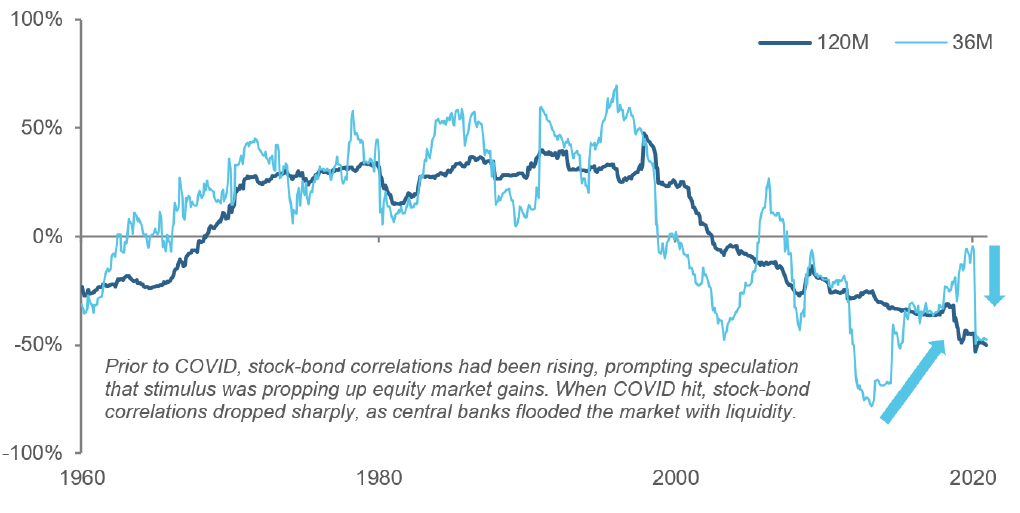
Looking ahead, the price-based diversification benefits that bonds have provided since 2000 may also diminish. Figure 3 shows that we should not take strong negative stock-bond price correlation for granted. In fact, prior to the 2000s, it was positive for close to three decades. Moreover, recently, bonds and cap-weighted equity indexes have sold off together amid concerns about re-emergent inflation and diminished prospects for large, expensive technology stocks that benefited from COVID business conditions.2
Figure 3: U.S. Stock-Bond Correlations
If significant inflation does not materialize and long-term yields remain historically low, however, then Japan offers a glimpse as to what may lie ahead. Japan’s experience suggests that continued global central bank policy measures to support growth could dampen the value of fixed income allocations as an offset to equity drawdowns. Figure 4 shows the trajectory and drivers of long-term Japanese bond returns. The early history
resembles the more recent U.S. experience. Through the mid-1990s, JGBs produced healthy yields but little price offset to equity drawdowns. During the “lost decade” and into the 2000s, however, income largely disappeared as yields steadily fell, but bonds provided a hedge against equity drawdowns through negative price correlation.
Figure 4: Japanese Bonds — Returns Decomposition
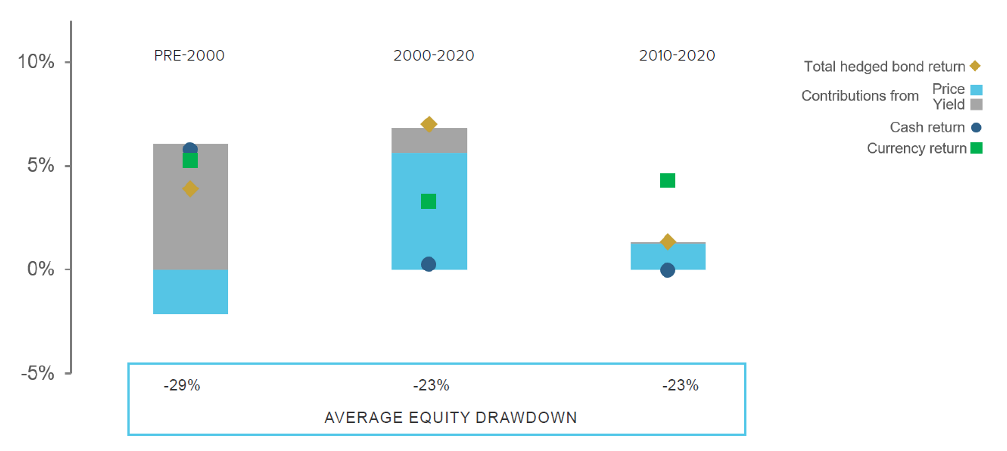
Over the next 10 years, however, as the BOJ imposed even more aggressive policy measures and yields reached zero, bond prices stopped providing an equity offset. In fact, much of the downside protection that JGBs provided to global investors over the last 10 years resulted from safe-haven effects involving the yen rather than the intrinsic behavior of the bonds themselves. The Japanese experience suggests that if global long-term yields were to remain very low, the implicit equity hedge that investors have come to rely on from fixed income in times of stress might be materially attenuated.
Not only are there potential challenges to fixed income’s value as an equity offset, but its total return outlook is also limited given where yields are today.3 To see why, consider three scenarios for investments in 10-year sovereign bonds: a) low for longer — 10-year global yields remain steady at 1%; b) negative rates — yields fall from 1% to -2%; and c) reflation — yields rise from 1% to 3%. Figure 5 shows that in all three cases, annualized returns over a 20-year horizon would be roughly 1%. That’s because initial capital gains or losses would be largely offset, given the duration and holding period assumptions, by diminished or improved reinvestment opportunities.
Figure 5: Three Scenarios for Global Sovereign Bond Yields
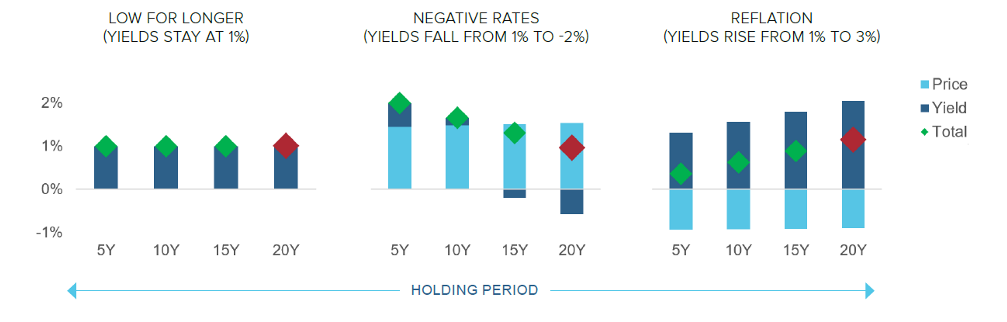
Of course, current bond holders’ response to changing yields would affect outcomes. If inflationary fears are realized, bond holders who absorb capital losses might give up on their allocations before they can enjoy the benefit of reinvesting into higher yields.4 On the other hand, if yields fall further, angst over what to do with fixed income allocations would likely grow. For fixed income holders, therefore, the outlook seems uncomfortable across a variety of scenarios.
Conventional Fixed Income Alternatives
The secular decline in expected sovereign bond returns has for years pushed conventional asset allocation models into higher equity exposures, as we documented in Figure 1. But the accompanying increase in risk prompted asset owners to search for approaches that would preserve the higher expected portfolio returns while reducing vulnerability to equity market drawdowns. The responses fall into two broad categories:
- Hedges, in other words, investments that reduce portfolio drawdown risk to the point where the higher equity exposure is tolerable. Hedges entail a cost, in terms of either up-front premium paid or drag on expected returns.
- “Uncorrelated” investments that provide positive expected returns but reduce overall portfolio volatility and, specifically, have limited exposure to market stress. Demand for such return streams contributed to the growth of hedge funds, private markets, real estate, and other alternative investments.
For many asset owners, however, finding satisfying alternatives to fixed income allocations has been a challenge for three reasons. First, direct hedging tends to be costly, particularly on a systematic basis. For example, over the past 10 years, the median cost of three months of put protection against S&P 500 declines in excess of 10% has been on the order of 0.95% of the underlying portfolio's value. As a result of the high cost of reducing deep downside exposure, even risk-averse investors often forgo hedging entirely or eventually throw in the towel.5
There are methods to reduce the up-front cost of hedging. Relatively simple and transparent approaches include limiting the extent of the downside protection (put spreads) and sacrificing upside exposure (collars). But investors often find that the alternative structures create unpalatable performance profiles or mark-to-market behavior. More sophisticated hedging approaches, which include active volatility trading, market timing via options, or taking a view on the specific trigger or nature of a selloff, tend to be opaque and limited in capacity.
A second issue in finding fixed income alternatives is that many diversifying return streams have been more exposed to equity beta and other conventional exposures than many investors have realized. Over the past several months, there has been resurgent interest in hedge funds as a fixed income alternative, owing to a recent rebound in their performance relative to the prior decade. (Figure 6, left panel) But as we’ve discussed extensively in prior research, many styles of hedge funds, and their liquid cousins, alternative risk premia strategies (ARPs), exhibit both material exposure to basic forms of equity and bond risk as well as "short-put like” vulnerability to equity crashes.6 As a case in point, hedge funds, in aggregate, did not perform well during the Q1 2020 market crisis. (Figure 6, right panel)
Figure 6: HFR Fund Weighted Composite Index
Underrecognized exposure of private equity (PE) and real estate to equity market drawdown risk represents another facet of the same problem. Smoothing and other forms of discretionary accounting have left reported PE return streams largely unscathed by recent equity downturns, even through the un-precedented turmoil of the March 2020 crisis.7 While market valuations of publicly listed PE firms have shown substantial damage during such episodes, suggesting substantial (if only brief) losses in PE portfolios, many asset owners believe that their private investments have differentiated characteristics or are idiosyncratic enough that they weren’t so impaired. A prolonged drawdown in public equity markets, however, would reveal the true economic exposure of PE as a leveraged equity investment.
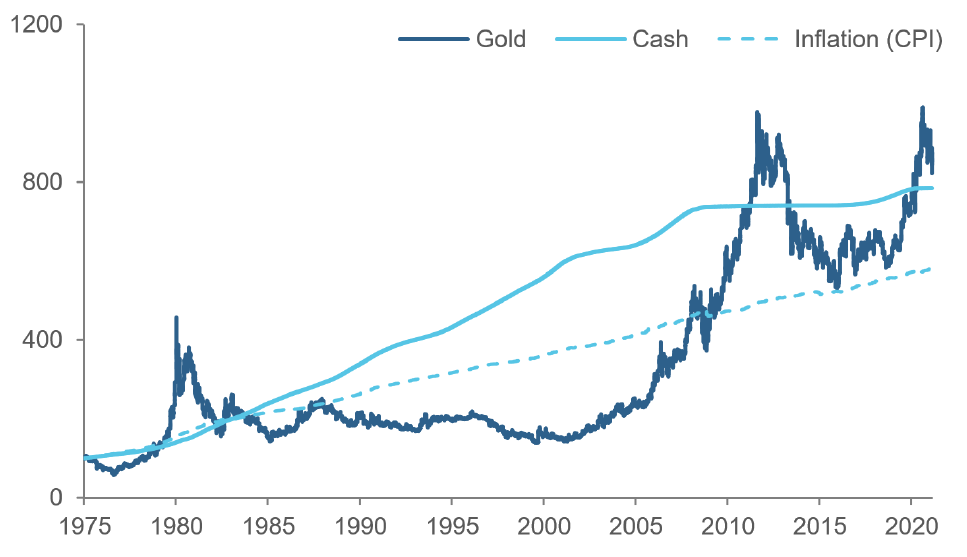
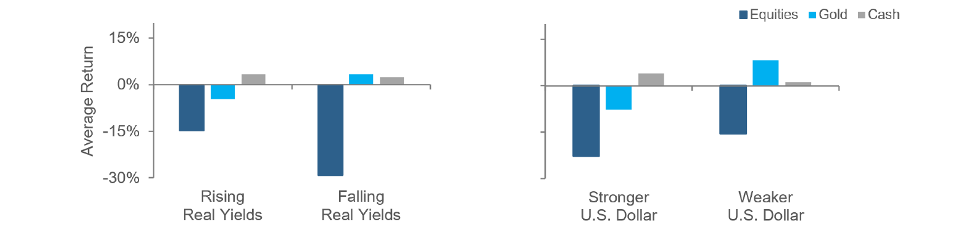
A third issue is that some alternatives to fixed income allocations present muddled (and sometimes even controversial) return-generating and risk-reduction characteristics. Gold offers a timely example, having gained the attention of investors who are concerned about rising inflation. We are skeptical that there is a long-term real return to holding gold, however. Empirically, in the post-Bretton Woods era, gold has outperformed cash by only 0.1% per annum. (Figure 7) Moreover, despite widespread perception of gold as a safe-haven asset, its relationship to equity risk is complicated. Because gold is a zero yielding asset —limited productive value, generates no earnings or income, roughly costless to store—its price responds to changes in real interest rates, which reflect the relative attractiveness of alternative investments. The left panel in Figure 8 shows why this matters: because gold has suffered losses during equity selloffs that have been accompanied by rising real yields. The initial stages of the March 2020 market crisis offer a recent example. Inflation expectations collapsed faster than the Fed cut rates. That caused real yields to spike, and gold prices plummeted 12.5% even as equities sold off 12.3%.8
Figure 7: Post-Bretton Woods Returns to Gold versus Cash and Inflation
Not only are gold's returns dependent on real interest rates, its reliability as an equity offset is also conditional on the behavior of the U.S. dollar, because gold is a dollar -dominated commodity. (Figure 8, right panel) These complexities do not imply that gold cannot function as a useful diversifier, however. Instead, gold’s role in the portfolio should be informed by its covariation with nominal rates, inflation, and the dollar, as opposed to an instinctive reliance on the metal as an all-weather or precision hedge.
Figure 8: Gold – Conditionally Defensive
Rethinking Fixed Income Replacements
A prerequisite for finding an appropriate fixed income replacement is clarity regarding the original allocation’s intended role in the portfolio. Investors can then seek strategies that map deliberately and precisely to risk reduction and return generation requirements as well as to priorities with respect to liquidity, capacity, and transparency.
We can provide a sense for how allocators should look for durable alternatives via the example of our systematic multi-asset absolute-return oriented process. The baseline intent of our strategy is to provide consistently positive returns with little directional asset class exposure, i.e., an “uncorrelated” investment as opposed to a hedge. To achieve that performance profile, we exploit diverse sources of alpha (i.e., mispricings) as opposed to harvesting a few broad risk premia across a wide range of assets globally—equities, bonds, volatility, currencies, and commodities. This requires building forecasting models for each distinct asset, including families of signals unique to individual commodities, like gold, so that we can fully capture the richness and dynamics of particular markets.
To precisely manage portfolio risk characteristics, we exploit the precision and flexibility of systematic portfolio construction. To create a return stream that is independent of equity drawdown risk and other material directional asset class exposures, we construct a highly diversified long-short multi-asset portfolio based on a formation process that is 1) informed by asset-level risk relationships both within and across asset classes —to neutralize both direct and indirect asset class exposures; 2) dynamic—reflecting changing risk conditions; and 3) tail-focused—to identify and control non-linear risk exposures.
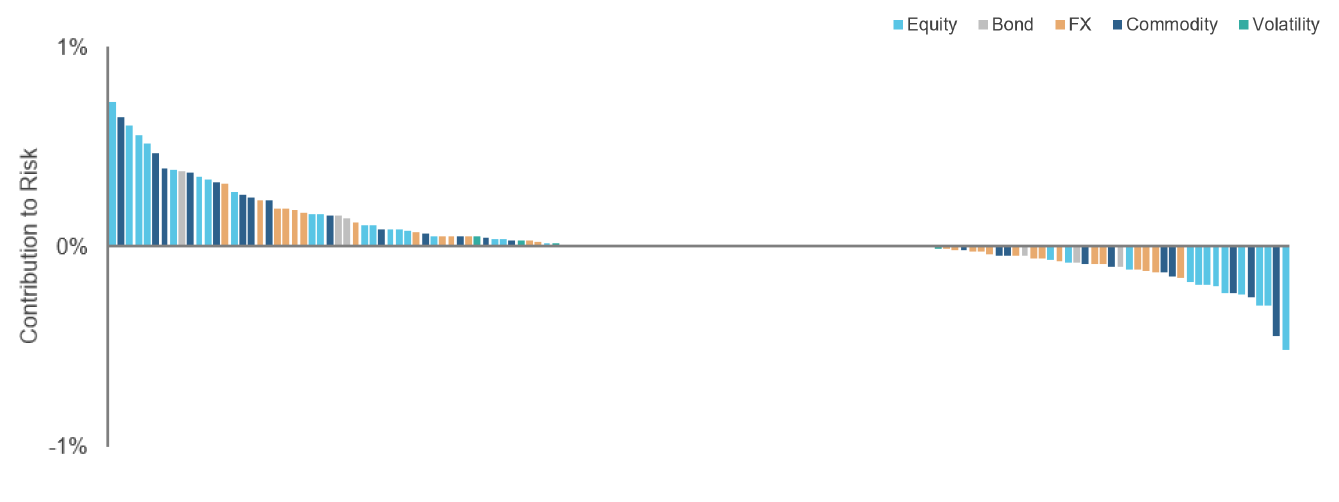
Figure 9 illustrates the breadth of the resulting positions as well as their modest and balanced contributions (positive and negative) to portfolio risk. We achieve liquidity by trading, principally, highly liquid listed futures, forwards and options while limiting position sizes based on stressed market conditions.
Figure 9: Contributions to Risk from Individual Asset Positions — An Acadian Multi-Asset Absolute Returns Portfolio
The approach has limitations, however, one being capacity: alpha is limited. For large asset owners, therefore, an approach like that described above can only serve as a partial solution, a “first stop” in replacing a material fixed income allocation. Principles underlying the investing approach, however, can inform evaluation of other strategies and allocation methods.
A second issue is complexity. A sophisticated investment process is, on the surface, harder to understand than a single asset, such as gold. But investors should not confuse complexity of the process that creates an investment with complexity of the return stream that it produces. Gold, while trivial to comprehend, has quite complex behavior. A well-designed and sophisticated investment process can produce a return stream that has much clearer and more reliable risk exposures. The failures of many alternative strategies to deliver return streams with claimed characteristics, however, speak to the value of transparency from managers in portfolio formation and ongoing monitoring of both process and portfolio behavior by investors.
Conclusion
The long-term decline of global interest rates has had an enormous impact on the investing landscape. It has provided fixed income investors both a tailwind to portfolio returns and an effective hedge to equity risk. It has also reshaped investors’ perceptions of the role that fixed income should play in portfolios. Looking ahead, given anemic sovereign yields, investors remain hard-pressed to find effective counterbalances to increasingly equity risk-centric holdings.
In considering what to do with their fixed income allocations, investors should be clear as to the economic functions that bonds have been serving in their portfolios. And in searching for alternatives, they should be sober about the challenge. The past 25 years are littered with examples of allocation methods and investment strategies that have failed to deliver on promises of diversification or stable return streams, often due to overlooked risk exposures. Investors should eschew complexity that obfuscates the economic drivers underlying performance, but they should also embrace process sophistication that produces alpha and minimizes unnecessary risks
Endnotes
- Furthermore, the chart shows that prior to 2000 cash provided better protection against equity drawdowns than bonds.
- Positive stock-bond co-movements spurred by inflationary expectations were more common pre-2000s under counter-cyclical inflationary
conditions. Please see Campbell JY, Pflueger C, Viceira LM. Macroeconomic Drivers of Bond and Equity Risks. Journal of Political Economy. 2020;128 (August) :3148-3185. - Starting yields largely drive expectations to duration-targeted approaches that are widely used to manage active and passive institutional bond portfolios. See Martin L. Leibowitz, Anthony Bova & Stanley Kogelman (2014) Long-Term Bond Returns under Duration Targeting, Financial Analysts Journal, 70:1, 31-51, DOI: 10.2469/faj.v70.n1.5.
- A more extreme version covers inflationary shocks that can result in greater capital losses, e.g., between 1965-80 investors in long-term U.S. bonds lost close to 30% in inflation-adjusted terms.
- Although the drop in rates has, by some measures, reduced the opportunity cost of hedging, it still remains material. Further, depending on how theput protection is specified, falling interest rates may increase the up-front cost, because option prices depend on the underlying’s forward price. Please contact us to discuss further.
- See "Re-examining Diversification: 20/20 Perspective,” Acadian, June 2020.
- Evidence suggests that over the long-term, aggregate private equity (buyout) returns – before fees -- can be largely replicated at lower cost
by a levered small-cap value portfolio. PE’s reported risk characteristics can be recovered by applying accounting smoothing and discretion.
See "Re-examining Diversification: 20/20 Perspective,” Acadian, June 2020 and Erik Stafford, “Replicating Private Equity with Value Investing,
Homemade Leverage, and Hold-to-Maturity Accounting,” Working Paper, December 2015. - See “Gold in Crisis,” Acadian, April 2020.
Hypothetical Legal Disclaimer
Acadian is providing hypothetical performance information for your review as we believe you have access to resources to independently analyze this information and have the financial expertise to understand the risks and limitations of the presentation of hypothetical performance. Please immediately advise if that is not the case.
Hypothetical performance results have many inherent limitations, some of which are described below. No representation is being made that any account will or is likely to achieve profits or losses similar to those shown. In fact, there are frequently sharp differences between hypothetical performance results and the actual performance results subsequently achieved by any particular trading program.
One of the limitations of hypothetical performance results is that they are generally prepared with the benefit of hindsight. In addition, hypothetical trading does not involve financial risk, and no hypothetical trading record can completely account for the impact of financial risk in actual trading. For example, the ability to withstand losses or to adhere to a particular trading program in spite of trading losses are material points which can also adversely affect actual trading results. There are numerous other factors related to the markets in general or to the implementation of any specific trading program which cannot be fully accounted for in the preparation of hypothetical performance results and all of which can adversely affect actual trading results.
Legal Disclaimer
These materials provided herein may contain material, non-public information within the meaning of the United States Federal Securities Laws with respect to Acadian Asset Management LLC, Acadian Asset Management Inc. and/or their respective subsidiaries and affiliated entities. The recipient of these materials agrees that it will not use any confidential information that may be contained herein to execute or recommend transactions in securities. The recipient further acknowledges that it is aware that United States Federal and State securities laws prohibit any person or entity who has material, non-public information about a publicly-traded company from purchasing or selling securities of such company, or from communicating such information to any other person or entity under circumstances in which it is reasonably foreseeable that such person or entity is likely to sell or purchase such securities.
Acadian provides this material as a general overview of the firm, our processes and our investment capabilities. It has been provided for informational purposes only. It does not constitute or form part of any offer to issue or sell, or any solicitation of any offer to subscribe or to purchase, shares, units or other interests in investments that may be referred to herein and must not be construed as investment or financial product advice. Acadian has not considered any reader's financial situation, objective or needs in providing the relevant information.
The value of investments may fall as well as rise and you may not get back your original investment. Past performance is not necessarily a guide to future performance or returns. Acadian has taken all reasonable care to ensure that the information contained in this material is accurate at the time of its distribution, no representation or warranty, express or implied, is made as to the accuracy, reliability or completeness of such information.
This material contains privileged and confidential information and is intended only for the recipient/s. Any distribution, reproduction or other use of this presentation by recipients is strictly prohibited. If you are not the intended recipient and this presentation has been sent or passed on to you in error, please contact us immediately. Confidentiality and privilege are not lost by this presentation having been sent or passed on to you in error.
Acadian’s quantitative investment process is supported by extensive proprietary computer code. Acadian’s researchers, software developers, and IT teams follow a structured design, development, testing, change control, and review processes during the development of its systems and the implementation within our investment process. These controls and their effectiveness are subject to regular internal reviews, at least annual independent review by our SOC1 auditor. However, despite these extensive controls it is possible that errors may occur in coding and within the investment process, as is the case with any complex software or data-driven model, and no guarantee or warranty can be provided that any quantitative investment model is completely free of errors. Any such errors could have a negative impact on investment results. We have in place control systems and processes which are intended to identify in a timely manner any such errors which would have a material impact on the investment process.
Acadian Asset Management LLC has wholly owned affiliates located in London, Singapore, and Sydney. Pursuant to the terms of service level agreements with each affiliate, employees of Acadian Asset Management LLC may provide certain services on behalf of each affiliate and employees of each affiliate may provide certain administrative services, including marketing and client service, on behalf of Acadian Asset Management LLC.
Acadian Asset Management LLC is registered as an investment adviser with the U.S. Securities and Exchange Commission. Registration of an investment adviser does not imply any level of skill or training.
Acadian Asset Management (Singapore) Pte Ltd, (Registration Number: 199902125D) is licensed by the Monetary Authority of Singapore. It is also registered as an investment adviser with the U.S. Securities and Exchange Commission.
Acadian Asset Management (Australia) Limited (ABN 41 114 200 127) is the holder of Australian financial services license number 291872 ("AFSL"). It is also registered as an investment adviser with the U.S. Securities and Exchange Commission. Under the terms of its AFSL, Acadian Asset Management (Australia) Limited is limited to providing the financial services under its license to wholesale clients only. This marketing material is not to be provided to retail clients.
Acadian Asset Management (UK) Limited is authorized and regulated by the Financial Conduct Authority ('the FCA') and is a limited liability company incorporated in England and Wales with company number 05644066. Acadian Asset Management (UK) Limited will only make this material available to Professional Clients and Eligible Counterparties as defined by the FCA under the Markets in Financial Instruments Directive, or to Qualified Investors in Switzerland as defined in the Collective Investment Schemes Act, as applicable.