
The whirlwind is upon us
It’s official: the world stock market is now as wild as it was during the tech-stock bubble. Since April 2026, we’ve had epic levels of return dispersion. AI excitement is driving extreme price moves, with some large-cap technology stocks up 50% to 100% in a single month. While it’s normal for small-cap stocks to sometimes rise 50% in a month, it’s not normal for the whole market to be meaningfully impacted by extreme winners. The chamber of dispersion has been opened, the beast of volatility has awakened, and the season of chaos is at hand.
Figure 1 shows monthly dispersion for the MSCI All Country World Index (ACWI) since January 1995, defined as the value-weighted cross-sectional standard deviation of monthly returns.[1]
Figure 1: Monthly return dispersion in ACWI
January 1995-May 2026
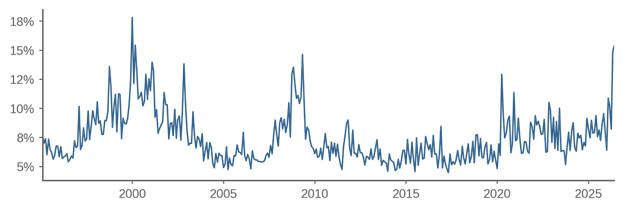
We see high dispersion in the tech-stock bubble as well as during times of market stress. In recent years, dispersion has been modest, but something really changed in April, with dispersion rising to historic levels. Table 1 shows the five highest dispersion months from January 1995 to May 2026. May and April of 2026 were extraordinary, ranking below only December 1999 and February 2000.
Table 1: Top months ranked by dispersion
January 1995 – May 2026 (377 months)
| Rank | Month | Dispersion |
|---|---|---|
| 1 | December 1999 | 18.2% |
| 2 | February 2000 | 15.9% |
| 3 | May 2026 | 15.6% |
| 4 | April 2026 | 15.0% |
| 5 | April 2009 | 14.8% |
| Average, 1995-2026 | 7.6% |
Today’s high value-weighted dispersion does not merely reflect the market’s high concentration into a small number of names. We’ve had high concentration for several years now, but the high dispersion is new.
One framework to understand recent dispersion is via common risk factors generating return covariation, as measured using stock-level characteristics such as country, sector, market beta, and momentum. In April and May 2026, the stocks that went up were U.S./Korean/Taiwanese technology stocks with high beta and high momentum. Thus, one view is that high realized stock dispersion is a byproduct of high realized factor volatility.
An alternative approach is to focus on individual stocks. Since market return is ∑wiRi, there are two ways that an individual stock can have a big impact on the market: either by having a big w or a big R. Much ink has been spilled on the topic of market concentration; that is, stocks with a big w. But today we see a different phenomenon: the market is being impacted by stocks with a huge R but only a modestly big w.
Table 2 shows the top five contributors to market return in May 2026. As you’d expect, the three largest stocks (Nvidia, Apple, and Microsoft) are on the list.[2] But also on the list are Micron and SK Hynix, both with beginning-of-month weights less than 1% but giant returns during the month. Of the total return of 5.2% for ACWI in May 2026, 0.9% came from Micron and SK Hynix; they generated 17% of the market’s return while having only 1.1% of market weight.
Table 2: Largest stock-level contributions to ACWI returns—May 2026
| Rank | Name | w | R | wR |
|---|---|---|---|---|
| 1 | Apple | 4.0% | +15.1% | 0.6% |
| 2 | Micron Technology | 0.6% | +87.8% | 0.5% |
| 3 | SK Hynix | 0.5% | +78.6% | 0.4% |
| 4 | Microsoft | 2.9% | +10.7% | 0.3% |
| 5 | Nvidia | 4.9% | +5.8% | 0.3% |
May 2026 was very unusual. Table 3 shows the five largest individual stock contributions to index returns (|wR|) over all history for stocks with weights less than 1%. Of the more than 800,000 stock-month observations, Micron and SK Hynix in May 2026 rank first and fourth.
Table 3: Largest stock-level contributions to ACWI returns—all months since 1995, stocks with weights <= 1%
Based on absolute value of the contributions (i.e., stocks with either positive or negative returns)
| Rank | Period | Name | w | R | wR |
|---|---|---|---|---|---|
| 1 | May 2026 | Micron Technology | 0.6% | +87.8% | +0.5% |
| 2 | October 2021 | Tesla | 1.0% | +43.7% | +0.4% |
| 3 | December 2024 | Broadcom | 0.9% | +43.4% | +0.4% |
| 4 | May 2026 | SK Hynix | 0.5% | +78.6% | +0.4% |
| 5 | February 2001 | EMC Corp | 0.8% | -46.4% | -0.4% |
What are the implications? First, let’s talk about bubbles. Back in March 2024, I said there was “no bubble yet” because dispersion was low:
Shiller (2005) describes the “gambler’s excitement” of bubbles, and you can’t have excitement unless prices are going up and down … Another aspect of bubble-related volatility is price dispersion, that is, some assets go up more than others. What happened in the U.S. in 2000 and 2021 was not that all assets went up, it was rather that some specific types of assets went up a lot, so that the return gap between winners and losers widened.
Well, dispersion isn’t low anymore. While dispersion is only a minor bubble symptom (I don’t include it in my Four Horseman of the Bubble Apocalypse), anytime you see the latest data looking a lot like 1999/2000, you’ve got to be concerned.
Next, consider the implications for active managers. On the one hand, you’d think dispersion would create opportunities to outperform. On the other hand, risk has gone up; if you’re a long-only manager benchmarked to ACWI and you didn’t hold Micron and SK Hynix in May 2026, you just underperformed your benchmark by 0.9%.
One possible implication of high dispersion is a change in asset manager behavior. According to Petajisto (2013):[3]
When dispersion increases, some managers reduce their active positions … because those positions just became more risky and the only way to prevent tracking error from increasing is to scale back active positions, but that action, in turn, pushes prices further away from fundamentals.
The concern is that we have a squeeze-like dynamic where chip stocks go up, which causes active managers who are underweight to buy them, which causes them to rise further.
It’s an open question whether recent dispersion reflects prices deviating from or converging to fundamentals. Dispersion was very high in December 1999 when many technology stocks soared. In hindsight, this dispersion was a deviation from fundamental value, and it eventually reversed when the bubble deflated. However, there’s no law of finance that says high dispersion produces reversals. An extreme case of one-day dispersion occurred on the announcement of a COVID vaccine on November 9, 2020 (“vaccine Monday”); Netflix and other “stay-at-home” stocks went down, Walt Disney and other reopening stocks went up. In the subsequent months, these moves were not reversed but instead continued. If the current dispersion comes from 1999-style speculation, we’d expect reversals; if it comes from 2020-style fundamental shocks, we’d expect continuations.
How long will the current market environment last? The high dispersion of December 1999 was followed by subsequent months of high dispersion as the market peaked in 2000 and then fell through 2001. So far in June 2026, we’ve continued to experience high daily return dispersion. The CBOE S&P 500 Dispersion Index, which is based on forward-looking options prices, is currently near all-time highs, indicating that value-weighted dispersion is expected to be elevated over the next month.
One thing’s for sure: high return dispersion tends to amplify performance dispersion across many dimensions including across different asset managers, across different strategies run by the same manager, and across different accounts run by the same manager using the same strategy. Whether today’s dispersion proves to be a bubble symptom, a rational repricing of AI fundamentals, or some unstable mixture of both, it’s a challenge that every market participant must confront.
Endnotes
[1] Value-weighted return dispersion in month t is 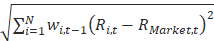 where w is the stock’s cap weight at the end of the prior month. Cross-sectional dispersion of stocks in the index is not the same as time-series volatility of index returns. While dispersion and market-wide volatility are positively correlated over time as an empirical matter, it is logically possible to have high dispersion even when the whole market is flat.
[2] References to this and other companies should not be interpreted as recommendations to buy or sell specific securities. Acadian and/or the author of this post may hold positions in one or more securities associated with these companies.
[3] Petajisto, Antti. "Active share and mutual fund performance." Financial Analysts Journal 69, no. 4 (2013): 73-93.
Don't miss the next Owenomics
Subscribe to receive new articles as they are published from Senior Portfolio Manager and Research, Owen Lamont
Legal Disclaimer
These materials provided herein may contain material, non-public information within the meaning of the United States Federal Securities Laws with respect to Acadian Asset Management LLC, Acadian Asset Management Inc. and/or their respective subsidiaries and affiliated entities. The recipient of these materials agrees that it will not use any confidential information that may be contained herein to execute or recommend transactions in securities. The recipient further acknowledges that it is aware that United States Federal and State securities laws prohibit any person or entity who has material, non-public information about a publicly-traded company from purchasing or selling securities of such company, or from communicating such information to any other person or entity under circumstances in which it is reasonably foreseeable that such person or entity is likely to sell or purchase such securities.
Acadian provides this material as a general overview of the firm, our processes and our investment capabilities. It has been provided for informational purposes only. It does not constitute or form part of any offer to issue or sell, or any solicitation of any offer to subscribe or to purchase, shares, units or other interests in investments that may be referred to herein and must not be construed as investment or financial product advice. Acadian has not considered any reader's financial situation, objective or needs in providing the relevant information.
The value of investments may fall as well as rise and you may not get back your original investment. Past performance is not necessarily a guide to future performance or returns. Acadian has taken all reasonable care to ensure that the information contained in this material is accurate at the time of its distribution, no representation or warranty, express or implied, is made as to the accuracy, reliability or completeness of such information.
This material contains privileged and confidential information and is intended only for the recipient/s. Any distribution, reproduction or other use of this presentation by recipients is strictly prohibited. If you are not the intended recipient and this presentation has been sent or passed on to you in error, please contact us immediately. Confidentiality and privilege are not lost by this presentation having been sent or passed on to you in error.
Acadian’s quantitative investment process is supported by extensive proprietary computer code. Acadian’s researchers, software developers, and IT teams follow a structured design, development, testing, change control, and review processes during the development of its systems and the implementation within our investment process. These controls and their effectiveness are subject to regular internal reviews, at least annual independent review by our SOC1 auditor. However, despite these extensive controls it is possible that errors may occur in coding and within the investment process, as is the case with any complex software or data-driven model, and no guarantee or warranty can be provided that any quantitative investment model is completely free of errors. Any such errors could have a negative impact on investment results. We have in place control systems and processes which are intended to identify in a timely manner any such errors which would have a material impact on the investment process.
Acadian Asset Management LLC has wholly owned affiliates located in London, Singapore, and Sydney. Pursuant to the terms of service level agreements with each affiliate, employees of Acadian Asset Management LLC may provide certain services on behalf of each affiliate and employees of each affiliate may provide certain administrative services, including marketing and client service, on behalf of Acadian Asset Management LLC.
Acadian Asset Management LLC is registered as an investment adviser with the U.S. Securities and Exchange Commission. Registration of an investment adviser does not imply any level of skill or training.
Acadian Asset Management (Singapore) Pte Ltd, (Registration Number: 199902125D) is licensed by the Monetary Authority of Singapore. It is also registered as an investment adviser with the U.S. Securities and Exchange Commission.
Acadian Asset Management (Australia) Limited (ABN 41 114 200 127) is the holder of Australian financial services license number 291872 ("AFSL"). It is also registered as an investment adviser with the U.S. Securities and Exchange Commission. Under the terms of its AFSL, Acadian Asset Management (Australia) Limited is limited to providing the financial services under its license to wholesale clients only. This marketing material is not to be provided to retail clients.
Acadian Asset Management (UK) Limited is authorized and regulated by the Financial Conduct Authority ('the FCA') and is a limited liability company incorporated in England and Wales with company number 05644066. Acadian Asset Management (UK) Limited will only make this material available to Professional Clients and Eligible Counterparties as defined by the FCA under the Markets in Financial Instruments Directive, or to Qualified Investors in Switzerland as defined in the Collective Investment Schemes Act, as applicable.
About the Author
