
Re-examining Diversification: 20/20 Perspective
Key Takeaways
- We advocate renewed commitment to diversification despite investor frustration with the performance of mainstream allocations and strategies meant to expand the sources of portfolio performance.
- We examine key reasons why many of those approaches failed to provide hoped-for benefits.
- Reflecting on those shortcomings, we emphasize three principles to help investors engineer diversification that can withstand a crisis.
Table of contents
Over the past year, diversification has faced two very different challenges. On the one hand, as stocks—and U.S. stocks in particular—continued to rally during 2019, we observed a growing undercurrent of dissatisfaction with diversification. In the past 25 years, investors have allocated to a variety of alternatives, including hedge funds, private markets, and real assets, in order to stabilize expected returns in an era of declining interest rates while limiting their public equity exposure. For many asset owners, however, that exercise met with disappointment when higher alternative allocations did not translate into better performance relative either to a traditional 60/40 portfolio or to their peers.
On the other hand, the violent selloff in Q1 2020 made clear that many investors had not diversified their portfolios as much as they had thought. While financial innovation has provided myriad new assets and strategies in which to invest, many of them largely repackage traditional sources of returns under new labels, often at higher cost and with greater opacity. As a result, in crisis conditions, they failed to deliver hoped-for benefits when they were most needed.
In this paper, we examine tensions around diversification. First, we reinforce the case for portfolio diversification in the context of the 2020 market environment. Second, we systematically examine flaws in popular allocations and strategies that are meant to diversify. Their shortcomings reflect the inherent difficulty in engineering diversification that can withstand a crisis. Embracing that challenge, we highlight three points of emphasis for the investment process: proper recognition and measurement of risk and return, embrace of expansive information and opportunity sets, and sophistication in portfolio construction. In the process, we offer contemporary examples relevant both to managing the aggregate portfolio and in selecting individual strategies.
Challenges to Diversification
One contemporary threat to diversification is fear of missing out. In recent years, investors have faced increasingly acute pressure to chase strong U.S. equity performance, because markets have repeatedly rewarded a “one-factor bet on growth.”1 To illustrate, Figure 1 shows that since the GFC, large-cap U.S. growth stocks have outperformed a wide range of other assets, including other equities, bonds, commodities, and currencies. Investors who have not been geared to this narrow market segment have underperformed, raising questions about the long-term viability of a host of allocations and strategies, including non-U.S., EM, and value stocks, as well as alternatives.
Figure 1: The Market’s “One-Factor Bet on Growth”
10-year average annualized excess returns, selected assets
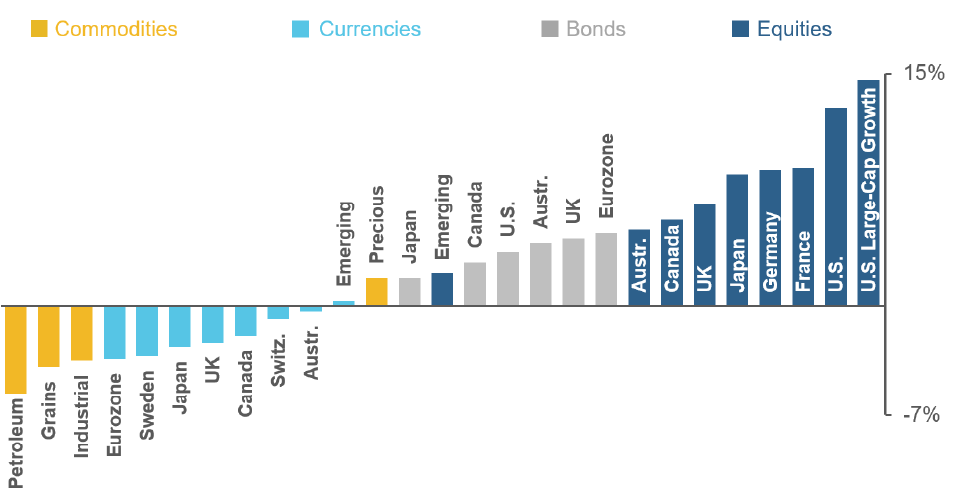
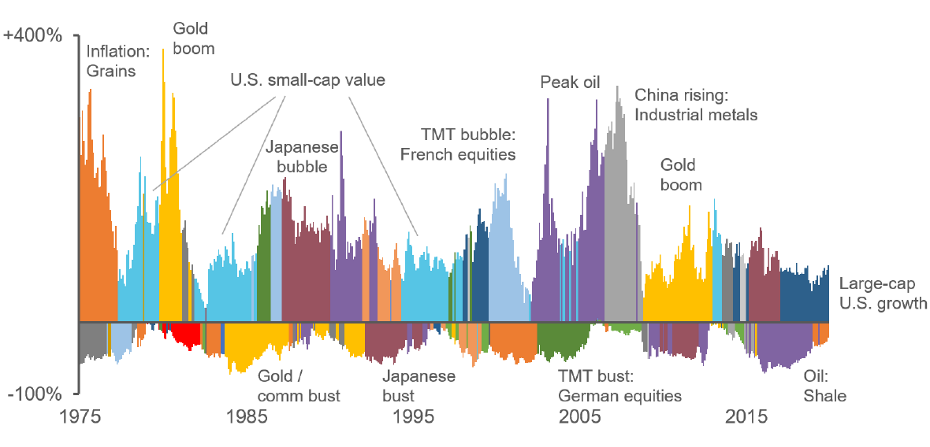
As we have discussed in prior research, the post- GFC outperformance of U.S. growth stocks is grounded in their fundamental success in recent years. Overextrapolation of that trend into doubts about the wisdom of diversification itself, however, reflects a natural behavioral mistake. Longer-term context offers compelling reminders of diversification’s evergreen relevance. Figure 2 provides a colorful illustration, showing best- and worst-performing assets over rolling four-year periods since the mid-1970s. From this perspective, the recent outperformance of large-cap growth does not look especially unusual in either duration or magnitude. Diverse assets, including commodities and other types of equities, have enjoyed periods of comparable success. Moreover, the chart reminds us that recent standouts may swiftly become underperformers as conditions change.
Figure 2: Risks of Chasing Past Performance
Best and worst performers (4-year rolling windows) in long-term historical context, selected assets
Optics versus Economics
A second challenge to diversification is that many popular alternative strategies and assets alter the optics of investors’ portfolios more than they change the economics. There are three primary reasons why. The first is that many purported diversifiers turn out to rely on a narrow set of conventional returns drivers. We can illustrate the problem through alternative risk premia strategies (ARPs) and hedge funds, which represent contrasting approaches to achieving the common goal of producing uncorrelated returns streams. Hedge funds ostensibly deliver skill-based performance through opaque, costly, and illiquid vehicles. ARPs reflect a premise that uncorrelated returns can be achieved by bundling together several diversified, non-traditional risk premia delivered through transparent, cheap, and liquid instruments.
Figure 3 shows that, despite the intent, many ARPs and hedge funds heavily rely on conventional performance drivers. The chart’s y-axis measures the percentage of a strategy’s returns variation that we can explain with just a few rudimentary factors: U.S. Treasuries, developed market equities, and generic implementations of equity value, momentum, and size.2
Figure 3: Alternatives’ reliance on conventional sources of return
Percentage of returns variation explained by DM equity market (plus eq. value, mom, size) and bonds
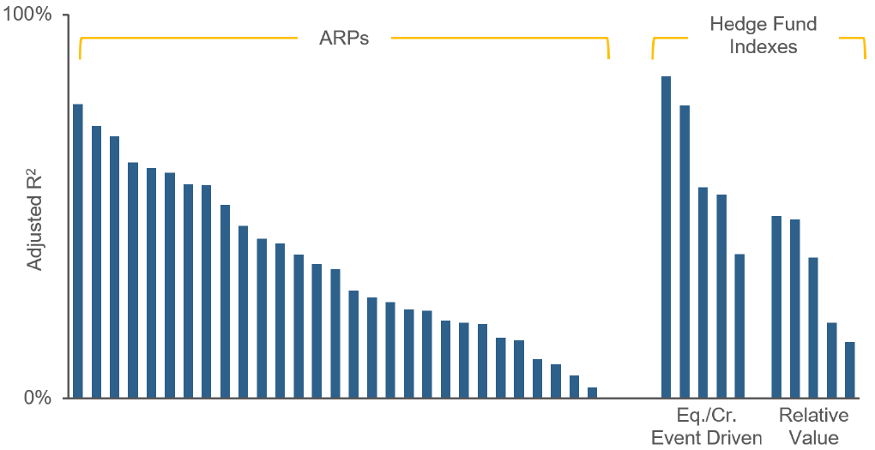
Among ARPs, we see considerable heterogeneity. Reassuringly, many strategies towards the right have returns that the simple attribution model cannot explain. But towards the left, we see several ARPs where the simple attribution model accounts for more than 50% of returns variation over time despite strategy descriptions alluding to low correlation with traditional asset classes, long/short construction, and cash-based benchmarks. Among selected hedge fund indexes, we again see strikingly high explanatory power, suggesting that event-driven and relative value styles deliver less idiosyncratic returns streams than many investors expect.
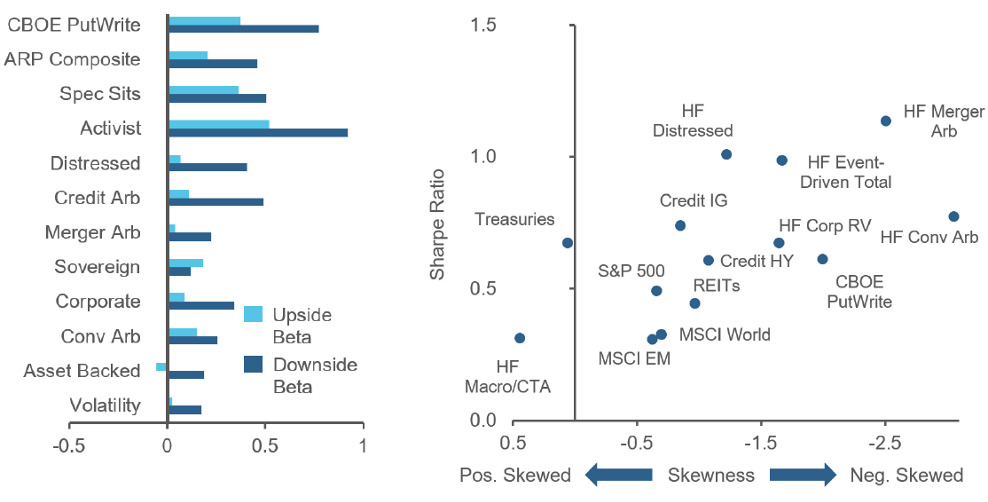
The second problem is that many alternatives display non-linear market exposure. As a result, they appear to diversify traditional asset classes under normal conditions but move in sync with them when markets are under stress. The left panel of Figure 4 provides a demonstration in the context of the ARPs and hedge fund indexes from the prior analysis. The chart shows that betas calculated over months when the equity market falls materially exceed those calculated when the equity market rises. This upside-downside asymmetry resembles the exposure generated by writing index put options, a strategy that amounts to underwriting insurance against market declines and in which the non-linear returns profile is an intrinsic design feature.
Figure 4: An insidious risk – non-linear market exposure
Upside and downside betas (left) and Sharpe Ratio versus skewness (right)
Sources: Acadian calculations based on data from Bloomberg (HFRI/X indexes, S&P 500, S&P U.S. Treasury Bond 710 Year, MSCI World and EM, CBOE S&P 500 PutWrite), Bloomberg Barclays (US IG and US HY Credit), eVestment (ARP data). Index sources: S&P Copyright (c) 2020, Standard & Poor’s Financial Services LLC. All rights reserved. MSCI Copyright MSCI 2020. All Rights Reserved. Unpublished. PROPRIETARY TO MSCI. The HFR indexes are aggregates of hedge fund returns collected and analyzed by Hedge Fund Research, Inc. Additional information may be available from HFR.
For illustrative and educational purposes only. It is not possible to invest directly in any index. Past results are not indicative of future results.
For ARPs, the analysis calls into question smart beta’s premise of generating a reliably differentiated returns stream by bundling together purportedly immutable and uncorrelated risk premia using simple and transparent methods. During a crisis, the premia may be revealed as compensation for different manifestations of the same risk.
For hedge funds, the analysis echoes prior research that suggests historical returns premia associated with many styles represent compensation for bearing non-linear downside risk rather than skill.3 The right panel of Figure 4 offers further evidence, showing that several of the hedge fund styles have generated higher Sharpe Ratios than cap-weighted equities but have also produced more negatively skewed returns. In other words, the market compensates for left tail exposure over and above day-to-day volatility.
These observations have several implications for strategy evaluation and selection. They highlight a flaw in the Sharpe Ratio as a standalone measure of risk-adjusted returns in that it adjusts for risk only using volatility, a metric that does not capture relative vulnerability to severe losses versus large gains. Failure to recognize skewness reflective of non-linear market exposure can lead to overallocation to crash risk. It can also lead to overpaying for a crash risk premium that could be accessed in simpler, more transparent ways.
The third problem is accounting-based smoothing and discretion. Distortions of reported returns afflict a broad range of investments, including private markets and real assets, with far-reaching consequences. Real estate provides a straightforward example. The right panel of Figure 5 shows that measured correlations between equities and NCREIF (National Council of Real Estate Fiduciaries) real estate benchmarks, both appraisal- (red) and transaction-based (light blue), are near zero, suggesting that real estate significantly diversifies traditional portfolios. Yet a mark-to-market real estate benchmark constructed by adjusting a broad cross-section of REITs for their embedded leverage and capital structure, evidences a much higher correlation, on the order of 0.7 (dark blue). The right panel of Figure 5 highlights the role of smoothing as a source of the discrepancy, showing the lagged response of appraisal and transaction-based benchmarks during the GFC. Moreover, during March 2020, the NCREIF appraisals-based index actually rose, a data point that likely doesn’t reflect economic reality.
Figure 5: Accounting distortions of reported returns – a real estate example
Comparison across appraisal-based, transaction-based, and mark-to-market benchmarks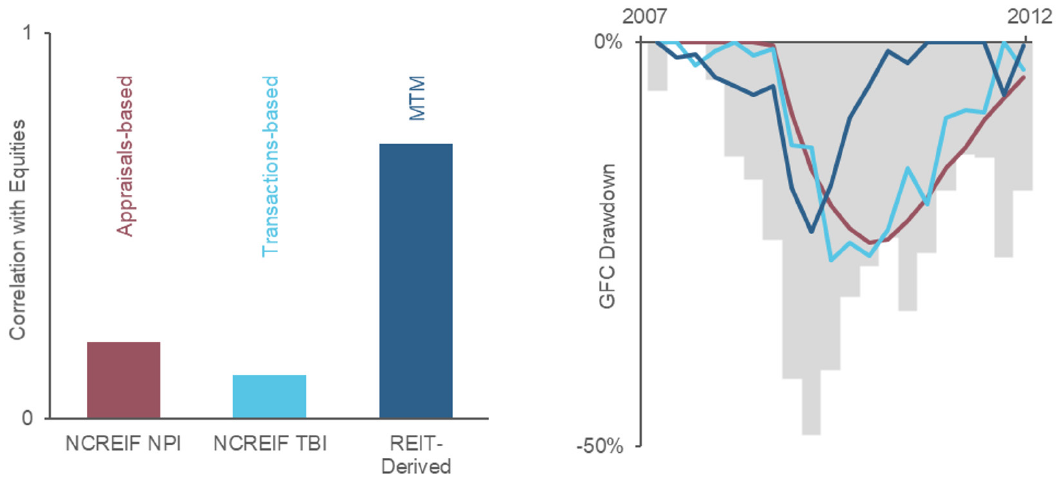
For private equity, too, crises create enormous uncertainty regarding valuations, and 2020 has been no exception.4 Similar to real estate, however, performance of a mark-to-market proxy, specifically the Red Rocks Global Listed Private Equity Index, which represents a diversified global portfolio of publicly traded PE firms, provides a real-time gauge of the market’s assessment. It indicates that there was significant economic damage, having dropped nearly 50% during the February-March 2020 selloff and still down about 20% YTD through May.
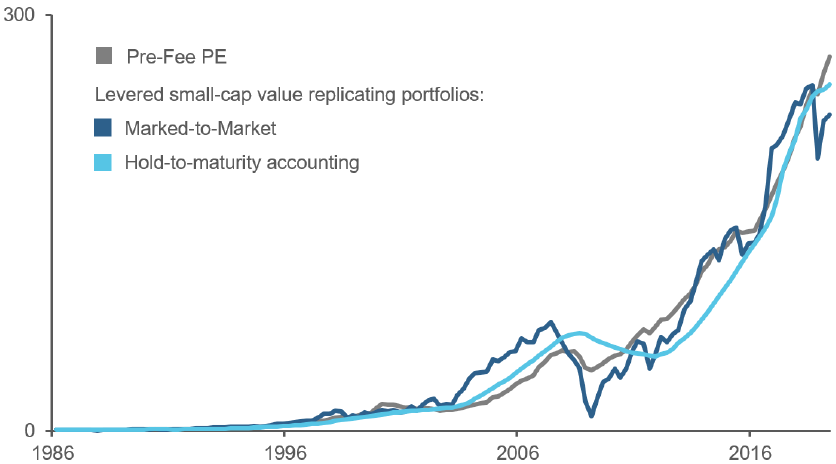
But reported private equity returns belie the asset class’s sensitivity to equity risk and feed misimpressions regarding the drivers of its performance. As demonstrated in Figure 6, we can largely replicate the long-term performance of an imputed pre-fee buyout benchmark (grey) with a hypothetical levered portfolio of publicly traded small-cap value stocks (dark blue).5 While the public replicating portfolio appears to have much higher volatility, a much higher quarterly beta, and much larger drawdowns than PE, we can recover PE-like risk characteristics simply by changing the accounting treatment. Specifically, if we value the holdings at cost until they are sold (light blue) rather than continuously marking them to market, then the replicating portfolio suddenly acquires PE’s smoothness, and its risk characteristics snap into line. This result also counters conventional wisdom that PE returns derive from an illiquidity premium, favorable financing terms, or skill-based improvements that are unique to private investments.
Figure 6: Replicating buyout private equity with levered small cap value stocks
Best Practices for Durable Diversification
That many popular alternative investments do not live up to investors’ expectations in diversifying the drivers of portfolio performance should come as no surprise. It reflects the difficulty of the challenge. Confronting their shortcomings, however, can help us achieve more enduring diversification. For asset owners, we would highlight three best practices in managing the aggregate portfolio and in selection of individual managers.
The first is proper recognition and measurement of risk and return. The prior section highlights the degree to which conventional market risk drives the performance of many alternative investments and the extent to which non-linear exposures and smoothing and discretion mask that relationship. For allocators, these are first order problems, whose consequences include unintended and concentrated risks, unnecessary portfolio complexity, and misspending of limited fee budgets.
Achieving clarity is not trivial, however. Analyses that provide a more comprehensive and accurate picture of performance, such as those employed in the prior section, require time, infrastructure, and expertise. Assessing tail risk poses special challenges owing to unavoidable data limitations. There is no single measure of tail risk that is appropriate or sufficient in all contexts, and the incorporation of tail risk metrics into portfolio construction may ratchet up complexity. Yet failure to embrace such challenges often generates hidden costs and latent risks.
The second point of emphasis is prioritization of expansive opportunity and information sets, in other words maximizing the breadth of resources available to diversify sources of return. With respect to the opportunity set, although the explicit purpose of many alternatives is to add assets to the portfolio, they often fail to fully exploit economically meaningful heterogeneity in and among asset classes. As an ironic example, multi-asset strategies often exclude commodities specifically because they are perceived as requiring specialized knowledge to invest in safely and profitably. Moreover, many strategies that invest in commodities do so monolithically, via multi-commodity indexes. Yet oils, softs, industrial metals, and precious metals display distinctive behaviors, owing to their diverse uses and markets. For investors willing to embrace the investment in expertise and data required to exploit commodities’ distinctiveness and heterogeneity, the asset class offers substantial diversification and returns generation potential.
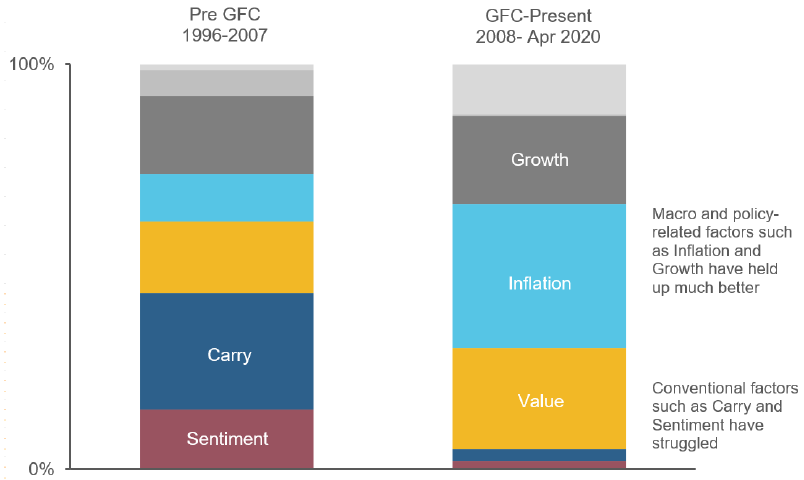
Reliance on narrow information sets is an equally serious problem. ARPs, for example, focus on capturing style premia, such as value, carry, and momentum, through simple and static implementations. They forgo macroeconomic signals, however, which makes them vulnerable to deterioration in performance resulting from shifts in macro and policy conditions. As a contemporary example in the context of currency investing across developed markets, Figure 7 shows that over the decade after the GFC, the efficacy of two classic style factors, carry and sentiment (momentum), collapsed, while the efficacy of macro signals, including growth and inflation, improved. One interpretation is that central banks became less tolerant of currencies’ divergences from policy objectives and targets, dampening non-fundamental drivers of their returns. The example highlights how expanding the information set by integrating style and macro perspectives, traditionally the focuses of two siloed investing approaches, contributes to performance durability.
Figure 7: Developed market currency cross-sectional signal efficacy
A third point of emphasis is the embrace of sophistication in portfolio construction. In diversifying sources of return, the extraction of maximal value from available information and opportunity sets requires careful engineering. Yet while the conceptual foundation of portfolio construction should be the methodical tradeoff of expected return in relation to forecasted risk and estimated implementation costs, reductive approaches are far more prevalent. Investors should scrutinize implicit assumptions and restrictions to understand the motivations and consequences. Investors should also look for approaches that have robust mechanisms to limit portfolio concentration in assets, geographies, and factors. While risk-based allocation frameworks and limits on individual position sizes are commonplace, they are also insufficient. Instead, portfolio formation also should be informed by cross-asset exposures, such as the equity beta of a position in volatility or in industrial metals. Making use of such information requires a holistic construction approach, as opposed to the more common method of fusing together portfolios formed independently within each included asset class.
The historic market volatility of 2020 has emphasized several additional valuable attributes of portfolio construction. They include dynamism in risk forecasting and explicit management of tail exposures. Despite lessons learned in past crises, including the GFC, the TMT bubble, and Ruble/LTCM, 2020 has produced additional examples of strategies that failed because position sizing was not sufficiently responsive to dramatic changes in the risk environment and/or tail risk was inadequately measured or governed. Moreover, the historic turbulence serves as a reminder that portfolio formation should not be based solely on backwards-looking risk inputs. It also should be informed by scenario analysis that incorporates a wide range of potential market outcomes, whether or not they have been historically observed. Doing so is particularly important when investments include non-linear and potentially explosive payoffs, such as certain volatility trading instruments.
Conclusion
The challenge of meeting ambitious returns targets while avoiding concentrations of risk has led asset owners to search for investments with economically differentiated performance. Unfortunately, durable diversification is hard to find. Many strategies that investors have turned to for diversification instead simply repackage conventional sources of return with new labels. While achieving meaningful and enduring diversification requires substantial investment and ongoing engagement, we believe the resources and effort are well worthwhile to avoid unintended and concentrated risk exposures, overpaying for conventional sources of performance, and unnecessary portfolio complexity.
Endnotes
- For an in-depth discussion of growth’s performance and the drivers, please see Returns to Value: A Nuanced Picture, Acadian Asset Management LLC, November 2019. Please visit our website for additional analysis.
- Specifically, the measure is the adjusted R2 from a linear regression that includes the listed factors.
- See Acadian Asset Management LLC, Crash Risk: Hedgers Versus Harvesters, November 2015 and Jurek, Jacob and Erik Stafford, The Cost of Capital for Alternative Investments, Journal of Finance 70, no. 5, (October 2015): 2185-2226.
- As an Institutional Investor article summarized on April 3rd, 2020: “General partners will like draw out markdowns over several months, leaving investors to make their own assumptions about the true value of their portfolios.”
- The analysis is derived from Stafford (2015). The portfolio has four key characteristics: 1) value stocks identified from bottom tercile stocks as ranked by price to cash earnings and equally weighted, 2) 48-month holding periods, 3) investments divided into monthly tranches for time diversification, 4) 2x target leverage. Please contact us for further details.
Hypothetical Legal Disclaimer
Acadian is providing hypothetical performance information for your review as we believe you have access to resources to independently analyze this information and have the financial expertise to understand the risks and limitations of the presentation of hypothetical performance. Please immediately advise if that is not the case.
Hypothetical performance results have many inherent limitations, some of which are described below. No representation is being made that any account will or is likely to achieve profits or losses similar to those shown. In fact, there are frequently sharp differences between hypothetical performance results and the actual performance results subsequently achieved by any particular trading program.
One of the limitations of hypothetical performance results is that they are generally prepared with the benefit of hindsight. In addition, hypothetical trading does not involve financial risk, and no hypothetical trading record can completely account for the impact of financial risk in actual trading. For example, the ability to withstand losses or to adhere to a particular trading program in spite of trading losses are material points which can also adversely affect actual trading results. There are numerous other factors related to the markets in general or to the implementation of any specific trading program which cannot be fully accounted for in the preparation of hypothetical performance results and all of which can adversely affect actual trading results.
Legal Disclaimer
These materials provided herein may contain material, non-public information within the meaning of the United States Federal Securities Laws with respect to Acadian Asset Management LLC, Acadian Asset Management Inc. and/or their respective subsidiaries and affiliated entities. The recipient of these materials agrees that it will not use any confidential information that may be contained herein to execute or recommend transactions in securities. The recipient further acknowledges that it is aware that United States Federal and State securities laws prohibit any person or entity who has material, non-public information about a publicly-traded company from purchasing or selling securities of such company, or from communicating such information to any other person or entity under circumstances in which it is reasonably foreseeable that such person or entity is likely to sell or purchase such securities.
Acadian provides this material as a general overview of the firm, our processes and our investment capabilities. It has been provided for informational purposes only. It does not constitute or form part of any offer to issue or sell, or any solicitation of any offer to subscribe or to purchase, shares, units or other interests in investments that may be referred to herein and must not be construed as investment or financial product advice. Acadian has not considered any reader's financial situation, objective or needs in providing the relevant information.
The value of investments may fall as well as rise and you may not get back your original investment. Past performance is not necessarily a guide to future performance or returns. Acadian has taken all reasonable care to ensure that the information contained in this material is accurate at the time of its distribution, no representation or warranty, express or implied, is made as to the accuracy, reliability or completeness of such information.
This material contains privileged and confidential information and is intended only for the recipient/s. Any distribution, reproduction or other use of this presentation by recipients is strictly prohibited. If you are not the intended recipient and this presentation has been sent or passed on to you in error, please contact us immediately. Confidentiality and privilege are not lost by this presentation having been sent or passed on to you in error.
Acadian’s quantitative investment process is supported by extensive proprietary computer code. Acadian’s researchers, software developers, and IT teams follow a structured design, development, testing, change control, and review processes during the development of its systems and the implementation within our investment process. These controls and their effectiveness are subject to regular internal reviews, at least annual independent review by our SOC1 auditor. However, despite these extensive controls it is possible that errors may occur in coding and within the investment process, as is the case with any complex software or data-driven model, and no guarantee or warranty can be provided that any quantitative investment model is completely free of errors. Any such errors could have a negative impact on investment results. We have in place control systems and processes which are intended to identify in a timely manner any such errors which would have a material impact on the investment process.
Acadian Asset Management LLC has wholly owned affiliates located in London, Singapore, and Sydney. Pursuant to the terms of service level agreements with each affiliate, employees of Acadian Asset Management LLC may provide certain services on behalf of each affiliate and employees of each affiliate may provide certain administrative services, including marketing and client service, on behalf of Acadian Asset Management LLC.
Acadian Asset Management LLC is registered as an investment adviser with the U.S. Securities and Exchange Commission. Registration of an investment adviser does not imply any level of skill or training.
Acadian Asset Management (Singapore) Pte Ltd, (Registration Number: 199902125D) is licensed by the Monetary Authority of Singapore. It is also registered as an investment adviser with the U.S. Securities and Exchange Commission.
Acadian Asset Management (Australia) Limited (ABN 41 114 200 127) is the holder of Australian financial services license number 291872 ("AFSL"). It is also registered as an investment adviser with the U.S. Securities and Exchange Commission. Under the terms of its AFSL, Acadian Asset Management (Australia) Limited is limited to providing the financial services under its license to wholesale clients only. This marketing material is not to be provided to retail clients.
Acadian Asset Management (UK) Limited is authorized and regulated by the Financial Conduct Authority ('the FCA') and is a limited liability company incorporated in England and Wales with company number 05644066. Acadian Asset Management (UK) Limited will only make this material available to Professional Clients and Eligible Counterparties as defined by the FCA under the Markets in Financial Instruments Directive, or to Qualified Investors in Switzerland as defined in the Collective Investment Schemes Act, as applicable.