
Crash Risk: Hedgers vs. Harvesters
Table of contents
Almost all investors hold significant crash exposure in their portfolios. While crashes are potentially devastating events, that very danger is also likely a major source of the risk premia that attract investors to equities and other risky assets in the first place. Modulating crash risk, therefore, ought to be a central focus of investment management. But crashes’ seemingly idiosyncratic character, the difficulty of empirical analysis involving extreme events, and agency conflicts often get in the way.
Crashes are hardly black swan events, however, and in this piece we advocate for conscious management of the risk despite the analytical and institutional challenges. For hedgers, we consider post-global financial crisis (GFC) approaches to crash risk mitigation, focusing on options. We discuss their unique benefits, impediments to their use, and factors that should play into their evaluation as an institution- or context-specific solution. We also consider popular alternatives to outright hedging, including risk parity and managed volatility. For investors seeking risk premia to harvest, we discuss underwriting crash insurance by selling options, contextualizing the size of the associated return premium, explaining its relationship to market structure, and speculating on the potential impact of the changing regulatory environment. Investors likely already hold crash exposure through a variety of strategies, and they should consider whether they might do so more efficiently by selling options or volatility directly. Product development that has broadened access to volatility trading strategies presages the need for active, market-informed, options-based approaches to harvesting premia.
Crashes: Their Nature and Significance
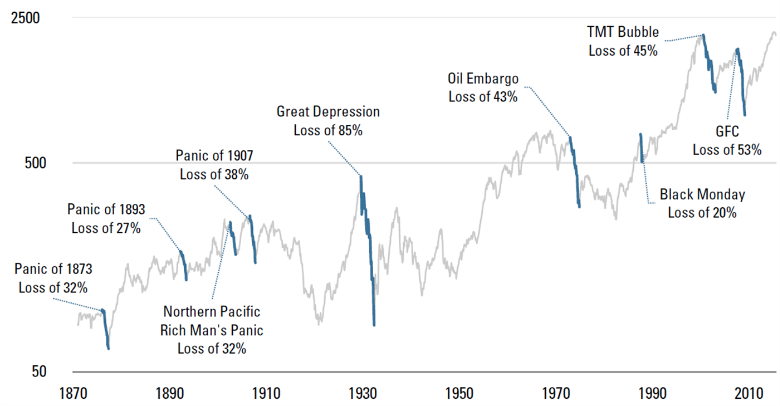
Though we may not want to admit it, crashes are not uncommon. While the best known include the GFC, 1987’s Black Monday, and the Great Depression, the U.S. equity market has long been punctuated by severe selloffs (Figure 1). This phenomenon is not limited to the U.S., nor to equities; for centuries, varied asset markets worldwide have suffered periodic crashes. The South Sea Bubble collapsed in 1720, Tulip Mania peaked in 1637, and there is evidence of debt crises in ancient Mesopotamia.1
Caused by deep-rooted investor behaviors and features of market-related institutions, crashes are frequently triggered by the bursting of financial bubbles. Brunnermeier and Oehmke (2012) point to a combination of factors that lead to such bubbles, including 1) new technologies or financial innovation that cause initially justifiable asset price increases, 2) financial market distortions such as overly cheap leverage or moral hazard (e.g., central bank “puts”), and 3) lack of data to benchmark fundamental valuations. Once a sell-off starts, margin calls and other funding pressures, herd behavior, and mechanical de-leveraging strategies may exacerbate declines.
Given such origins, it is not altogether surprising that we have not figured out how to prevent crashes. Deeply ingrained underlying pressures reappear in different forms as our markets and social and economic systems evolve. Measures aimed at preventing crashes often address only the most recently observed symptoms. Despite the creation of the U.S. Federal Reserve System in 1913, a raft of legislation from the Depression, and the implementation of market “circuit breakers” after Black Monday, we haven’t managed to eliminate sharp sell-offs and periods of enormous volatility, such as the “Flash Crash.”
Crashes’ destructive impact is apparent in Figure 1, which highlights the severity of peak-to-trough losses, losses that took years or even decades to recover. Unsurprisingly, the market seems to attach a significant premium to crash risk, as suggested by several recent academic studies. Bollerslev and Todorov (2011), for example, conclude that nearly two-thirds of the 8% postwar equity premium is attributable to “rare disaster events.”2
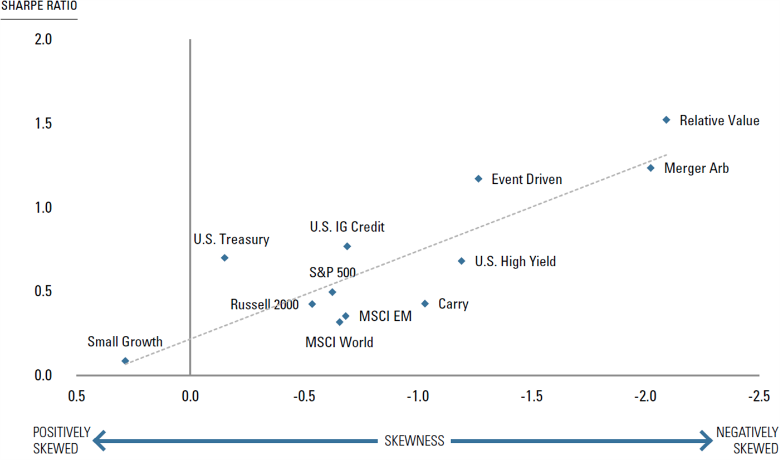
Evidence of a material crash risk premium extends beyond equity market benchmarks. Investors appear to demand incremental expected returns to participate in a variety of assets and strategies where they incur risk of infrequent but large losses. Figure 2 illustrates this, showing that for benchmarks representing a variety of equity styles, investment grade and high yield credit, as well as event driven, merger arb, and carry hedge fund strategies, more negative skews are associated with higher Sharpe ratios.3 This suggests that differences in returns across seemingly diverse strategies may boil down to their varied exposure to crashes.
To sum up, crashes are hardly black swan events. Investors would be wise to prepare for them and to recognize that they are likely the source of a substantial portion of risky assets’ expected returns. As a result, modulating crash risk should be a first-concern. For some this means hedging, and for others, it means harvesting associated risk premia. How much exposure do you want, and what is the most efficient and transparent way to obtain it?
Figure 1: U.S. Stock Market Crashes
Source: Robert Shiller online data, Yale School of Management For illustrative purposes only.
Figure 2: Sharpe Ratio Versus Skewness
Hedgers: Reducing Crash Risk, Post-GFC
Diversification has long been a central tenet of portfolio risk management. Heading into the GFC, new alternative investment strategies, markets, and asset classes seemed to expand opportunities to diversify. Strategies were crafted, securities priced, and leverage extended using assessments of interrelationships based on normal market conditions. But the GFC was a painful reminder that diversification does not always protect investors during an extreme selloff. Strategies that diverge in favorable market environments often exhibit greater systematic exposures and stronger interrelationships during a crash, undermining benefits of diversification precisely when they are needed most.
Given the lessons learned, how have asset owners tried to control crash risk?
Hedging
When attempting to reduce crash exposure, options immediately come to mind, because they are tools to re-shape the returns distribution. The canonical example of a crash hedge would be the purchase of a put struck below the index’s current level (“out-of-the-money”). The put establishes a floor under the underlying asset’s value below the strike price, transferring the risk to the option’s seller.
Options provide flexibility to tailor hedge exposure and financing. For example, the buyer of a put can also sell an upside call to trade off payment of up-front premium for a cap on participation in a rally. And today, investors have more hedging tools at their disposal than ever before. They can purchase exchange-listed options on non-equity asset classes, over-the-counter hedges linked to specific triggering events, and instruments that track market volatility and investor jitters.4 We’ve also seen the emergence of dedicated tail protection strategies that actively manage a portfolio of hedges, such as options on benchmark equity, currency, interest rate, and volatility instruments.
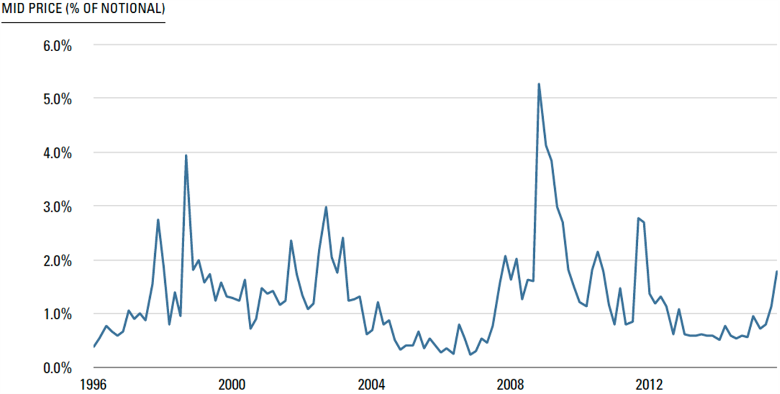
Despite such developments, the GFC has triggered much more discussion about hedging than actual activity. So why aren’t more investors hedging? A primary reason is cost. Crash protection tends to look expensive, and for systematic hedgers, funding fatigue is a constant concern. Figure 3a helps to illustrate this, showing the potential impact of systematically hedging by purchasing S&P 500 puts on a bi-monthly basis—in this case, roughly two-month options struck approximately 7.5% below the index’s level on the purchase date (“out-of-the-money”).
Although adding the put does indeed diminish the worst returns, reduce maximum drawdown, and make skewness slightly positive, the cost is high. The average (median) mid-market price of each two-month option is 1.3% (1.1%) of the amount hedged, and the impact on cumulative performance is substantial. Annualized average returns drop from 8.2% to 4.8%.5 This cost reflects a sizable risk premium in index option prices, which arises from the risks and frictions that dealers incur from selling the protection. (Please see the Appendix for further information about the volatility risk premium and how it relates to option market structure.6) In light of the evidence that a substantial portion of the equity premium compensates for “rare disasters,” the high cost of hedging them makes sense. Investors should expect to give up something material to reduce that risk.
Figure 3A: Systematically Hedging the S&P 500 With an Out-of-the-Money Put*
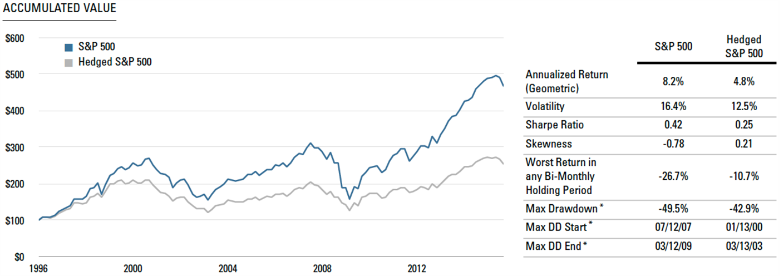
Figure 3B: Mid-Price of Puts as Percent of Notional Value Hedged
Complexity is a second factor that deters hedging. While it is relatively easy to reduce the up-front price of a hedge by sacrificing some measure of protection or by restructuring when and how the insurance is funded, it is much more difficult to find pricing distortions that allow for genuine cost reductions. For example, substituting a longer maturity option may appear cheaper than rolling shorter-dated options, but doing so may reduce hedge reactiveness. As well, new instruments, even listed VIX products, pose difficulties in evaluating a protection scheme, because we may have little information to gauge their liquidity or mark-to-market behavior in a crisis. Investors are rightly cautious, therefore, about complex or opaque strategies. They would be wise to question sources of purported cost savings from active hedging approaches.
Agency conflicts, behavioral biases, and ambiguities in crash risk assessment reinforce investor concerns about cost and complexity. Investment managers often see career risk to underperformance in good times but minimal benefit to outperformance when markets plunge. As a result, they have little incentive to pay premiums for crash insurance or to propose unfamiliar risk management solutions, including options, which could become a lightning rod for criticism. And if crash risk isn’t a natural focus of the ultimate asset owners, obtaining approval for a hedge may seem an insurmountable challenge given difficulties of evaluating crash risk and mitigation strategies. Despite their perhaps surprising frequency, crashes are still rare relative to the pace of change in markets and other relevant institutions, which poses many challenges for empirical analysis. We are often unsure what history is relevant. Crash risk metrics may be unstable. Backtests of risk mitigation strategies tend to be sensitive to assumptions.
If hedging is not a universally attractive, all-season approach, in what contexts might it make sense? Risk preferences should be a primary consideration. Options provide unique security for investors who need protection against market “gaps”—the risk that prices fall sharply before assets can be rebalanced—or to maintain their portfolio value above some floor, perhaps to guarantee short-term cash flow generation or funding status. The decision to hedge should also depend on the investment opportunity set. Investors may wish to pay up for protection if doing so allows for increased exposure to strategies or managers that they believe can generate alpha. The option pricing environment and the investor’s tactical outlook should also influence the decision. Figure 3b shows that the price of the puts from our hedging illustration varies considerably over time, hinting at a potentially significant role for a valuation component in hedge timing. In short, hedges may meet institution-specific needs or offer value in certain market environments.
Given impediments to hedging, what alternatives have investors turned to instead?
Alternatives to Hedging
One approach that has grown in popularity since the GFC is “adaptive risk budgeting,” with risk parity the most prominent example. Risk parity strategies allocate assets based on contributions to total risk budget as a means to improve diversification, and they target stable portfolio volatility over time. Risk controlled strategies could be viewed as a special case, algorithmically adjusting equity exposure relative to cash to maintain a target level of volatility.7
Adaptive risk budgeting strategies aim to allocate out of a particular asset class and/or reduce overall portfolio leverage as volatility rises, before outsized damage can be done. They may mechanically adjust allocations and leverage based on risk estimated from trailing asset volatilities and correlations.8 In doing so, they bear a relationship to portfolio insurance, which algorithmically seeks to reduce equity exposure as stock prices fall.9
Performance depends on several factors, including accuracy and responsiveness of empirically-derived volatility and correlation forecasts that determine allocations. Dynamic strategies are vulnerable to timing risks. They 1) may not protect against an initial market gap lower, before risk estimates can be updated and de-leveraging implemented, and 2) may remain underinvested as stocks rebound. Risk budgets and allocations determined based on asset correlations during normal market environments may overestimate a strategy’s diversification benefits in a crisis. Some risk parity strategies also lean on a belief that reducing allocation to equities and levering up exposures to lower risk assets, such as fixed income, will generate superior returns. Critics have challenged the unconditional validity of the hypothesis, for example, questioning the potential impact of a regime change in fixed income performance if the market enters a prolonged tightening cycle.
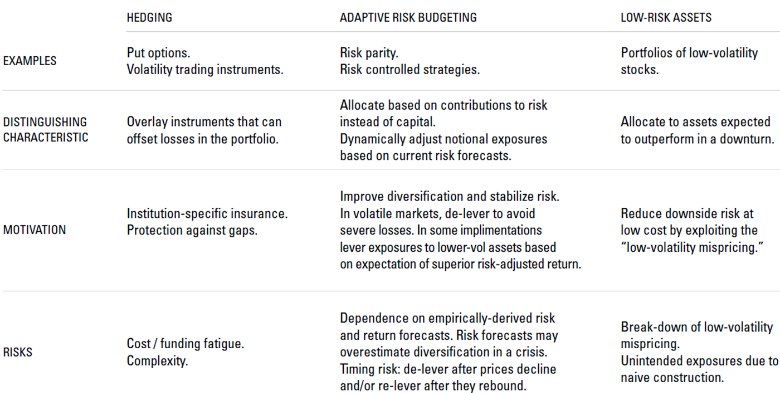
Another increasingly popular alternative is allocation to low-risk assets, explicitly choosing holdings to limit severity of loss in an acute market decline. The most straightforward example would be a strategic reallocation out of equities into Treasuries. Although some funds have taken this approach, the sacrifice of expected return is not universally acceptable.
As a result, many investors have turned to managed-volatility/low-volatility equity strategies, allocating to portfolios formed from low-beta or low-volatility stocks. Such strategies often are selected precisely on the belief that they will outperform in downturns, but they may benefit further by exposure to the “low volatility mispricing,” the empirical observation that low-beta stocks have, on average, outperformed, their CAPM expected returns. Low-volatility approaches have risks—low-volatility stocks might not outperform in an indiscriminate panic, and naive strategy implementations may bear unexpected exposures (e.g., to interest rates). Yet the hope of retaining much of the equity premium, over a market cycle, while mitigating downdrafts, is the basis for the strategy’s potential appeal relative to simply reducing equity allocation or paying for an explicit hedge.
Figure 4: A Comparison of Crash Risk Reduction Approaches
Harvesters: Efficient Crash Risk Exposure
Most investors already have substantial crash exposure through equities and other risky assets, and not all investors should be looking to reduce it. Some may wish to further embrace crash risk to harvest the associated return premium. This group might include investors with long horizons, minimal need to generate cash flow in the near-term, and supportive, sophisticated governance.
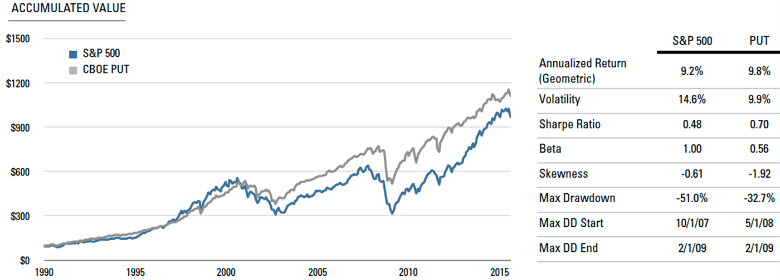
Just as buying puts provides a means to hedge crash risk, selling them provides a means to underwrite the insurance. The CBOE’s PutWrite Index (PUT) provides an illustrative example. It measures hypothetical performance from selling fully-collateralized, roughly one-month, at-the-money puts on the S&P 500. This put writing index has a beta of about 0.5, implying that the strategy should earn equity premium roughly consistent with a 50% de-levered long-stock position.10 But because the strategy sells options, it should also earn the premium that dealers charge for assuming short volatility exposure, the volatility risk premium (VRP).11 Figure 5 shows that over the past 25 years, the VRP has been large enough that, on average, the total return from selling downside insurance in this particular implementation has been similar to the compensation for holding stocks long. What’s more, PUT has exhibited lower volatility and, perhaps surprisingly, a smaller and shorter maximum drawdown. (Please see the Appendix for further discussion of the VRP and its origins.)
As we have discussed, investors who have sought to reduce equity exposure by diversifying into alternative strategies and asset classes may have unknowingly retained significant crash risk. Investors who have taken this approach should consider whether options might provide a more transparent and efficient means of obtaining crash risk exposure. Jurek and Stafford (2015) find that pre-fee hedge fund index alphas from a traditional market factor model can be largely explained by straightforward index put option selling strategies similar to the design of PUT, and there is additional evidence that a variety of hedge fund strategies “load” on selling equity volatility via options.12 Such analyses suggest that a range of alternative investment styles may derive returns through bearing varying degrees and forms of downside risk, and selling options might provide a comparatively efficient and transparent means of doing so.
Post-GFC, regulatory pressures on the global banks that function as upstairs options dealers may be diminishing liquidity supply, and this could impede the market for risk transfer. Bank prop trading activity, once a material supplementary liquidity pool, has been dramatically curtailed. Dealing desks themselves are subject to new constraints, such as stress tests for crash scenarios and limits on risk-weighted assets. Some option traders claim that these restrictions have raised crash insurance prices and are changing the mix of product that dealers are willing to sell. There may be signs of such strains in options implied volatility “skew,” and other markets provide corroborating evidence.13
While dampened risk taking on the part of banks may pose a challenge for hedgers, it might also provide opportunity for investors seeking rich risk premia to harvest. To the extent that dealers retreat from providing crash hedge liquidity, related volatility selling premia may expand. In other words, regulatory pressures might make arguably efficient option-based methods of harvesting crash risk premia even more attractive.
At the same time, some of the new instruments that have made it easier for investors to hedge have also made it easier to underwrite protection (e.g., inverse VIX exchange traded products), which could offset regulatory pressures on the VRP and change its dynamics. Strategies aiming to capture premia from options selling should be informed by evolving market structure.
Figure 5: A Simple Way to Sell Insurance
Conclusion
Crashes are not only of abstract, historical, or occasional importance. Most investors have substantial exposure to crash risk, and a premium associated with it is probably a significant determinant of their long-run portfolio performance. In evaluating new strategies, investors should carefully examine whether superior performance simply reflects substantial crash exposure combined with an inadequate risk measure. Despite the analytical challenges that assessing crash risk presents, investors should consciously evaluate and modulate it.
For those who wish to reduce exposure, options-based hedges may offer unique protections and considerable flexibility. But cost, complexity, and manager incentives make them unlikely as a universal, all-season insurance approach. Investors should carefully scrutinize active hedging approaches that claim material cost savings; it is easier to reduce cost by sacrificing protection or limiting upside than it is to find a pricing anomaly or market inefficiency. Despite the obstacles, hedges may meet the needs of certain institutions or look attractive in certain market environments. The decision to hedge should depend on risk preferences, the investment opportunity set, and pricing. Alternative risk mitigation approaches, such as adaptive risk budgeting and low-volatility strategies, have become popular in the hope that they will afford some measure of protection without significantly reducing expected returns, but naïve implementations have risks.
For those seeking risk premia to harvest, underwriting insurance by selling options may appeal to investors with appropriate risk preferences and strong governance. More broadly, investors should consider how much crash risk they hold through the various diversifying strategies in their portfolios, including hedge funds and other alternatives, and whether options might provide a more efficient and transparent means of obtaining that exposure. Regulation may be diminishing traditional sources of liquidity supply for crash insurance, which might increase compensation associated with selling options. Yet product development that has broadened access to volatility trading strategies also suggests that, increasingly, options-based premium harvesting strategies should be active and market-informed.
Appendix: The Volatility Risk Premium and Options Market Structure
The options market is a mechanism for risk redistribution. But it is not a matching engine. In other words, it does not simply connect investors looking to hedge and underwrite the same risk in similar quantities. And intermediaries do not tend to “go home flat” at the end of the day.
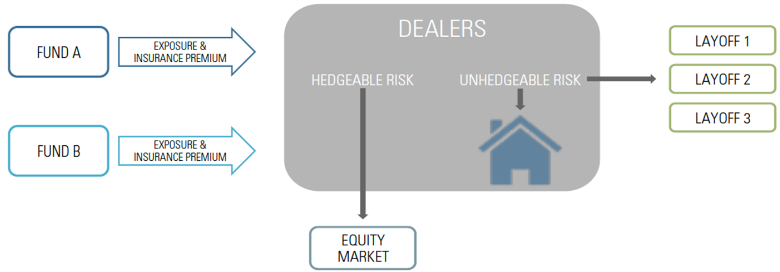
Instead, Figure A more accurately represents how the market functions, from the standpoint of hedging activity. Hedgers obtain protection from upstairs derivatives dealers. These dealer desks take on complex risk exposures from a wide range of activities involving a variety of counterparties including pension funds and endowments, institutional asset managers, hedge funds, and retail investors. They break down the risk generated through these transactions into components, some of which the dealers can fairly easily neutralize in the market. But dealers also take on forms of risk that are difficult to hedge. These include exposures to changing levels of volatility and price gaps. Flows generally do not net out in terms of these difficult-to-hedge risks, so dealers shop accumulated excess exposures to hedge funds and other “layoff” accounts willing to take them on. But dealers have historically warehoused substantial risk and charged a premium for doing so. This risk premium is embedded in hedge pricing.
Figure A: How the Options Market Redistributes Risk*
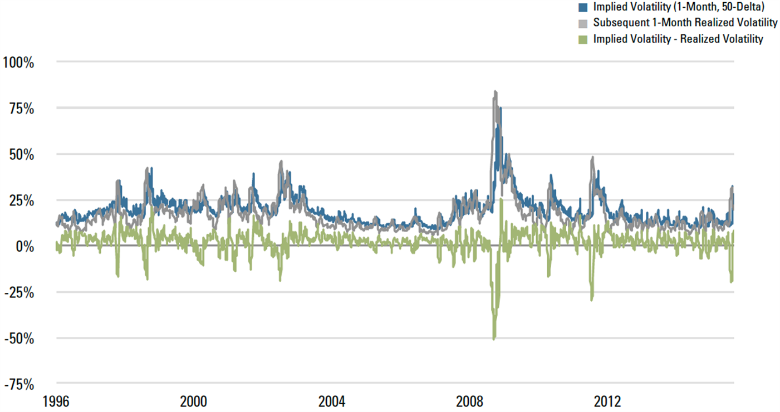
One measure of the risk premium is shown in Figure B, which compares S&P 500 1-month, at-the-money implied volatility and subsequent 1-month realized volatility.14 Implied volatilities are a key input into option prices – the higher the implied volatility, the higher the price of either a put or a call. S&P 500 Index mid-market implied volatility for this maturity and strike tends to trade above subsequent 1 month realized volatility, on average by nearly 2 volatility points, roughly 19% versus 17%.15
Option pricing theory suggests that in the absence of a risk premium, the price of an option should reflect the expected cost to hedge it, which depends on the dealer’s forecast of index volatility over the life of the option. That index implied volatilities are biased high relative to realized volatility reflects the risk premium for selling volatility via options – if volatility rises or if the underlying moves sharply, a dealer that has sold an option likely will lose money. The size of the risk premium depends on option supply and demand dynamics, which we would expect to differ depending on the underlying asset, option strike and expiry, and market conditions. The options pricing environment is highly varied and continues to evolve. Please contact us to discuss it in further detail.
Figure B: The Volatility Risk Premium - S&P 500 Index
Endnotes
- For an overview of the history and causes of crashes, see Markus Brunnermeier and Oehmke, Martin, “Bubbles, Financial Crises, and Systematic Risk,” Princeton University Economic Theory Center, Research Paper No. 47, (June 6, 2012). Day (2004) discusses the role of financial innovation—along with Black Plague, aphids, and the threat of invasion—in Tulip Mania. Christian Day, “Is there a Tulip in Your Future? Ruminations on Tulip Mania and the Innovative Dutch Futures Markets,” Journal des Economistes et des Etudes Humaines, Volume 14, No. 2, (December 2004): 151-170. Frehen et al (2012) find evidence that developments in global trade and financial innovation were major factors driving the South Sea Bubble. Rik Frehen, Goetzmann, William and Rouwenhorst, Geert, “New Evidence on the First Financial Bubble,” Yale ICF Working Paper No. 09-04, (July 27, 2012).
- Tim Bollerslev and Todorov, Viktor, “Tails, Fears and Risk Premia,” The Journal of Finance, Volume 66, Issue 6, (Dec. 2011): 2165-2211. Other studies that provide evidence for the materiality of crash risk’s contribution to the equity premium include Pedro Santa-Clara and Yan, Shu, “Crashes, Volatility, and the Equity Premium: Lessons from S&P 500 Options,” The Review of Economics and Statistics, 92(2), (May 2010): 435-451; Robert Barro, “Rare Disasters and Asset Markets in the 20th Century,” The Quarterly Journal of Economics, 121, no. 3, (August 2006): 823-866; and Mark Broadie, Chernov, Mikhail, and Johannes, Michael, “Understanding Index Option Returns,” Review of Financial Studies, Volume 22, Issue 11, (2009). 4493-4529.
- Roughly speaking, a returns distribution that exhibits higher probability of large losses than large gains would be called negatively skewed. Sharpe ratio is a measure of risk-adjusted returns where the selected measure of risk, standard deviation, provides no information about the asymmetry of the returns distribution.
- There are optionable ETFs on currency, fixed income, and commodity underlyings. Variance swaps and listed VIX futures and options allow for expression of views on future realized volatility and implied volatilities. An example of an OTC instrument with a specific trigger would be an equity index put with a payoff that is contingent on rising interest rates.
- Another informative comparison to hedge performance would be a version of the index that is de-levered by the initial delta of each put purchased. Please contact us for further information.
- There is a considerable academic literature on this topic. See, for example, Peter Carr and Wu, Liuren, “Variance Risk Premiums,” The Review of Financial Studies, Volume 22, Issue 3, (2009): 1311-1341.
- Risk controlled strategies are popular among life insurance companies, which incorporate them into variable annuity products. Embedded optionality based on volatility controlled underlyings may be better aligned with industry risk management tests and cheaper for the issuer to hedge than if based on plain vanilla equity indexes.
- Risk controlled indices typically attempt to deliver constant volatility of daily returns and may be parameterized to reduce equity exposure quickly in the event of a market shock. Volatility and correlation estimates embedded in risk parity may reflect a longer-horizon view than those reflected in risk-controlled strategies. Risk parity may also rebalance less frequently and employ more sophistication or discretion in risk forecasting and rebalancing.
- The violent market movements in late August 2015 generated debate over whether such strategies might have exacerbated sell-offs and market volatility via a feedback loop in which the sharp market drop induced price-insensitive mechanical de-leveraging that pushed stocks down further. Please contact us to discuss in detail.
- This is consistent with selling puts struck near-the-money, i.e., approximately 50-delta options.
- The seller (buyer) of an option, whether a put or a call, is short (long) volatility.
- Jurek, Jacob and Erik Stafford, “The Cost of Capital for Alternative Investments,” Journal of Finance 70, no. 5, (October, 2015): 2185-2226. Bondarenko (2004) finds that hedge fund indices representing a variety of strategies have statistically significant loadings on returns streams derived from selling index variance swaps and that inclusion of the variance selling factor tends to reduce alpha relative to a traditional single factor model. Oleg Bondarenko, “Market Price of Variance Risk and Performance of Hedge Funds,” AFA 2006 Boston Meetings Paper, (March 2004).
- See, for example, Bost, Callie “It’s Getting Expensive to be a Bear as Rules Pinch Options,” Bloomberg Business, April 13, 2015.Web. For a discussion of Basel III balance sheet constraints on equity repo markets, which affect pricing of futures and other synthetic long/short positions, see Omprakash, Anand. “New Normal in Equity Repo.” Risk Management no. 29 (Mar. 2014): 20-23. Canadian Institute of Actuaries, Web. There has been considerable discussion of the impact of regulation on bond markets. See, for example, McGrane, Victoria. “Fed’s Powell: Financial Regulation May Contribute to Decline in Bond-Market Liquidity” The Wall Street Journal, June 23, 2015. For discussion of the impact of regulation on banks’ risk appetite during the turmoil that started in late August, 2015, see Baer, Justin, James Sterngold, and Gregory Zuckerman, “Market Bets Abound, but Where Are the Banks?” The Wall Street Journal, Sept. 2, 2015.
- Here, at-the-money is defined as 50-delta, and realized volatility is calculated using several conventions typical of short-dated variance swaps, e.g., 21-trading day window, zero mean, 252-day annualization factor.
- Using historical variance swap quotes, or approximations thereof, likely would show an even larger difference. The VIX, whose calculation methodology is related to variance swap replication, averages 4 vol points higher than subsequent realized volatility over the same period. The difference arises in part because, in theory, variance swap prices should reflect unconditional expectations of future volatility over all possible price paths, whereas a particular option’s implied volatility should largely reflect expectations of volatility over price paths “near” the option’s strike price. Variance swaps also have convex exposure to volatility, which should be reflected in pricing. Please contact us to for further information regarding interpretation of implied volatilities, variance swap levels, and the VRP.
Hypothetical Legal Disclaimer
Acadian is providing hypothetical performance information for your review as we believe you have access to resources to independently analyze this information and have the financial expertise to understand the risks and limitations of the presentation of hypothetical performance. Please immediately advise if that is not the case.
Hypothetical performance results have many inherent limitations, some of which are described below. No representation is being made that any account will or is likely to achieve profits or losses similar to those shown. In fact, there are frequently sharp differences between hypothetical performance results and the actual performance results subsequently achieved by any particular trading program.
One of the limitations of hypothetical performance results is that they are generally prepared with the benefit of hindsight. In addition, hypothetical trading does not involve financial risk, and no hypothetical trading record can completely account for the impact of financial risk in actual trading. For example, the ability to withstand losses or to adhere to a particular trading program in spite of trading losses are material points which can also adversely affect actual trading results. There are numerous other factors related to the markets in general or to the implementation of any specific trading program which cannot be fully accounted for in the preparation of hypothetical performance results and all of which can adversely affect actual trading results.
Legal Disclaimer
These materials provided herein may contain material, non-public information within the meaning of the United States Federal Securities Laws with respect to Acadian Asset Management LLC, Acadian Asset Management Inc. and/or their respective subsidiaries and affiliated entities. The recipient of these materials agrees that it will not use any confidential information that may be contained herein to execute or recommend transactions in securities. The recipient further acknowledges that it is aware that United States Federal and State securities laws prohibit any person or entity who has material, non-public information about a publicly-traded company from purchasing or selling securities of such company, or from communicating such information to any other person or entity under circumstances in which it is reasonably foreseeable that such person or entity is likely to sell or purchase such securities.
Acadian provides this material as a general overview of the firm, our processes and our investment capabilities. It has been provided for informational purposes only. It does not constitute or form part of any offer to issue or sell, or any solicitation of any offer to subscribe or to purchase, shares, units or other interests in investments that may be referred to herein and must not be construed as investment or financial product advice. Acadian has not considered any reader's financial situation, objective or needs in providing the relevant information.
The value of investments may fall as well as rise and you may not get back your original investment. Past performance is not necessarily a guide to future performance or returns. Acadian has taken all reasonable care to ensure that the information contained in this material is accurate at the time of its distribution, no representation or warranty, express or implied, is made as to the accuracy, reliability or completeness of such information.
This material contains privileged and confidential information and is intended only for the recipient/s. Any distribution, reproduction or other use of this presentation by recipients is strictly prohibited. If you are not the intended recipient and this presentation has been sent or passed on to you in error, please contact us immediately. Confidentiality and privilege are not lost by this presentation having been sent or passed on to you in error.
Acadian’s quantitative investment process is supported by extensive proprietary computer code. Acadian’s researchers, software developers, and IT teams follow a structured design, development, testing, change control, and review processes during the development of its systems and the implementation within our investment process. These controls and their effectiveness are subject to regular internal reviews, at least annual independent review by our SOC1 auditor. However, despite these extensive controls it is possible that errors may occur in coding and within the investment process, as is the case with any complex software or data-driven model, and no guarantee or warranty can be provided that any quantitative investment model is completely free of errors. Any such errors could have a negative impact on investment results. We have in place control systems and processes which are intended to identify in a timely manner any such errors which would have a material impact on the investment process.
Acadian Asset Management LLC has wholly owned affiliates located in London, Singapore, and Sydney. Pursuant to the terms of service level agreements with each affiliate, employees of Acadian Asset Management LLC may provide certain services on behalf of each affiliate and employees of each affiliate may provide certain administrative services, including marketing and client service, on behalf of Acadian Asset Management LLC.
Acadian Asset Management LLC is registered as an investment adviser with the U.S. Securities and Exchange Commission. Registration of an investment adviser does not imply any level of skill or training.
Acadian Asset Management (Singapore) Pte Ltd, (Registration Number: 199902125D) is licensed by the Monetary Authority of Singapore. It is also registered as an investment adviser with the U.S. Securities and Exchange Commission.
Acadian Asset Management (Australia) Limited (ABN 41 114 200 127) is the holder of Australian financial services license number 291872 ("AFSL"). It is also registered as an investment adviser with the U.S. Securities and Exchange Commission. Under the terms of its AFSL, Acadian Asset Management (Australia) Limited is limited to providing the financial services under its license to wholesale clients only. This marketing material is not to be provided to retail clients.
Acadian Asset Management (UK) Limited is authorized and regulated by the Financial Conduct Authority ('the FCA') and is a limited liability company incorporated in England and Wales with company number 05644066. Acadian Asset Management (UK) Limited will only make this material available to Professional Clients and Eligible Counterparties as defined by the FCA under the Markets in Financial Instruments Directive, or to Qualified Investors in Switzerland as defined in the Collective Investment Schemes Act, as applicable.