
Returns to Value: A Nuanced Picture
Key Takeaways
- Although by certain measures value has performed poorly for more than a decade, there has been greater variation in efficacy across formulations, regions, and market segments than conventional narratives would suggest.
- Macroeconomic conditions, market sentiment, and changing economic structure and corporate accounting practices help to explain different aspects of value’s performance that inform the outlook going forward.
Table of contents
The underperformance of value has become one of the most prevalent narratives in investing. Indeed, by certain measures value has performed poorly for more than a decade and particularly so over the past few years. But value is implemented in innumerable ways that generate materially different investment outcomes; conventional narratives don’t fully capture consequential variation across formulations as well as regions and market segments. Their oversimplification has clouded understanding of the factors that have been driving value’s performance and assessment of the outlook.
This paper provides a more nuanced picture of value’s performance, as seen from Acadian’s perspective. We start by documenting salient patterns in returns to value: 1) Value has retained greater efficacy in less efficient areas of the market, including outside of the U.S. and among smaller-cap stocks. 2) Incomebased value signals have held up better than assetbased implementations, whose performance woes have been more protracted. 3) Refined implementations have outperformed generic versions.
We then consider what has driven value’s performance, focusing on the U.S., which has been a particularly challenging market for value investors and holds keys to understanding the global picture. We show that macroeconomic conditions help to explain value’s weakness since 2007, and that evolving market sentiment has contributed to value’s broader and more acute deterioration since 2017. We also link investors’ preference for glamour stocks to changes in the structure of the economy and corporate balance sheet management practices that also help to explain the more protracted and severe underperformance of asset-based versus income-based value approaches.
Clearer understanding of value’s recent performance is of more than historical or academic importance. It informs our outlook for and helps to illuminate Acadian’s approach to value investing, topics that we discuss in two complementary papers, “The Outlook for Value” and “Acadian’s Approach to Value Investing.”
Value’s Performance: A Closer Look
Figure 1 encapsulates conventional impressions of value’s struggles since the GFC. The chart traces out past performance trajectories of the ubiquitous FamaFrench “HML” factor, which represents a simple U.S. long-short B/P-based value-minus-glamour portfolio, over twelve-year periods since July 1926. The most recent run, since July 2007, which we’ve highlighted in blue, is the worst. What’s more, recent pain has been particularly acute. Of HML’s 35% loss over the past twelve years, more than 22% has been absorbed since the beginning of 2017.
By this measure, the post-GFC era indeed has been challenging for value investors. And generally underwhelming value performance hasn’t been limited to this particular formulation or the U.S. market. Figure A1, for example, shows that it extends to E/P, CF/P, and D/P-based valuation metrics.
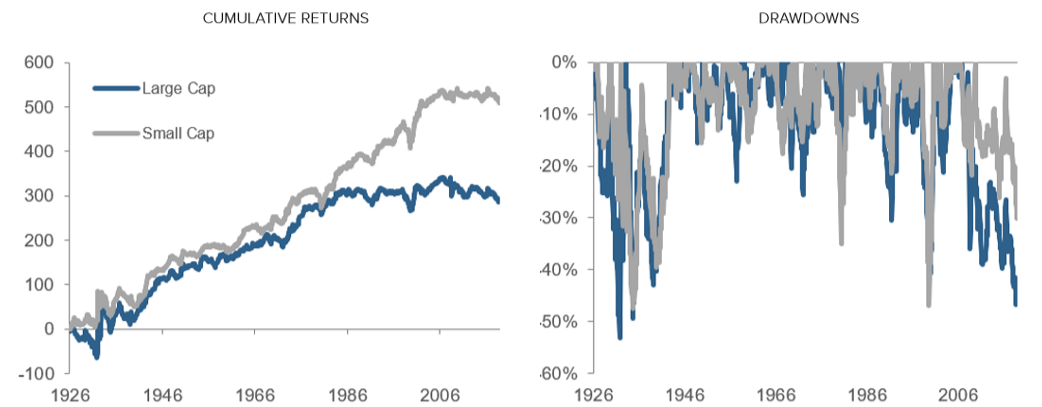
Closer examination reveals that there has been material and informative variation across the capitalization spectrum, geographies, and even formulations of value, more so than conventional narratives reflect. First, Figure 2 shows that degradation of the large-cap component of B/P value long-predated that of the smallcap component (left chart), and the drawdown among large-cap stocks has been more severe (right chart). Second, value performance has held up better outside of the U.S. This is captured within each panel of Figure 3, which compares the efficacy of simple valuation signals across the U.S., DM ex-U.S., and EM. Third, the efficacy of earnings-based signals has held up better than that of asset-based signals, as is evident from a comparison across the two panels in Figure 3.
Figure 1: Recent Value Performance in Historical Context
Twelve-year return paths of a hypothetical U.S. B/P-based long-short value-minus-glamour factor portfolio (“HML”) beginning every July since 1926.
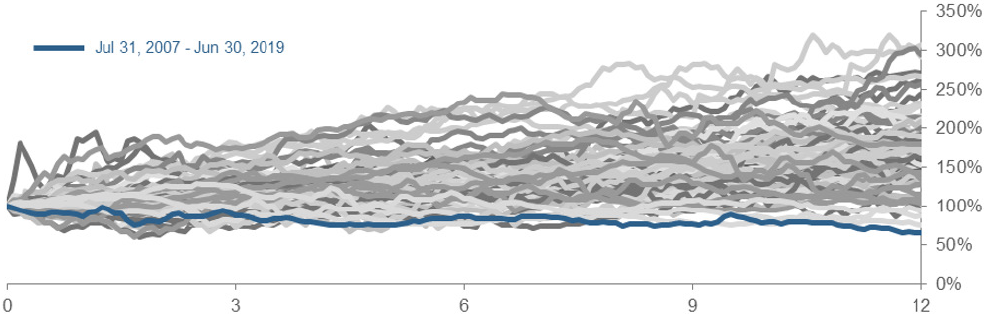
Figure 2: Large-Cap Versus Small-Cap Value Performance
Hypothetical U.S. B/P-based long-short value-minus-glamour factor portfolios, Jul 1926 – Jun 2019.
While the simple B/P and E/P formulations employed in the preceding charts help to identify broad trends in value’s performance, they’re not representative of the more nuanced constructions that Acadian and other sophisticated quants employ in production forecasting models. Figure 4 provides evidence that Acadian’s proprietary asset-based and income-based signals have generated superior efficacy across the ACWI universe relative to rudimentary B/P and E/P analogs. In other words, some of the deterioration in simple value signals’ performance points to potential benefits of refined implementations rather than to episodic underperformance or long-term degradation relevant even to more refined implementations.
Figure 3: Value Performance across Geographies
Cumulative returns of hypothetical B/P-based and E/P-based long-short value-minus-glamour portfolios, Feb 1993 – Jun 2019, Acadian North American, DM ex-U.S., and EM universe of securities.
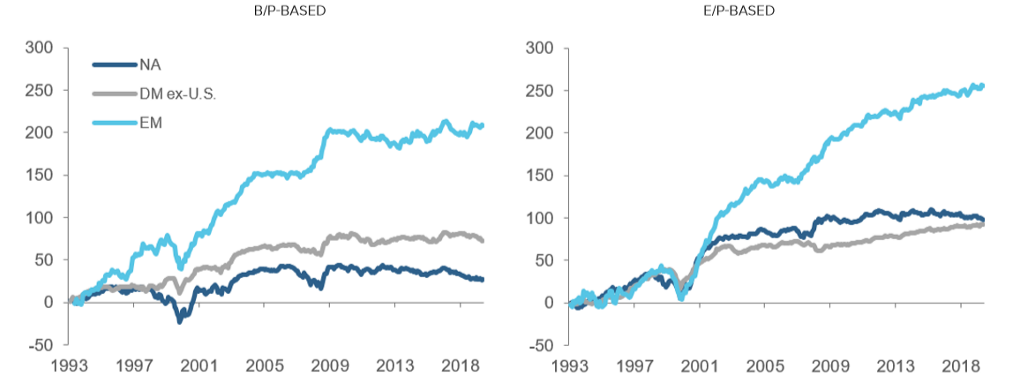
Figure 4: Hypothetical Cumulative Value Factor Performance: Acadian vs. Simple Definitions
Cumulative returns of hypothetical long-short value-minus-glamour portfolios, Acadian DM + EM universe of securities, Dec 1999 – Aug 2019.
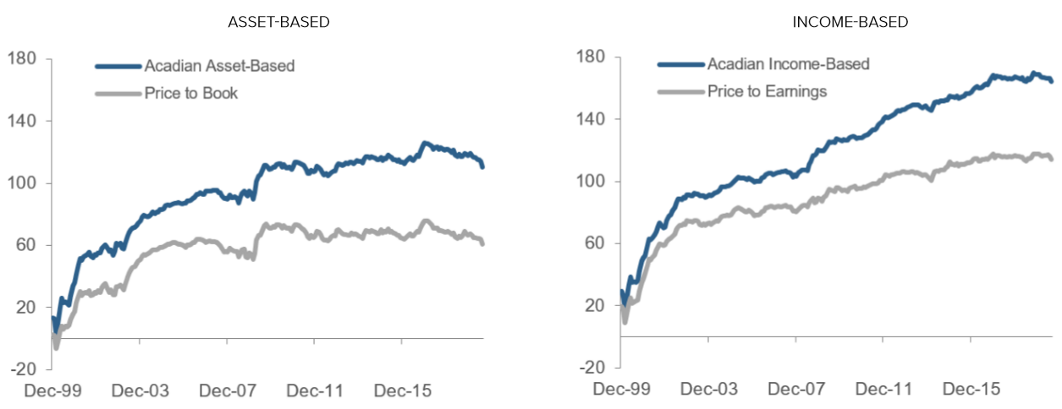
One implication of Figure 4 is that investors in sophisticated value strategies should expect materially different performance than from simple B/P and E/Pbased formulations that typify mass-market value implementations. Acadian’s approach reflects myriad design choices related to selection, construction, and combination of valuation signals as well as their interaction with other sources of alpha.
Drivers of Value’s Recent Performance
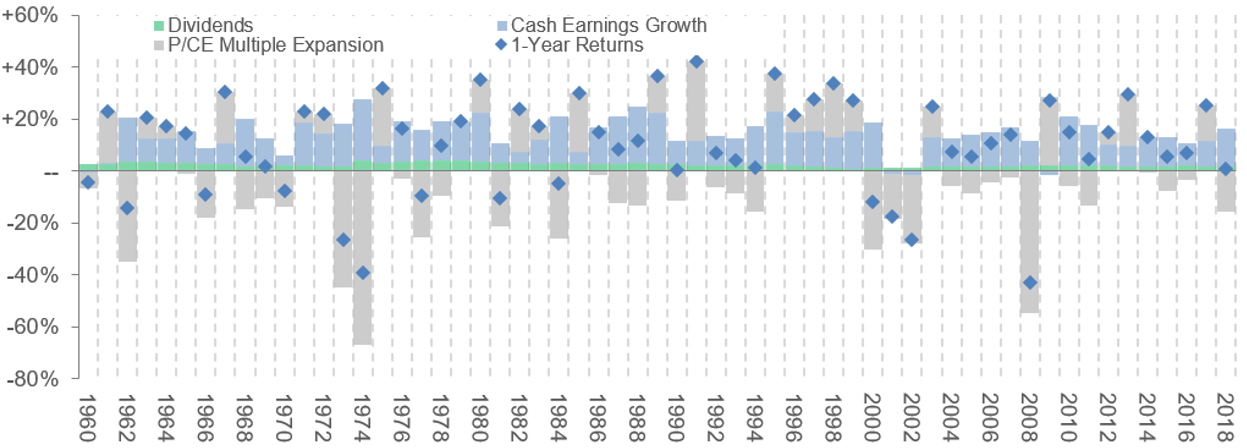
Macroeconomic conditions, investor thirst for long-term growth opportunities, as well as evolving economic structure and accounting practices all have influenced value’s performance. To help shed light on the influence of these drivers, we decompose value returns into contributions from fundamentals, multiple expansion, and dividends.1 We focus the analysis on the U.S., where value’s struggles have been particularly pronounced, but the discussion is relevant to understanding global patterns in value’s performance.
Figure 5 presents this decomposition for a hypothetical U.S. B/P-value-minus-glamour portfolio looking back almost 60 years. The blue diamonds represent annual portfolio returns while the “stacked” columns represent their components: cash earnings growth in blue, multiple expansion in grey, and dividends in green. (See Appendix Figures A2, A3 for decompositions applied separately to the long and short sides of the hypothetical portfolio.)
Macroeconomic Conditions
Macroeconomic conditions help to explain value’s weakness since 2007. First, the great recession and the subsequent muted recovery exposed the vulnerability of cheap stocks’ earnings growth, which has dragged on their returns. Figure 5 provides evidence, showing that during years in which value materially underperformed between 2007 and 2016, the negative value-minusglamour hypothetical portfolio returns were more than fully explained by value stocks’ relative earnings deterioration (blue columns more negative than the blue diamonds). In particular, 2008 and 2015 brought the worst declines in their earnings in more than 50 years.
This influence of the macro environment shouldn’t come as a surprise. Empirically, the earnings of companies with low P/B multiples tend to be relatively sensitive to economic conditions, and the market applies a valuation discount related to their vulnerability. In contrast, stocks with higher multiples, i.e., companies in which the market had greater confidence in their earnings potential, indeed generated more stable earnings growth. (See Appendix Figures A2, A3 for breakouts of the decomposition between long and short sides of the portfolio.)
Figure 5: Returns Decomposition: Hypothetical Long-Short U.S. Value-Minus-Glamour Portfolio
Contributions of cash earnings growth, multiple expansion, and dividends to annual returns of a U.S. B/P-based long-short value-minus-glamour factor portfolio.
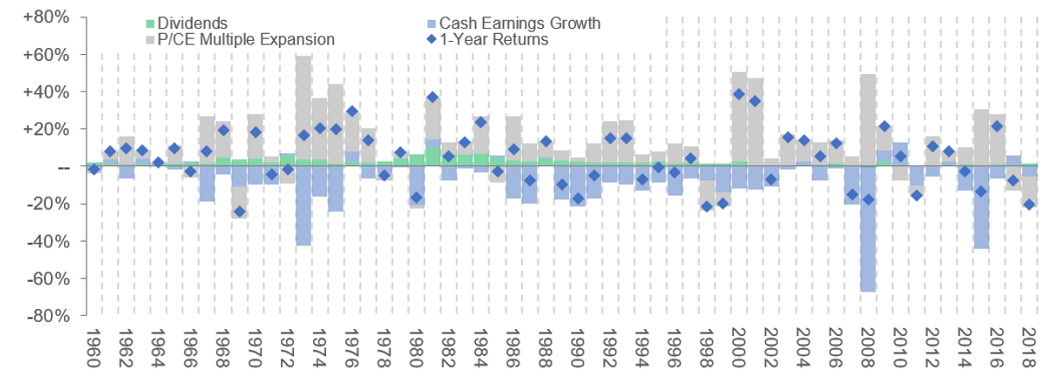
While economic growth has been subdued since the GFC, there also hasn’t been a washout and recovery to generate a substantial value opportunity. The long- term context in Figure 5 suggests that such episodic events, akin to contractions of the mid-1970s, early 1980s, and early 2000s, may contribute substantially to value returns, shrinking the multiples of glamour stocks, creating indiscriminate selling that provides a rich opportunity set of mispricings, and setting the stage for an economic rebound that is strong enough to pay off sharply discounted stocks that have uncertain fundamentals.
Market Sentiment
The decomposition in Figure 5 provides evidence that evolving market sentiment has contributed to the broader and more acute deterioration of value since 2017. Specifically, in 2017 and 2018 underperformance of value was attributable to glamour stocks’ relative multiple expansion, as reflected in the large negative grey columns at right, rather than directly to cheap stocks’ poor earnings growth.
Macroeconomic conditions help to explain what happened. The second half of 2016 brought hope of a self-sustaining and globally synchronized economic recovery. Improvements in global macro indicators were initially accompanied by anticipation of infrastructure spending and other fiscal stimulus in the U.S. that would favor what were then value stocks, including the asset heavy energy, materials, and resources sectors as well as financials, which would have benefitted from rising rates triggered by inflationary pressures. These expectations contributed to U.S. B/P value’s strong multiple expansion in 2016, both in absolute and relative terms.
But as the economy continued to improve, optimism regarding fiscal stimulus and inflation faded. In 2017 the market only rewarded already expensive glamour stocks with multiple expansion, even though value stocks generated slightly stronger earnings growth. The preference for glamour continued in the first half of 2018. Later in the year, amid concerns that the global economy would roll over, value only partially recovered its losses. In early 2019, the U.S. Federal Reserve pivoted back to an easing stance and averted a washout that might have benefited value and instead further increased pressure on investors to target growth opportunities, even at expensive valuations by historical standards.
We highlighted this reinvigorated preference for glamour stocks in our mid-2019 piece, “An Uncharacteristic Breakdown in Factor Diversification,” noting that growth-oriented indexes recently have outperformed not just value but momentum and quality as well. In other words, a range of strategies that weren’t aligned with the market’s one factor bet on growth were likely to underperform.
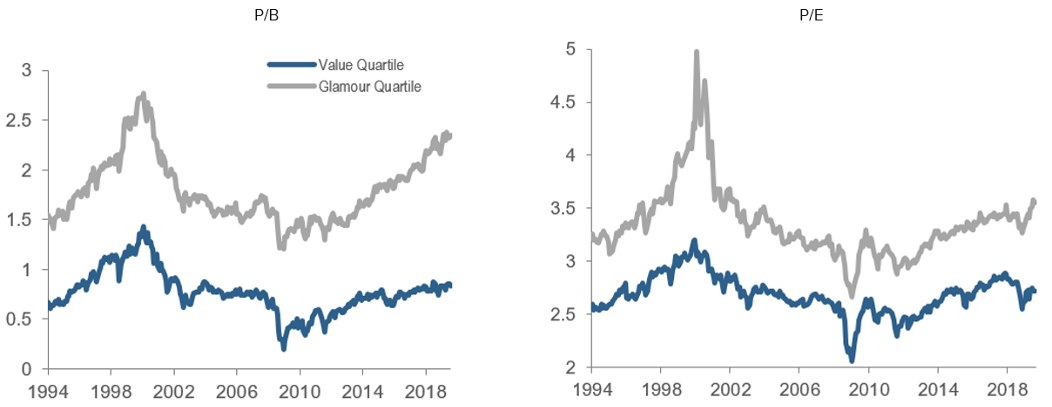
But we see evidence that the preference for glamour dates back several more years. Figure 6 shows that upper quartile U.S. P/B ratios have risen steadily since 2013, nearing peak TMT levels. Glamour P/E multiples have risen as well.
Figure 6: Valuation Ratios of B/P and E/P Glamour and Value Stocks
Acadian U.S. universe of securities, Feb 1994 – Sep 2019.
Evolving Economic Structure and Accounting Practices
We see links between the preference for glamour and changes in the structure of the economy, most evident in the U.S. Those shifts, along with evolving corporate balance sheet management practices, also help to explain the more protracted and severe underperformance of asset-based versus income-based value approaches.
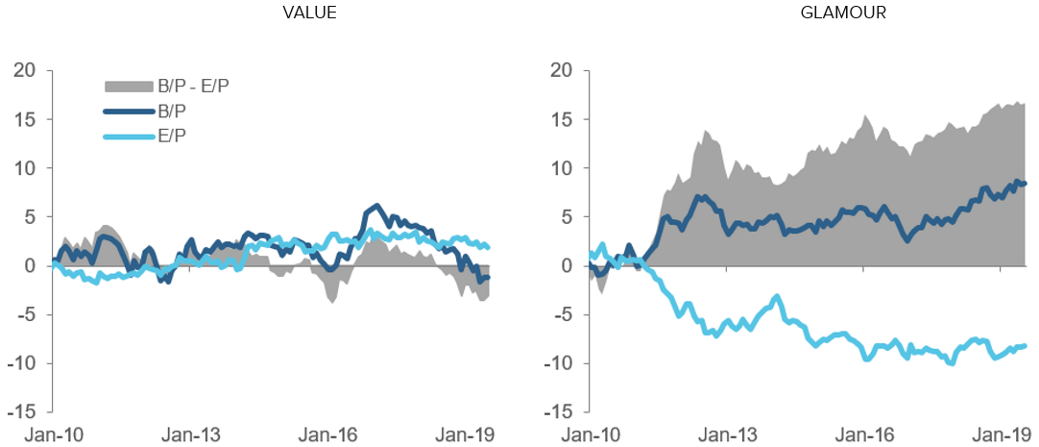
To help understand why, we focus directly on the returns spread between simple asset and income-based value formulations in the U.S. Figure 7 shows that it arises from the short side of value. I.e., glamour stocks defined in terms of B/P have outperformed those defined in terms of E/P.
This observation is consistent with one of the most striking patterns in fundamentals in recent years, specifically, the rising profitability of large-cap expensive P/B stocks in the U.S. Figure 8 shows that ROE within this market segment has trended higher for several years, diverging from the profitability of U.S. large-cap value stocks as well as U.S. small-cap stocks and reaching historically exceptional levels.2
Essentially by definition, rising ROE will cause stocks to appear more expensive based on B/P than on E/P.3 The interpretation of the wedge between the valuation metrics would depend on what is driving the increasing profitability. For example, whether it is reflective of a) enduring economic shifts, such as the emergence of more efficient cost structures or more profitable investment opportunities, or b) trends affecting the relevance of balance sheet accounting metrics, such as rising levels of intangible assets.
In the former case, B/P value strategies would directly tilt away from stocks with improved fundamental prospects, mistaking them for a market overpricing. This bias would be consistent with observed outperformance of B/P versus E/P glamour stocks. In the latter case, book values would reflect variation that has no economic significance. The increase in noise would be consistent with relatively large reduction in efficacy of B/P value signals. Industry biases would likely also result.
Figure 7: Hypothetical Performance of Value & Glamour: B/P-Based vs. E/P-Based Formulations
Cumulative returns of hypothetical long-only value and glamour portfolios, Acadian U.S. universe of securities, Dec 2009 - Jul 2019.
We believe that both economic and accounting drivers have contributed to the increase in U.S. large-cap glamour ROE. To help see why, Figure 9 breaks out aggregate ROE growth into contributions from the change in sector composition and changes in ROEs within each sector.4 We highlight two features: 1) the broad increase in ROEs, with the exception of the commodity-sensitive energy and materials sectors, and 2) large contributions to ROE growth from the IT, consumer discretionary, and communication services sectors, home of the FAANGs.
Figure 8: ROEs of Hypothetical U.S. B/P Value and Glamour Portfolios
U.S. universe.
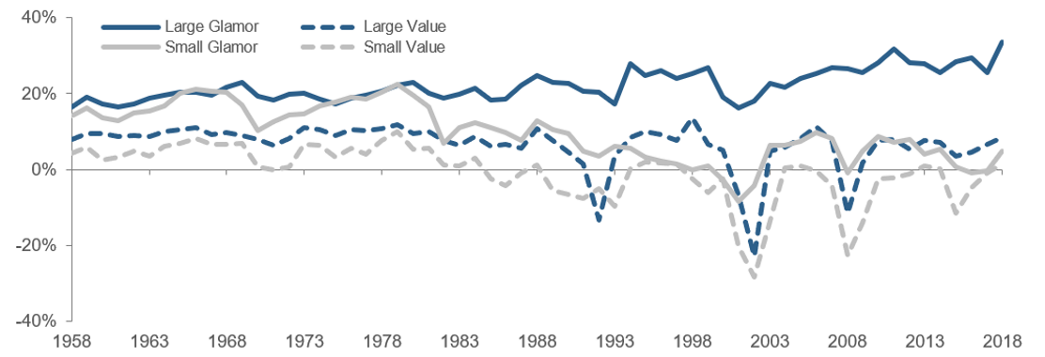
Figure 9: Decomposition of Hypothetical U.S. Large-Cap Glamour ROE Change from 2007 to 2018
U.S. universe.
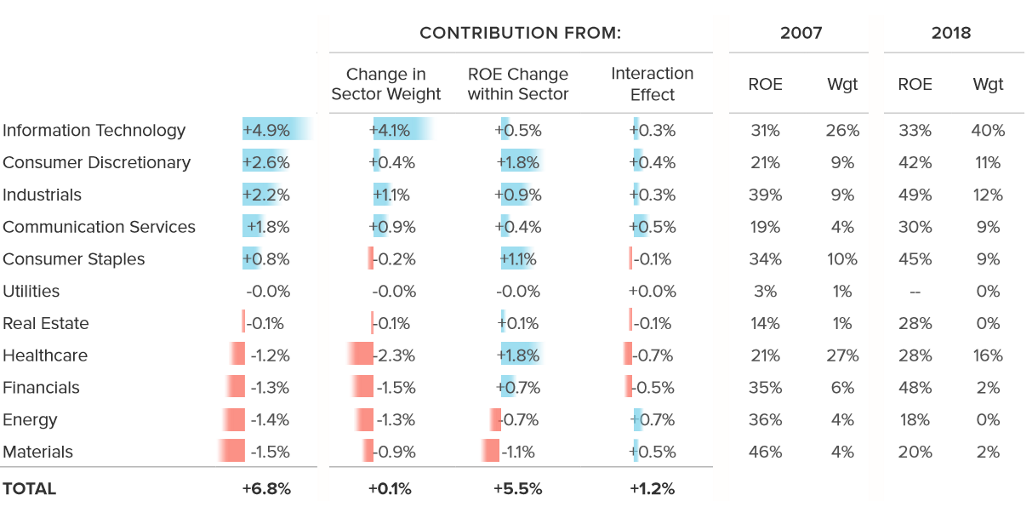
We interpret both observations as evidence of economic explanations for rising U.S. large-cap glamour ROE. Specifically, efficiency gains from globalization and technological advances as well as trends towards deregulation and governmental permissiveness with respect to corporate scale.5 The second observation, in particular, suggests that disruptive IT, consumer discretionary, and communications services firms and industries have been able to maintain profitability even as they have scaled up and/or displaced firms with less efficient business models.
But the second observation also points to what is likely a second order effect from accounting contributions to rising U.S. large-cap glamour ROE. As we discussed in our recent paper, “The Evolution of Value,” the FAANG sectors are also marked by high levels of intangible assets. Their increased weight in large-cap glamour may be evidence that artificially depressed book values are boosting measured profitability in that market segment.
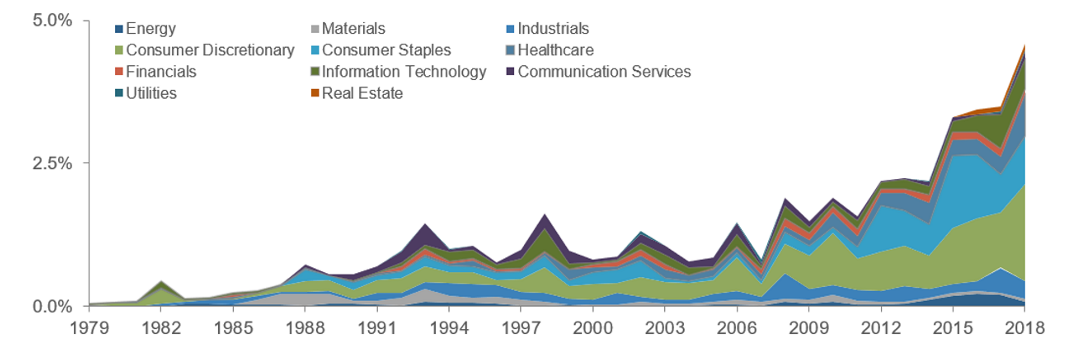
Stock buybacks represent another accountingoriented driver of large-cap ROE growth, at least in the U.S., that could add noise to B/P-based glamour / value classification.6 Figure 10 presents one measure of the trend’s materiality, showing that roughly 5% of the U.S. market capitalization spectrum is now accounted for by negative book value firms. This group includes blue chips, such as McDonalds and Home Depot.
In developed markets outside the U.S., buybacks are a more limited phenomenon, driven by an investor preference for dividend yield and, in EM, availability of growth opportunities for reinvestment of capital.7 The geographic variation highlights a source of potential deterioration in the comparability of B/P metrics that are not regionally relative in construction.
Figure 10: Percentage of U.S. Market Capitalization Represented by Negative Book Firm
Acadian U.S. universe of securities.
Conclusion
The analysis in this paper underscores that value is a deceptively simple concept whose richness hasn’t been adequately addressed in prevalent narratives around its recent performance. A more nuanced perspective provides the foundation for our value outlook going forward, which is informed by the progression of value’s efficacy over time as well as variation in performance across market segments and between income and asset-based signals.
As we summarize in a companion note, “The Outlook for Value,” we are positive about value’s prospects, and we see no reason to abandon it as a long-term component of a multifactor investing strategy. But the complexity and constantly evolving nature of the environment in which we search for value opportunities, as highlighted in this paper, speaks to the need for a thoughtful and refined approach. We describe the central tenets of Acadian’s value investing philosophy, which is based on that premise, in a second complementary write-up, “Acadian’s Approach to Value Investing.”
Appendix
Figure A1: Hypothetical U.S. Value Performance Based on a Variety of Different Valuation Metrics
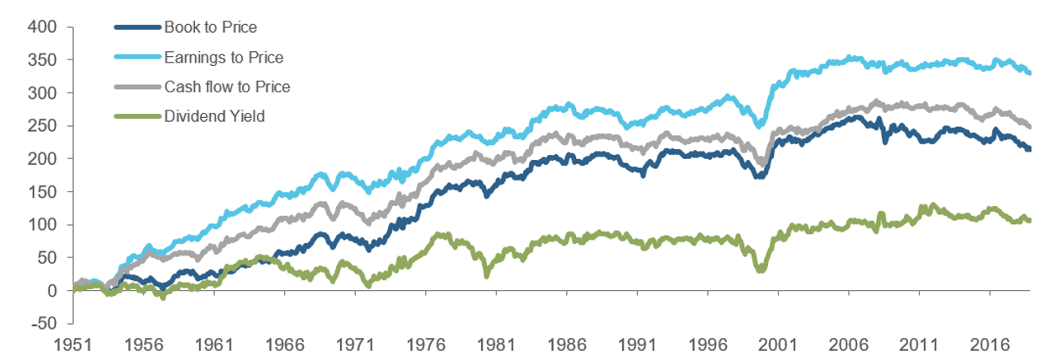
Figure A2: Returns Decomposition: Hypothetical Long-Only U.S. Value Portfolio
Contributions of cash earnings growth, multiple expansion, and dividends to annual returns of a U.S. B/P-based value portfolio.
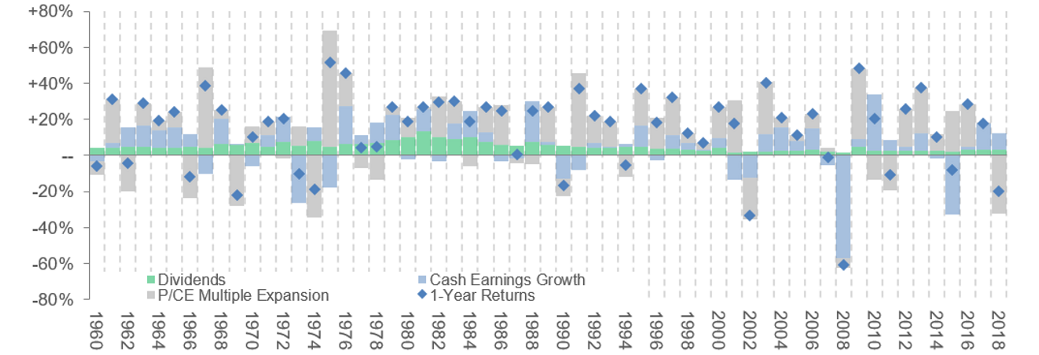
Figure A3: Returns Decomposition: Hypothetical Long-Only U.S. Glamour Portfolio
Contributions of cash earnings growth, multiple expansion, and dividends to annual returns of a U.S. B/P-based glamour portfolio.
Endnotes
- The decomposition is derived by adding and subtracting cash earnings growth to the expression for portfolio returns and rearranging:

- Small-cap ROE hasn’t recovered from the recession in the early 1980s. Fama and French noted this deterioration more than 20 years ago in a 1996 Journal of Finance paper: “In short, for some unexplained reason, the recession of 1981 and 1982 turns into a prolonged earnings depression for small stocks. The depression is general. It hits high-BE/ME small stocks…. and low BE/ME small stocks.” Fama, Eugene F. and Kenneth R. French, “Size and Book-to-Market Factors in Earnings and Returns,” Journal of Finance, March 1995, vol.50(1), p. 141.
- As a thought example, consider a case where a foreseeably permanent increase in ROE is achieved and capitalized into the market price but with no increase in book
- The analysis uses 2019 GICs codes, so it should be largely immune to reclassifications, for example, that accompanied the 2018 formation of the Communications Services sector.
- Within certain sectors, such as healthcare and financials, industry composition effects and regulatory influences likely play a role.
- Buybacks, financed either through use of cash (decrease in assets) or debt (increase in liabilities) reduce total outstanding shareholder equity and hence boost ROE. Facilitated by an extended regime of low interest rates and investor demand for high quality corporate debt, buybacks have grown to historically high levels in the U.S., rising to a measurable percentage of GDP.
- J.P. Morgan Perspectives, “The Rise of the Corporates: Buybacks at an Inflection Point?,” July 17, 2019.
Hypothetical Legal Disclaimer
Acadian is providing hypothetical performance information for your review as we believe you have access to resources to independently analyze this information and have the financial expertise to understand the risks and limitations of the presentation of hypothetical performance. Please immediately advise if that is not the case.
Hypothetical performance results have many inherent limitations, some of which are described below. No representation is being made that any account will or is likely to achieve profits or losses similar to those shown. In fact, there are frequently sharp differences between hypothetical performance results and the actual performance results subsequently achieved by any particular trading program.
One of the limitations of hypothetical performance results is that they are generally prepared with the benefit of hindsight. In addition, hypothetical trading does not involve financial risk, and no hypothetical trading record can completely account for the impact of financial risk in actual trading. For example, the ability to withstand losses or to adhere to a particular trading program in spite of trading losses are material points which can also adversely affect actual trading results. There are numerous other factors related to the markets in general or to the implementation of any specific trading program which cannot be fully accounted for in the preparation of hypothetical performance results and all of which can adversely affect actual trading results.
Legal Disclaimer
These materials provided herein may contain material, non-public information within the meaning of the United States Federal Securities Laws with respect to Acadian Asset Management LLC, Acadian Asset Management Inc. and/or their respective subsidiaries and affiliated entities. The recipient of these materials agrees that it will not use any confidential information that may be contained herein to execute or recommend transactions in securities. The recipient further acknowledges that it is aware that United States Federal and State securities laws prohibit any person or entity who has material, non-public information about a publicly-traded company from purchasing or selling securities of such company, or from communicating such information to any other person or entity under circumstances in which it is reasonably foreseeable that such person or entity is likely to sell or purchase such securities.
Acadian provides this material as a general overview of the firm, our processes and our investment capabilities. It has been provided for informational purposes only. It does not constitute or form part of any offer to issue or sell, or any solicitation of any offer to subscribe or to purchase, shares, units or other interests in investments that may be referred to herein and must not be construed as investment or financial product advice. Acadian has not considered any reader's financial situation, objective or needs in providing the relevant information.
The value of investments may fall as well as rise and you may not get back your original investment. Past performance is not necessarily a guide to future performance or returns. Acadian has taken all reasonable care to ensure that the information contained in this material is accurate at the time of its distribution, no representation or warranty, express or implied, is made as to the accuracy, reliability or completeness of such information.
This material contains privileged and confidential information and is intended only for the recipient/s. Any distribution, reproduction or other use of this presentation by recipients is strictly prohibited. If you are not the intended recipient and this presentation has been sent or passed on to you in error, please contact us immediately. Confidentiality and privilege are not lost by this presentation having been sent or passed on to you in error.
Acadian’s quantitative investment process is supported by extensive proprietary computer code. Acadian’s researchers, software developers, and IT teams follow a structured design, development, testing, change control, and review processes during the development of its systems and the implementation within our investment process. These controls and their effectiveness are subject to regular internal reviews, at least annual independent review by our SOC1 auditor. However, despite these extensive controls it is possible that errors may occur in coding and within the investment process, as is the case with any complex software or data-driven model, and no guarantee or warranty can be provided that any quantitative investment model is completely free of errors. Any such errors could have a negative impact on investment results. We have in place control systems and processes which are intended to identify in a timely manner any such errors which would have a material impact on the investment process.
Acadian Asset Management LLC has wholly owned affiliates located in London, Singapore, and Sydney. Pursuant to the terms of service level agreements with each affiliate, employees of Acadian Asset Management LLC may provide certain services on behalf of each affiliate and employees of each affiliate may provide certain administrative services, including marketing and client service, on behalf of Acadian Asset Management LLC.
Acadian Asset Management LLC is registered as an investment adviser with the U.S. Securities and Exchange Commission. Registration of an investment adviser does not imply any level of skill or training.
Acadian Asset Management (Singapore) Pte Ltd, (Registration Number: 199902125D) is licensed by the Monetary Authority of Singapore. It is also registered as an investment adviser with the U.S. Securities and Exchange Commission.
Acadian Asset Management (Australia) Limited (ABN 41 114 200 127) is the holder of Australian financial services license number 291872 ("AFSL"). It is also registered as an investment adviser with the U.S. Securities and Exchange Commission. Under the terms of its AFSL, Acadian Asset Management (Australia) Limited is limited to providing the financial services under its license to wholesale clients only. This marketing material is not to be provided to retail clients.
Acadian Asset Management (UK) Limited is authorized and regulated by the Financial Conduct Authority ('the FCA') and is a limited liability company incorporated in England and Wales with company number 05644066. Acadian Asset Management (UK) Limited will only make this material available to Professional Clients and Eligible Counterparties as defined by the FCA under the Markets in Financial Instruments Directive, or to Qualified Investors in Switzerland as defined in the Collective Investment Schemes Act, as applicable.