
Reflections on a Generation of Investing in EM Equities
Key Takeaways
- 2024 marks the 30th anniversary of Acadian’s core emerging markets (EM) strategy. Experience accrued over the past three decades informs our present investing approach.
- The past few years have reinforced the value of systematic investing in EM. Well-diversified, fundamentally driven strategies have outperformed as speculative sentiment abated.
- The opportunity set for systematic investing in EM is now broader than ever, owing to expansion of the investible universe, improved data coverage, and a secular downtrend in trading costs.
Table of contents
Thirty years ago, in 1994, Acadian pioneered the application of systematic, active investing to emerging markets, adapting concepts from behavioral finance to exploit inefficiencies in what was still an exotic asset class.1 Since then, the landscape of emerging market (EM) investing has changed dramatically, and our approach to investing there has evolved accordingly. In this brief note, we highlight key aspects of what has changed, what has not, and why we’re excited about the prospects for systematic investing in EM over the next 30 years!
Data Revolution and Investing Evolution
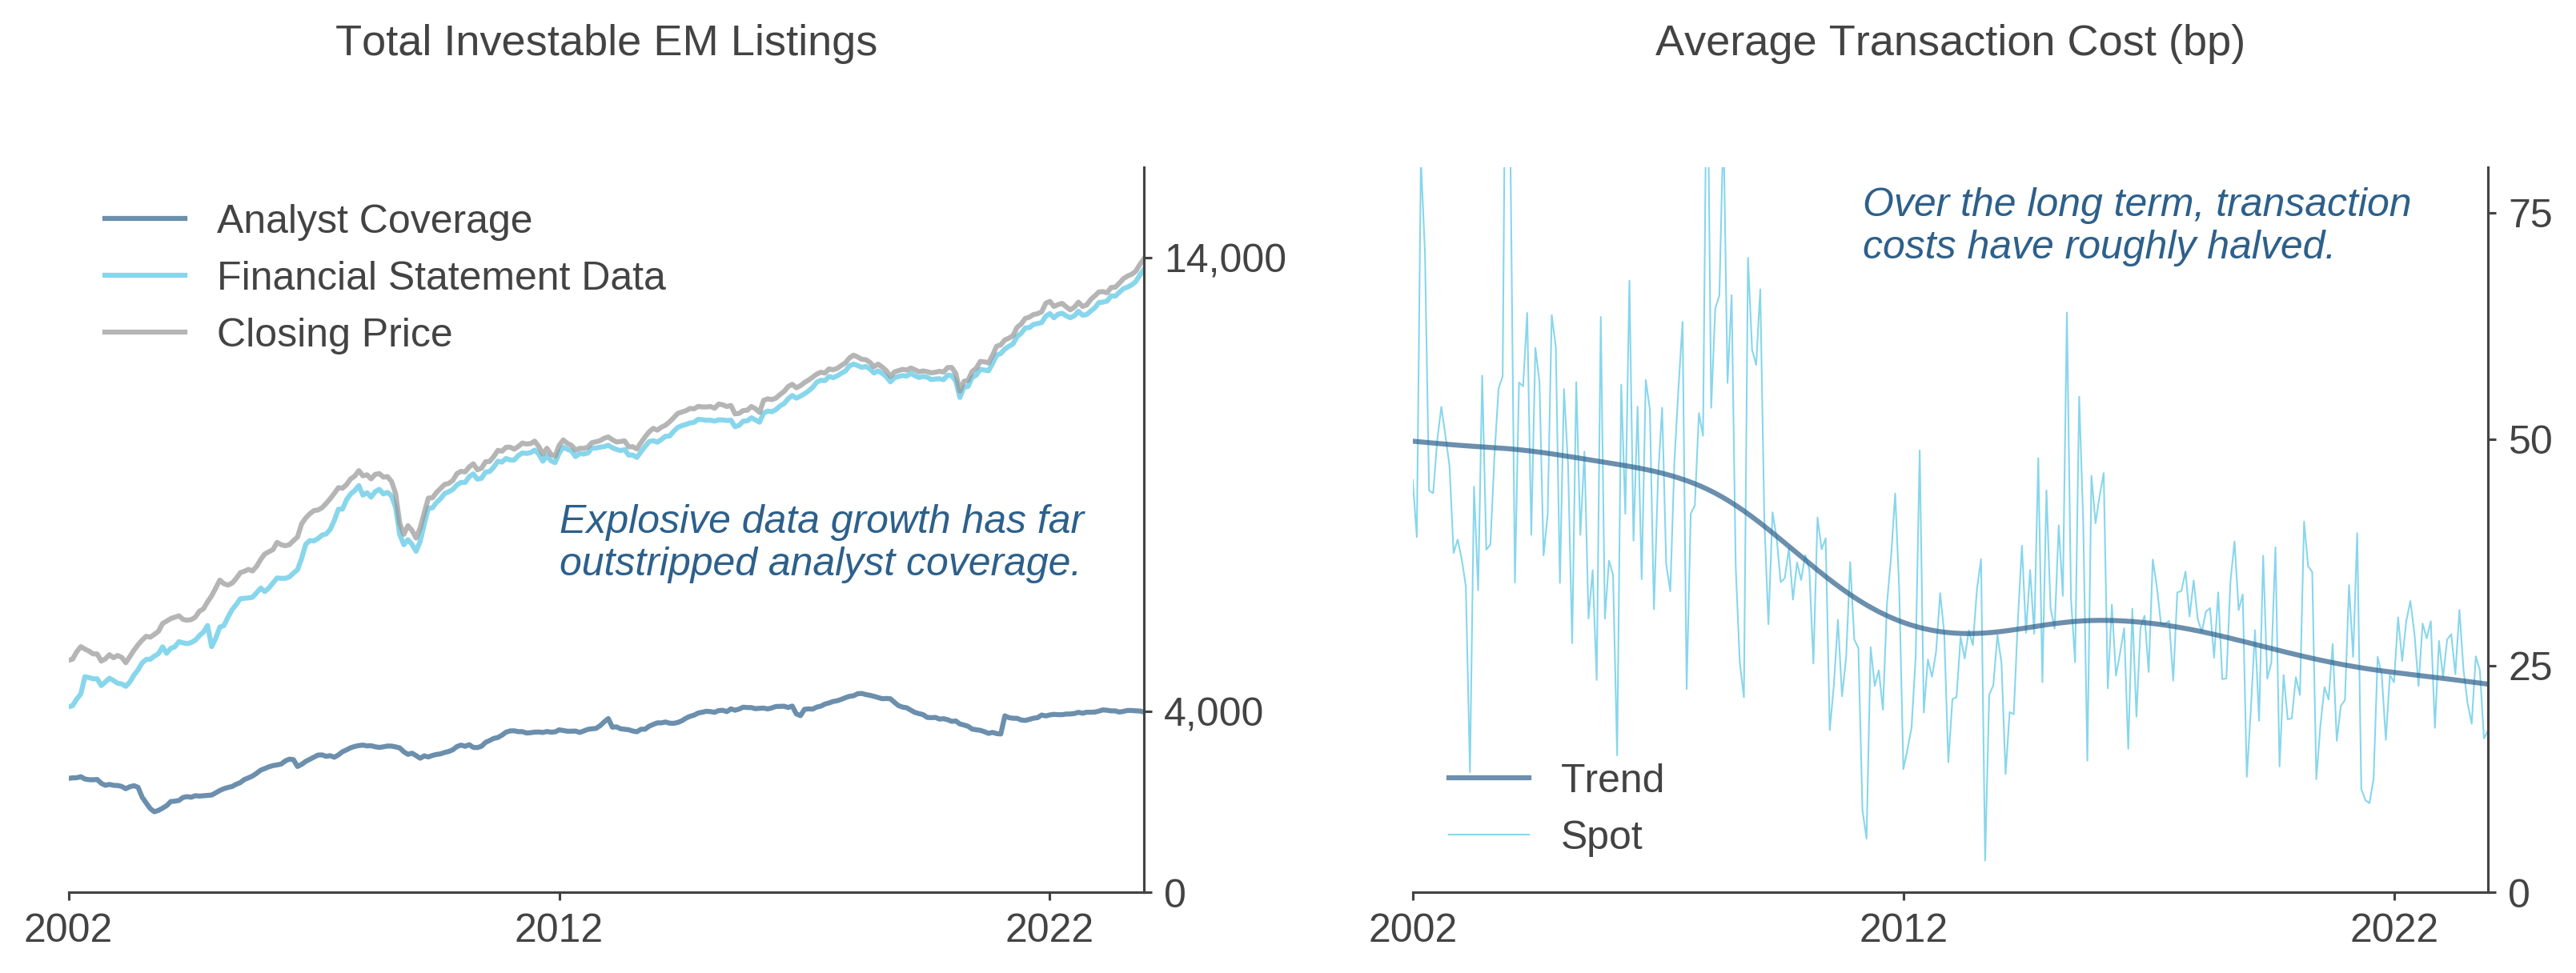
The landscape of active, systematic investing in EM has transformed over the last 30 years. Back in 1994, when Acadian launched its core EM equities strategy, we dealt with nascent markets and lagged data. Much has changed. With respect to data, company-level fundamentals and market information were sparse and not necessarily available digitally. We often pulled data manually from hardcopy publications (e.g., from S&P and the IFC). Since then, we have seen extensive growth in both standardized datasets from high-quality vendors as well as unstructured data. This has allowed for the expanded application of proprietary signals across high-breadth emerging markets like India, Taiwan, China, and Korea. Despite the improvements in data availability, however, analyst coverage still lags in EM (Figure 1, left). This has created a rich source of behavioral inefficiencies that systematic investors are equipped to exploit. Retail investor-dominated markets, such as India and onshore China, are especially intriguing in this regard.
Figure 1: Long-Term Trends in Data Availability and Trading Costs
In addition to the information environment, emerging equity markets themselves have also evolved. As we’ve discussed in prior research, in the early 1990s, Latin America at times accounted for 50% or more of the benchmark. Today, Asia dominates, with more than a 70% weighting in China, India, Taiwan, and South Korea.2
Accessibility and trading infrastructures have improved, resulting in increased global institutional participation, impressive gains in trading efficiency, and a downtrend in aggregate transaction costs (Figure 1, right). In the early days, many major markets, such as India, required physical settlement. Acadian PMs recall anecdotes about couriers speeding through the jammed streets of Mumbai with stock certificates precariously tied to milk crates. Fast forward to present day: the same country is poised to become the first market in the world to target instantaneous electronic settlement.3 In this respect, some EMs have truly emerged.
The nature of the opportunity set is also dramatically different. Monikers like “resource play” no longer fit EM equities as they once did. In the early days, materials accounted for about 20% of the MSCI EM Index. In contrast, information technology’s exposure stood at a mere 1.5% (!), and that was entirely attributable to hardware stocks. There were no software or semiconductor stocks in the benchmark. Today, in stark contrast, almost 70% of global semiconductor needs are met by Taiwan, South Korea, and China. IT now accounts for 20-30% of prevalent cap-weighted EM benchmarks.
Risk: The More Things Change…
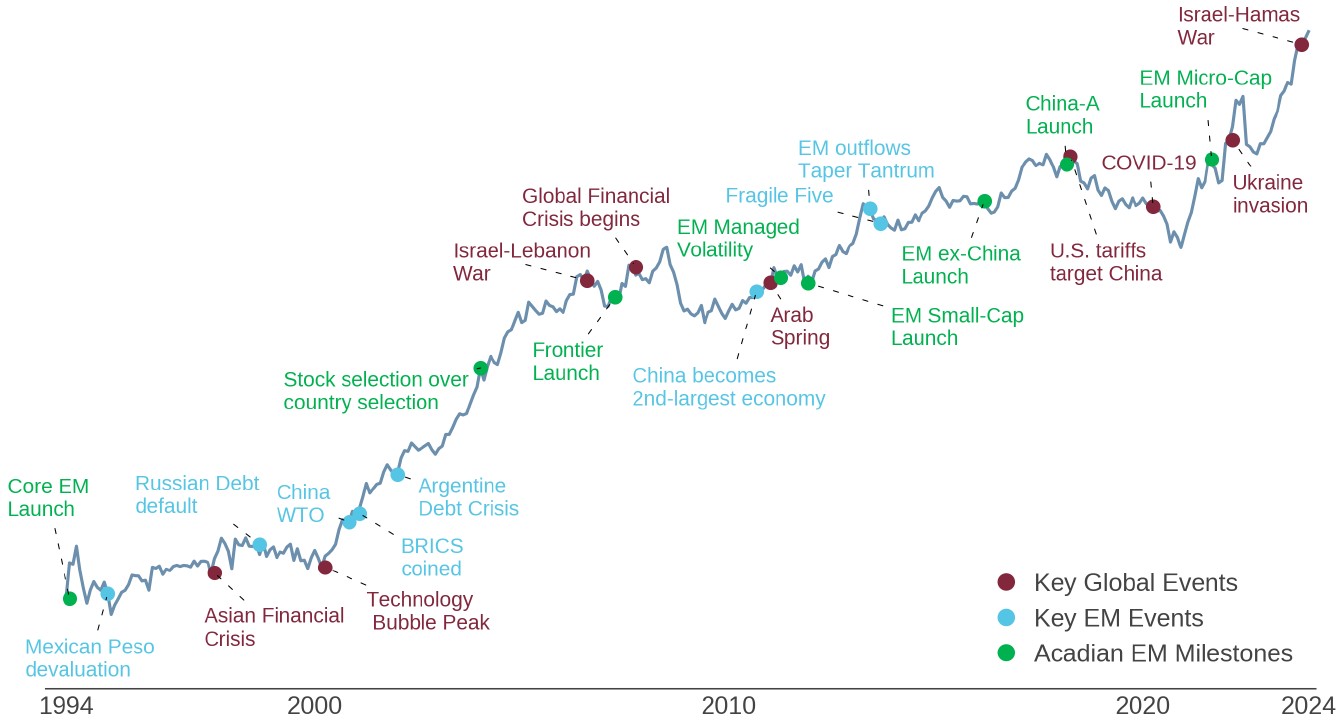
Geopolitical risk has been at the forefront of EM investors’ concerns in recent years. That’s only natural given China/ Taiwan tensions, anxiety about the Korean peninsula, and Russia’s invasion of Ukraine. But geopolitical risk has always been an inherent feature of EM investing. The launch of our core EM equity strategy, for example, was immediately followed by a series of EM-centric crises that shook markets worldwide: the Mexican peso devaluation in 1995, the Asian financial crisis in 1997, and Russia’s debt default in 1998 (Figure 2). Such events prompted innovation. One early adaptation was a proprietary risk measure in our country model aimed at detecting abnormal patterns in currency and equity market volatility. This feature helped us to tilt away from the Argentine debt crisis in 2001.
Figure 2: Acadian EM Composite Cumulative Active Return since Inception
In addition to developments aimed at managing geopolitical risk, research and process refinement has also focused on disambiguating it from opportunity. As an example, in the early 2000s we observed that some markets looked persistently cheap. We hypothesized that local corruption could be impeding profits, and hence returns, from accruing to shareholders. As a result, we incorporated measures of corruption risk into our country models to better detect these “value traps,” i.e., countries that stayed cheap by standard valuation measures. Although much has changed, our philosophy has continued to rely on the well-established foundations of behavioral finance to better isolate and exploit inefficiencies created by investor over- and underreaction in markets.
The Outlook for Systematic EM Investing
As we look ahead, we are excited about prospects for systematic EM investing. In view of the current landscape, we would offer allocators a few words of wisdom:
First, embrace sophistication in EM investing. In the early days, stock selection methods that leaned on rudimentary indicators like unadjusted price-to-book ratios and academic formulations of price momentum could generate excess returns. But many such signals have become commoditized or distorted in interpretation, even in EM, and their performance has deteriorated. Improvements in EM data and trading environments, which we expect to continue, allow for—and increasingly necessitate—the application of nuanced signals, much like those applied in developed markets (although often with EM- or even market-specific variations in formulation). We believe that systematic approaches that exploit novel data and analytical methods and adapt to the ongoing evolution of emerging financial markets will continue to reward investors.
Second, embrace what is distinct in emerging markets. In the 1990s, EM benchmark indexes produced return streams that helped to diversify DM allocations. But decades of global economic and financial market integration have dramatically changed the picture. Passive EM allocations are dominated by large-cap stocks that are well integrated with the global economy. As a result, returns of cap-weighted EM indexes now can be largely explained by global risk factors. For active EM investors, however, the full investible universe offers a distinctive opportunity set, with a large pool of companies whose returns are driven by local influences.4 To reap the benefits, we would encourage EM investors to take material active risk relative to top-heavy cap-weighted indexes.
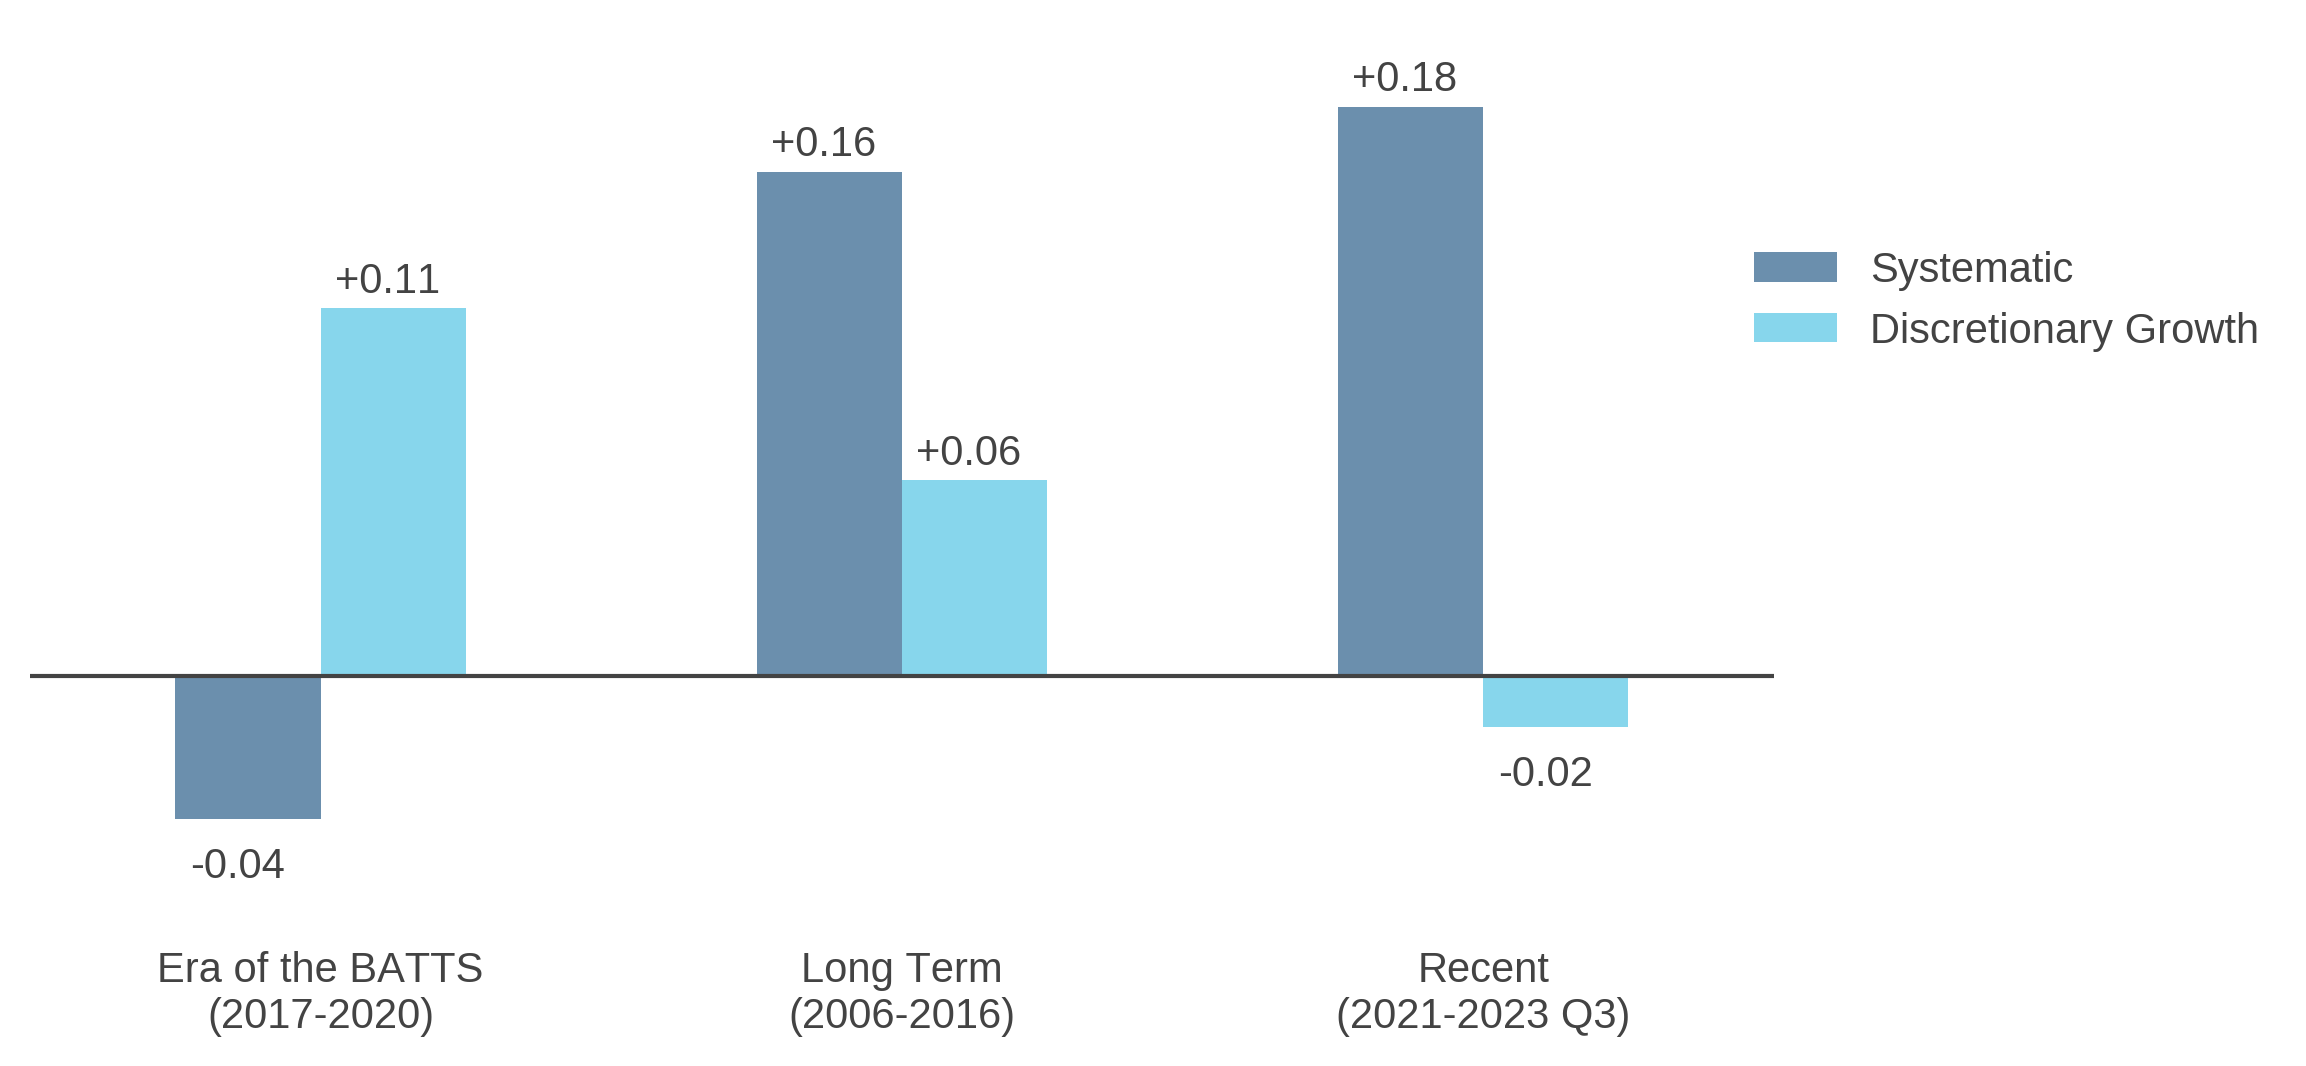
Finally, re-commit to well-diversified EM investments. Over the years, we have seen our fair share of narrow fads come and go. Remember the BRICS or their evil twin, the “Fragile Five?” The BATTS provide an especially pertinent example. This handful of mega-cap technology stocks became the darlings of many EM managers from 2017-20.5 For a time, this positioning paid off as the BATTS delivered approximately +30% returns per annum.6 Figure 3 shows that over these years, growth-focused discretionary EM managers outperformed even the cap-weighted benchmark, which benefited greatly from the BATTS’ runup. But, in late 2020, when Chinese regulators cracked down on offshore-listed platform companies, growth fervor collapsed. Since then, well-diversified, fundamentally driven strategies have resumed their historically characteristic outperformance.7
Figure 3: Median Manager Information Ratio
Conclusion
The embrace of change has been a hallmark of Acadian’s journey through emerging markets over the past 30 years. As we reflect on milestones passed and experience accrued, we are reminded of the appeal of a disciplined yet adaptive investment process. We look forward to many more years of leveraging this ethos to generate value for our EM investors.
Endnotes
- Michaud, Richard, Bergstrom, Gary, Frashure, Ronald, and Wolahan, Brian, “Twenty Years of International Equity Investing,” The Journal of Portfolio Management vol. 23, no. 1 (Fall 1996).
- Not Your Parents’ Emerging Markets Index, Acadian, September 2018.
- "India Aims for Instant Stock Settlement in Global Race for Speed" Bloomberg, January 11, 2024.
- EM small-caps, onshore China equities, and related markets such as Frontier equities offer greater diversification potential. See Polarizing Views: China’s Impact on EM Investing, Acadian, December 2021.
- Baidu, Alibaba, Tencent, Taiwan Semiconductor, Samsung. References to these and any other companies in this write-up should not be construed as recommendations to buy or sell any specific securities.
- A BATTS-only portfolio that is equally weighted and rebalanced annually between 2017 and 2020.
- For further discussion, see Reassessing Emerging Equities, Acadian, October 2020.
Additional Disclosures
Every investment program has an opportunity for loss as well as profit. Benchmarks are individual to each manager based on the benchmarks reported to eVestment. Past performance is no guarantee of future returns. eVestment Alliance, LLC and its affiliated entities (collectively, “eVestment”) collect information directly from investment management firms and other sources believed to be reliable, however, eVestment does not guarantee or warrant the accuracy, timeliness, or completeness of the information provided and is not responsible for any errors or omissions. Performance results may be provided with additional disclosures available on eVestment’s systems and other important considerations such as fees that may be applicable. Not for general distribution and limited distribution may only be made pursuant to client’s agreement terms. All managers in an eVestment category are not necessarily included. Copyright 2012-2025 eVestment Alliance, LLC. For illustrative purposes only. All Rights Reserved.
Legal Disclaimer
These materials provided herein may contain material, non-public information within the meaning of the United States Federal Securities Laws with respect to Acadian Asset Management LLC, BrightSphere Investment Group Inc. and/or their respective subsidiaries and affiliated entities. The recipient of these materials agrees that it will not use any confidential information that may be contained herein to execute or recommend transactions in securities. The recipient further acknowledges that it is aware that United States Federal and State securities laws prohibit any person or entity who has material, non-public information about a publicly-traded company from purchasing or selling securities of such company, or from communicating such information to any other person or entity under circumstances in which it is reasonably foreseeable that such person or entity is likely to sell or purchase such securities.
Acadian provides this material as a general overview of the firm, our processes and our investment capabilities. It has been provided for informational purposes only. It does not constitute or form part of any offer to issue or sell, or any solicitation of any offer to subscribe or to purchase, shares, units or other interests in investments that may be referred to herein and must not be construed as investment or financial product advice. Acadian has not considered any reader's financial situation, objective or needs in providing the relevant information.
The value of investments may fall as well as rise and you may not get back your original investment. Past performance is not necessarily a guide to future performance or returns. Acadian has taken all reasonable care to ensure that the information contained in this material is accurate at the time of its distribution, no representation or warranty, express or implied, is made as to the accuracy, reliability or completeness of such information.
This material contains privileged and confidential information and is intended only for the recipient/s. Any distribution, reproduction or other use of this presentation by recipients is strictly prohibited. If you are not the intended recipient and this presentation has been sent or passed on to you in error, please contact us immediately. Confidentiality and privilege are not lost by this presentation having been sent or passed on to you in error.
Acadian’s quantitative investment process is supported by extensive proprietary computer code. Acadian’s researchers, software developers, and IT teams follow a structured design, development, testing, change control, and review processes during the development of its systems and the implementation within our investment process. These controls and their effectiveness are subject to regular internal reviews, at least annual independent review by our SOC1 auditor. However, despite these extensive controls it is possible that errors may occur in coding and within the investment process, as is the case with any complex software or data-driven model, and no guarantee or warranty can be provided that any quantitative investment model is completely free of errors. Any such errors could have a negative impact on investment results. We have in place control systems and processes which are intended to identify in a timely manner any such errors which would have a material impact on the investment process.
Acadian Asset Management LLC has wholly owned affiliates located in London, Singapore, and Sydney. Pursuant to the terms of service level agreements with each affiliate, employees of Acadian Asset Management LLC may provide certain services on behalf of each affiliate and employees of each affiliate may provide certain administrative services, including marketing and client service, on behalf of Acadian Asset Management LLC.
Acadian Asset Management LLC is registered as an investment adviser with the U.S. Securities and Exchange Commission. Registration of an investment adviser does not imply any level of skill or training.
Acadian Asset Management (Singapore) Pte Ltd, (Registration Number: 199902125D) is licensed by the Monetary Authority of Singapore. It is also registered as an investment adviser with the U.S. Securities and Exchange Commission.
Acadian Asset Management (Australia) Limited (ABN 41 114 200 127) is the holder of Australian financial services license number 291872 ("AFSL"). It is also registered as an investment adviser with the U.S. Securities and Exchange Commission. Under the terms of its AFSL, Acadian Asset Management (Australia) Limited is limited to providing the financial services under its license to wholesale clients only. This marketing material is not to be provided to retail clients.
Acadian Asset Management (UK) Limited is authorized and regulated by the Financial Conduct Authority ('the FCA') and is a limited liability company incorporated in England and Wales with company number 05644066. Acadian Asset Management (UK) Limited will only make this material available to Professional Clients and Eligible Counterparties as defined by the FCA under the Markets in Financial Instruments Directive, or to Qualified Investors in Switzerland as defined in the Collective Investment Schemes Act, as applicable.