
Not Your Parents’ Emerging Markets Index
Key Takeaways
- The MSCI Emerging Markets Index has changed meaningfully in its 30-year history, more than doubling in constituent countries and growing 400-fold in market capitalization.
- Over the last two decades, emerging Asia’s weight in the index has grown, while sector composition has shifted materially, amid declining exposure to extractive industries and increased weight in technology and finance.
- We expect the MSCI Emerging Markets Index to continue to evolve. In particular, we believe that the inclusion of China A-shares is a watershed event that will materially increase China’s weight in the index over time.
Table of contents
In the three decades since the MSCI Emerging Markets (EM) Index launched in 1988, it has undergone sweeping changes. Specifically, index coverage has expanded from 10 to 24 countries and its market capitalization has grown from $15 billion to $6 trillion.1 Development of the Chinese economy, in particular, has spurred significant changes in the composition of this important benchmark, impacting country, regional, and sector exposures. In this paper, we provide examples of how the index has evolved and examine how it might continue to evolve in the future.
Looking Back
Figures 1-3 help to visualize the dramatic shifts in MSCI EM index composition over time. At the country level, Figure 1 shows how weightings of some of the most prominent constituents have evolved. Thirty years ago, in December 1988, Malaysia and Brazil together represented over half the index. Just 10 years later, Malaysia was no longer in the index, while Mexico, South Korea, South Africa, and Taiwan had joined Brazil in having weights exceeding 10%. Since then, Malaysia has been reinstated and China’s weight in the index has risen from a de minimis level to more than 30%.
Figure 1: MSCI EM Index Weights of Selected Countries
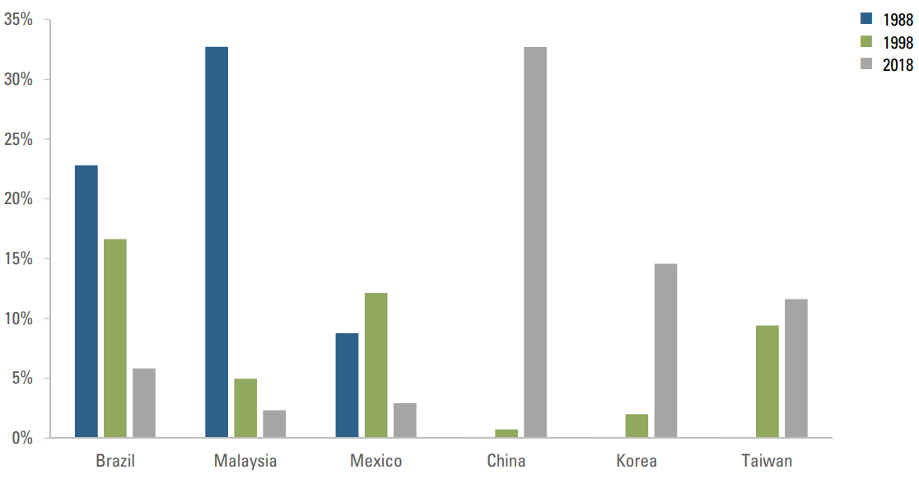 Source: MSCI. Copyright MSCI 2018. All Rights Reserved. Unpublished. PROPRIETARY TO MSCI. For illustrative purposes only. It is not possible to invest directly in any index. Past performance is no guarantee of future results. Investors have the opportunity for losses as well as profits. As of 6/30/1988, 6/30/1998, 6/30/2018.
The regional distribution of the MSCI EM Index has likewise shifted through time. As shown in Figure 2, Asia’s weight in the MSCI EM Index has grown while Latin America has seen its weight fall.
Sector composition has also undergone meaningful shifts. Information Technology and Financials have grown steadily over time and now represent roughly half of the index (Figure 3). In return, Materials and Telecommunication Services have seen their relative importance decrease.
Figure 2: MSCI EM Index Regional Weights
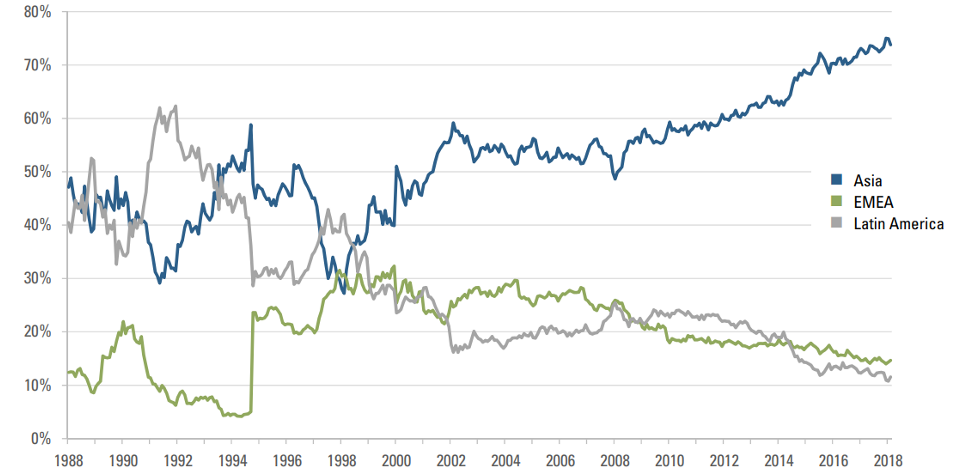 Source: MSCI. Copyright MSCI 2018. All Rights Reserved. Unpublished. PROPRIETARY TO MSCI. For illustrative purposes only. It is not possible to invest directly in any index. Past performance is no guarantee of future results. Investors have the opportunity for losses as well as profits.
Figure 3: MSCI EM Index Selected Sector Weights
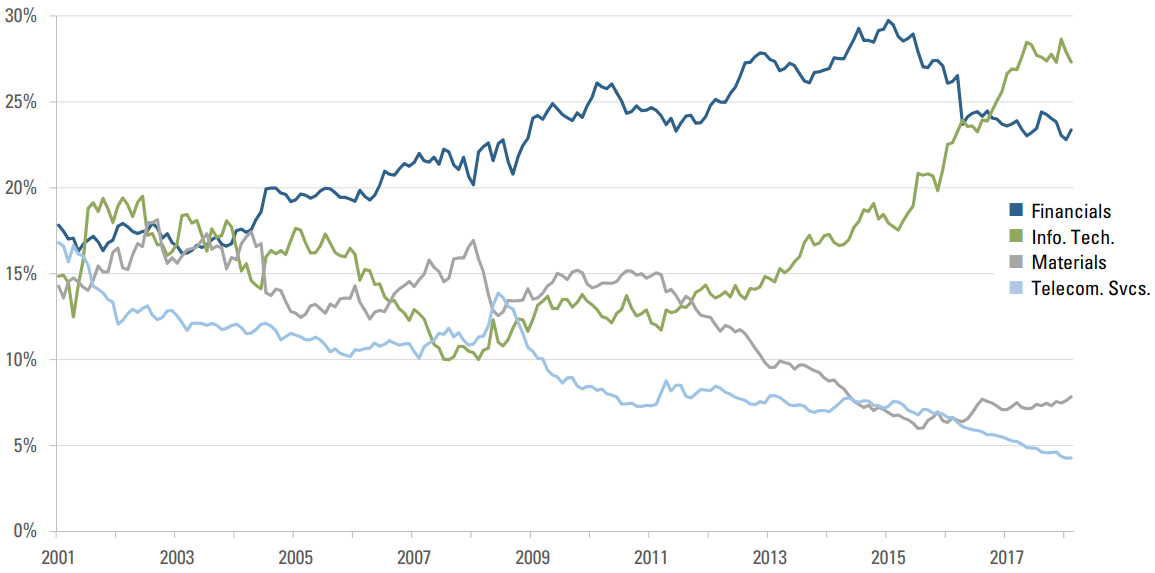 Source: MSCI. Copyright MSCI 2018. All Rights Reserved. Unpublished. PROPRIETARY TO MSCI. For illustrative purposes only. It is not possible to invest directly in any index. Past performance is no guarantee of future results. Investors have the opportunity for losses as well as profits
Looking Ahead: China's Potential Impact
China is already the single largest market in the MSCI EM Index, and its weight is likely to grow further. On June 1, 2018, MSCI added 226 Chinese large-cap A-shares to the index for the first time.2 Their inclusion is being phased in, as we discussed in our May 2018 piece, “China A-Shares, Welcome to the Emerging Markets Index.” A-shares initially comprised a 0.4% weight, reflective of inclusion of the stocks at only 2.5% of their free float-adjusted market capitalization (partial inclusion factor). Effective September 3, that adjustment factor was raised to 5% and A-shares’ weight reached 0.7%. MSCI has since announced that it will consider increasing A-shares’ weight to 2.8% in 2019 by increasing the partial inclusion factor to 20% in stages and by adding stocks listed on the tech-heavy Shenzhen ChiNext.
China’s representation in the MSCI EM index could become much larger. If large-cap A-shares were included at 100% of their free float market cap (adjusted for foreign ownership limits), China would comprise over 40% of the index and Asia close to 80%. Further, if MSCI were to include mid-cap and small-cap A-shares in the index,3 pending further development of Chinese equity markets and the regulatory environment, and if foreign ownership limits could be relaxed or eliminated, then China would represent over half of the MSCI EM Index by both market capitalization as well as number of listings.
Looking Ahead: Additional Themes
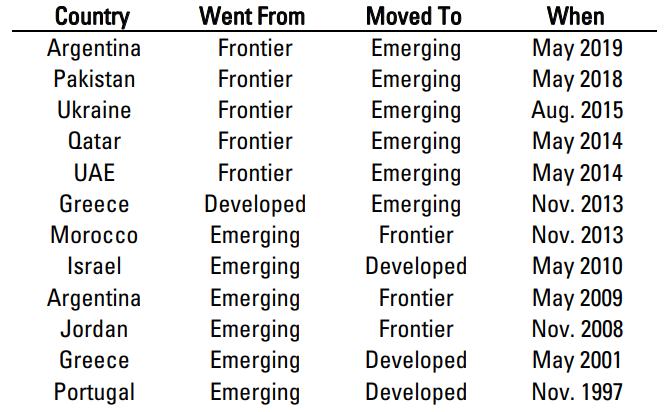
The MSCI EM Index will continue to evolve over time, reflective of future country promotions to developed markets and demotions, e.g., to frontier (see the Appendix for a history of upgrades and downgrades). MSCI has already announced that in June 2019 they will reclassify Saudi Arabia (now standalone) and Argentina (now frontier) as emerging markets. These changes may have modest short-run impacts on EM index composition, with Saudi Arabia and Argentina representing approximately 2% and 0.5% of the index, respectively, based on current market valuations. However, Saudi Arabia’s weight might increase substantially – possibly more than double – if the Kingdom were to publicly list shares in Aramco.4 A $150b float of the company would also materially increase the weight of the energy sector from 7.7% as of July 2018 to approximately 10%. MSCI has also already announced that it will consider reclassifying Kuwait from frontier to emerging during its 2019 annual market review. Kuwaiti stocks had a modest USD market cap of $85b as of July 2018 (ex-free-float adjustment), but the country’s addition would raise the profile of Gulf states in the MSCI EM Index.
Potential future reclassifications might include promotions of South Korea and Taiwan to developed market status. The two countries are the second and third largest EM Index constituents, with a combined weight exceeding 25%. Upgrades could cause large outflows from MSCI EM-benchmarked investments. Both countries had been on MSCI’s potential upgrade list for several years, but in 2014 the company removed them from consideration due to lack of progress on market accessibility. Improvement could lead to reinstatement. Such country reclassifications may represent opportunity for active investors and drag for passive, as we discussed in our 2015 paper, “Transition Strategies Around MSCI Country Reclassifications.” For index reclassification events that generate increased benchmark represention, we see statistically significant positive returns between announcement and effective dates, and we see significant negative returns when benchmark ownership decreases.
Implications of Evolving Composition
The evolution of the MSCI EM Index has actionable implications for investors. First, when evaluating historical index behavior to guide our expectations for the future, we should keep the dramatic changes in index composition in mind: lessons drawn from the past index basket may not be relevant to the current version. Beyond the evolution of region and industry composition highlighted earlier, changes in economics abound. For example, the largest countries in MSCI EM today run current account surpluses (e.g., China, South Korea, and Taiwan), whereas in the 1980s and 1990s the largest countries generally ran deficits (e.g., Brazil, Malaysia, and Mexico). As a result, the current basket is less reliant on foreign capital to remain stable and fund growth.
Second, if the MSCI EM Index becomes highly concentrated in Chinese and Asian equities, then asset allocators might consider employing separate EM ex-China (or EM ex-Asia) and China (EM Asia) benchmarks, similar to separating World ex-U.S. and U.S. allocations, or otherwise dedicating an allocation to the smaller EM countries. Doing so might help to retain exposure to the heterogeneity offered by EM, a collection of countries that vary in terms of economic and political development and associated risk exposures. As examples, Russia is a major oil exporter while India is a significant importer; Mexico and South Korea face distinct types of geopolitical risks.
Conclusion
We expect that emerging markets and associated benchmarks will continue to evolve. Asset owners and managers need to be cognizant of, and adapt to, change. Otherwise, they risk making investment decisions better suited to the very different emerging markets of the past than those of today.
Appendix
 Source: MSCI. Copyright MSCI 2018. All Rights Reserved. Unpublished. PROPRIETARY TO MSCI. For Illustrative purposes only.
- Change is relatively infrequent.
- Historically, movements between frontier and emerging (8 changes) have been more common than movements between emerging and developed (4 changes).
- Countries can change multiple times and move in both directions on the development continuum (e.g., Argentina, Greece).
Endnotes
- As of July 2018.
- A-shares are traded on-shore in China and denominated in Renminbi. The initial inclusion of Chinese equities in 1996 consisted of B-shares (Domestically Listed Foreign Investment Shares). In 2000, MSCI added Hong Kong-traded Chinese equities (Red Chips, H-shares)
- MSCI is considering adding mid-cap A-shares in 2020, which would increase the total weight of A-shares in the MSCI EM Index to 3.4%.
- Please see discussion in “Saudi Arabia Nearing MSCI EM Index Inclusion,” Acadian Asset Management, May 2018. For illustrative purposes only. This should not be considered a recommendation to buy or sell any particular security
Legal Disclaimer
These materials provided herein may contain material, non-public information within the meaning of the United States Federal Securities Laws with respect to Acadian Asset Management LLC, Acadian Asset Management Inc. and/or their respective subsidiaries and affiliated entities. The recipient of these materials agrees that it will not use any confidential information that may be contained herein to execute or recommend transactions in securities. The recipient further acknowledges that it is aware that United States Federal and State securities laws prohibit any person or entity who has material, non-public information about a publicly-traded company from purchasing or selling securities of such company, or from communicating such information to any other person or entity under circumstances in which it is reasonably foreseeable that such person or entity is likely to sell or purchase such securities.
Acadian provides this material as a general overview of the firm, our processes and our investment capabilities. It has been provided for informational purposes only. It does not constitute or form part of any offer to issue or sell, or any solicitation of any offer to subscribe or to purchase, shares, units or other interests in investments that may be referred to herein and must not be construed as investment or financial product advice. Acadian has not considered any reader's financial situation, objective or needs in providing the relevant information.
The value of investments may fall as well as rise and you may not get back your original investment. Past performance is not necessarily a guide to future performance or returns. Acadian has taken all reasonable care to ensure that the information contained in this material is accurate at the time of its distribution, no representation or warranty, express or implied, is made as to the accuracy, reliability or completeness of such information.
This material contains privileged and confidential information and is intended only for the recipient/s. Any distribution, reproduction or other use of this presentation by recipients is strictly prohibited. If you are not the intended recipient and this presentation has been sent or passed on to you in error, please contact us immediately. Confidentiality and privilege are not lost by this presentation having been sent or passed on to you in error.
Acadian’s quantitative investment process is supported by extensive proprietary computer code. Acadian’s researchers, software developers, and IT teams follow a structured design, development, testing, change control, and review processes during the development of its systems and the implementation within our investment process. These controls and their effectiveness are subject to regular internal reviews, at least annual independent review by our SOC1 auditor. However, despite these extensive controls it is possible that errors may occur in coding and within the investment process, as is the case with any complex software or data-driven model, and no guarantee or warranty can be provided that any quantitative investment model is completely free of errors. Any such errors could have a negative impact on investment results. We have in place control systems and processes which are intended to identify in a timely manner any such errors which would have a material impact on the investment process.
Acadian Asset Management LLC has wholly owned affiliates located in London, Singapore, and Sydney. Pursuant to the terms of service level agreements with each affiliate, employees of Acadian Asset Management LLC may provide certain services on behalf of each affiliate and employees of each affiliate may provide certain administrative services, including marketing and client service, on behalf of Acadian Asset Management LLC.
Acadian Asset Management LLC is registered as an investment adviser with the U.S. Securities and Exchange Commission. Registration of an investment adviser does not imply any level of skill or training.
Acadian Asset Management (Singapore) Pte Ltd, (Registration Number: 199902125D) is licensed by the Monetary Authority of Singapore. It is also registered as an investment adviser with the U.S. Securities and Exchange Commission.
Acadian Asset Management (Australia) Limited (ABN 41 114 200 127) is the holder of Australian financial services license number 291872 ("AFSL"). It is also registered as an investment adviser with the U.S. Securities and Exchange Commission. Under the terms of its AFSL, Acadian Asset Management (Australia) Limited is limited to providing the financial services under its license to wholesale clients only. This marketing material is not to be provided to retail clients.
Acadian Asset Management (UK) Limited is authorized and regulated by the Financial Conduct Authority ('the FCA') and is a limited liability company incorporated in England and Wales with company number 05644066. Acadian Asset Management (UK) Limited will only make this material available to Professional Clients and Eligible Counterparties as defined by the FCA under the Markets in Financial Instruments Directive, or to Qualified Investors in Switzerland as defined in the Collective Investment Schemes Act, as applicable.