
Reassessing Emerging Markets Equities
Key Takeaways
- Despite the underperformance of emerging market (EM) equities relative to U.S. stocks, their absolute performance in recent years has not been abnormal in historical context.
- The exceptional strength of a small number of large-cap growth stocks, however, has left EM benchmarks unusually concentrated.
- We believe that the case for EM allocations remains sound. In current context, though, we see it as especially important for EM investors to recommit to strategies that provide exposure to a diverse set of returns drivers rather than chasing recent and narrow performance trends in the asset class.
Table of contents
The case for EM equity investing has traditionally rested on a combination of rationales: in addition to improving portfolio diversification, emerging economies offer greater potential upside than developed countries, and their less efficient markets offer active strategies greater opportunity to exercise skill. Over the past decade, EM equity returns have disappointed investors. Benchmark indexes have trailed developed market (DM) counterparts, especially U.S. equities, and active strategies, generally speaking, have not generated historical levels of outperformance.
In this note, we contextualize these trends and analyze the drivers. We reaffirm our outlook for the asset class, noting that EM’s overall absolute performance does not look abnormal. But we show evidence that a narrow “one-factor bet on growth” is evident in benchmark performance and the cross section of EM stock returns.
As such, we believe that it is especially important for investors to recommit to EM strategies that reflect a diverse set of returns drivers rather than chasing recent performance trends.
Recent EM Performance and Drivers
Perceptions of recent EM equity performance have been distorted by the exceptional strength of the U.S. market. Figure 1 shows that while U.S. stocks have dominated over the past five years, EM has materially outperformed other developed markets. Moreover, on a risk-adjusted basis, recent returns of EM equities have exceeded their longer-term average, and their 20-year performance remains comparable to the U.S.’s, despite the latter’s recent run.
Figure 1: EM Performance versus DM
Through August 2020
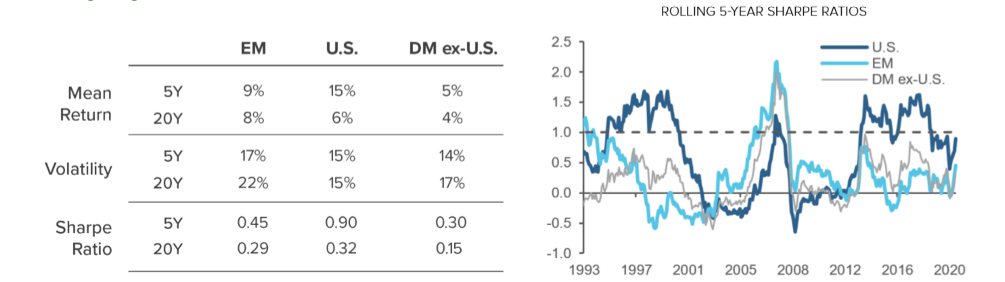
Figure 1 also offers a reminder that regional outperformance tends to be transient, emphasizing the evergreen value of geographic diversification to longp-term investors. While U.S. equities outperformed in the mid- to late-1990s, culminating in the TMT bubble, non-U.S. markets generated higher Sharpe Ratios during much of the 2000s, a period fueled by robust, broad-based global growth.
An even longer look back would show that regimes of dominance, like the one that the U.S. has enjoyed recently, are unusual in terms of their magnitude and duration. Within U.S. equities, for example, since 1926 we have seen only one comparable episode of risk-adjusted performance (Sharpe Ratio above 1) – during the 1950s. Moreover, as we have discussed elsewhere, although large-cap U.S. growth stocks have dominated a wide range of assets in recent years, periods of strong outperformance by one asset class can end abruptly.1 While it is understandably difficult for EM investors to put aside their frustration with the past underperformance, the key challenge now is to assess the outlook afresh.
That outlook is informed by an understanding of what has been driving EM’s relative performance. In Table 1, we decompose each region’s returns over the past five and twenty years into contributions from fundamentals (cash earnings growth), multiple expansion, currency effects, and dividends.2 Two features are telling. First, over the past five years, EM’s underperformance versus the U.S. has been driven by multiple contraction (-0.5% vs. +2.7%), while earnings growth across the two market segments has been fairly similar (+4.8% vs. +5.4%). Looking over time, however, we see that EM has experienced a much larger decline in earnings growth (+4.8% vs. +10.2%) than the U.S. (+5.4% vs. +6.1%).
Table 1: Returns Decomposition
Arithmetic averages, in percent
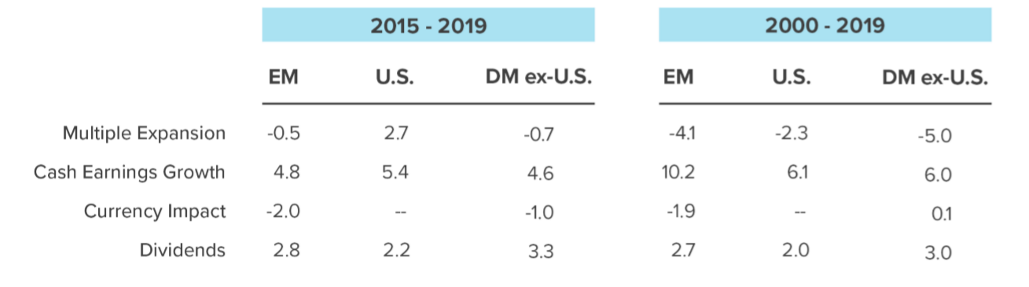
One interpretation would be that the market has rewarded the relative stability of U.S. earnings growth with multiple expansion, assuming that it will continue. This would be consistent with a view that the U.S. is the peculiar beneficiary of an enduring increase in corporate profitability that other markets, including EM, will struggle to replicate.3
Several arguments caution against simply over-extrapolating the trends of the past five years into a continuation of U.S. dominance relative to EM in terms of investment performance. First, the relevant question is not whether U.S. stocks will continue to generate more attractive fundamentals in an absolute sense, but whether the market has come to fairly price (or overprice) that likelihood. Second, there are potential headwinds to some of the trends that have benefited U.S. large- cap growth, including nationalist backlash against globalization, populist resistance to technological disintermediation of labor, and regulatory pushback on corporate size and power.
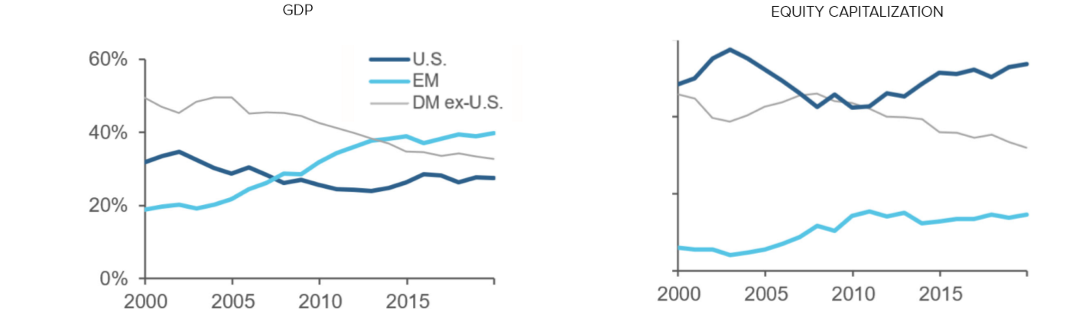
Finally, we see evidence that the market may be underestimating EM’s relative fundamental potential. Notwithstanding the sharp decline in corporate earnings growth, EM economic trends have held up comparatively well.4 Figure 2 shows that emerging economies have continued to gain global GDP share, while their (float-adjusted) equity market cap share has continued to lag.5 These observations are directly relevant to regional allocation decisions: long-term empirical analysis shows a relationship between economic growth and equity market returns. (Please see the sidebar for discussion of this point.) Moreover, in the present context, it is not clear that looking forward, structural shifts that have predominately benefited the profitability of U.S. large-cap growth stocks, including development of new lower-cost business models, will disproportionately benefit that economy (or DM more generally).
Figure 2: GDP and Public Equity Capitalization Share - EM versus DM
2000-2019
Clarifying the Relationship: Economic Growth vs. Equity Returns
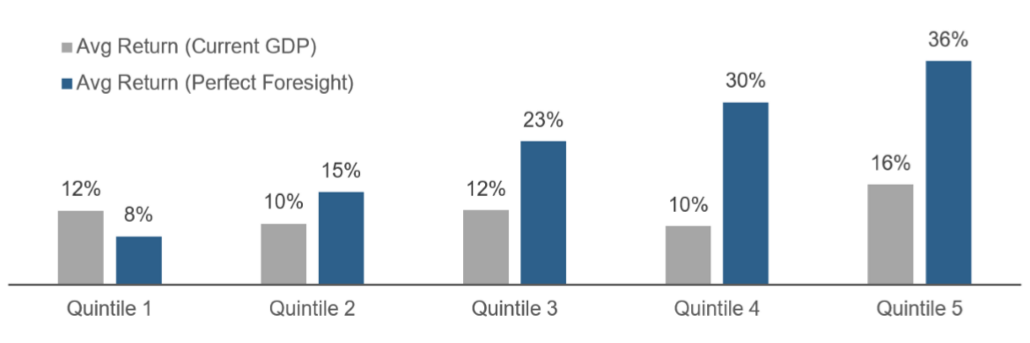
The temporal relationship between equity returns and economic growth is intuitive, yet obscured by timing issues in economic data.* By definition, traditional GDP statistics are trailing indicators, measuring activity over backward-looking periods. In addition, GDP data from national statistics bureaus often lags, in some cases by up to a year. As a result, these conventional metrics result in a poor fit between economic growth and equity returns. Figure 3 illustrates this. Each column represents average one-year returns for countries sorted into quintiles by GDP growth (1 = lowest, 5 = highest). The gray columns are based on GDP as conventionally reported. Viewed through that lens, there appears to be little relationship between growth and equity returns. But if we lead the reported GDP data by two quarters (equivalent to lagging the equity returns), as depicted in the “perfect foresight” dark blue columns, the relationship becomes clear: higher GDP growth is indeed, on average, associated with higher equity returns.
Figure 3: Equity Returns by GDP Growth Quintile
All-country universe, 1990-2019, based on annual country returns and GDP growth
* Results presented here may surprise readers who are familiar with certain academic literature on the GDP-equity return relationship. Studies have shown that the long-term relationship between per-capita GDP growth and equity returns across countries is negative. For example, see Jay R. Ritter, Economic Growth and Equity Returns, Pacific Basin Finance Journal, 13 (2005), 489-503. The analysis presented here is materially different. It uses a pooled sample (across time and countries) to clarify the shorter-term intertemporal relationship between (aggregate) GDP growth and returns that reflect both cyclical and secular effects. For similar work, see pp. 24-26 of Elroy Dimson, Paul Marsh, and Mike Staunton, The Growth Puzzle, Credit Suisse Global Investment Returns Yearbook, 2014, 17-29.
The Market’s One-Factor Bet on Growth: EM Perspective
The past few years have also seen an unusual concentration of performance within benchmark EM equities. Figure 4 demonstrates two facets of this pattern. The left panel shows that in each of the past four full years, the four largest stocks in the MSCI EM index alone have generated 25% to 35% of benchmark returns. The right panel shows that the effective number of stocks in the benchmark, as measured by the Herfindahl-Hirschman Index of concentration, has plunged.6 Roughly speaking, while the MSCI EM index nominally still contains around 1,400 constituents, it now behaves like it contains only 60, largely owing to the increasingly top-heavy nature of the index’s weights. By comparison, over most of the past 25 years, the index has behaved like it effectively contained well over 100 stocks.
Closer examination shows that the concentration of the MSCI EM index is not only unusual in its extent, but also in its character. When the index last became highly concentrated, in 2002 during the aftermath of the TMT bubble, a small but diverse set of stocks, including China Telecom, Kookmin Bank, Anglo American, and Samsung, dominated the index and generated more than 20% of its returns.7 In comparison, the stocks driving the benchmark’s recent performance have represented a relatively narrow technology-oriented group, the so-called BATTS (Baidu, Alibaba, Taiwan Semiconductor, Tencent, and Samsung).
Figure 4: EM Benchmarks Have Become Highly Concentrated
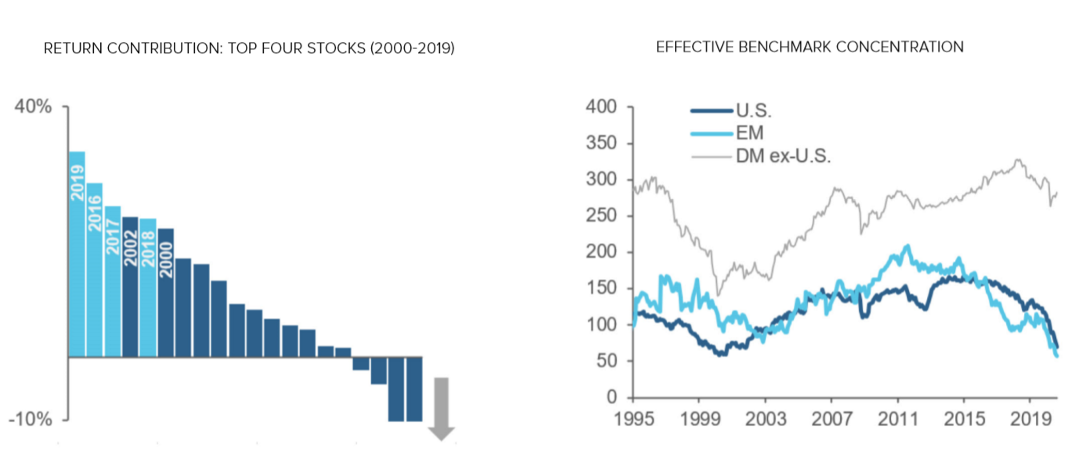
Figure 5 provides further insight, visualizing performance patterns through the lens of style indexes. The middle panel shows that from 2016-2019, growth, large-cap, and momentum indexes generated positive returns, while value and quality dragged. The left panel shows that the pattern has continued during the COVID crisis.
Figure 5: EM MSCI Factor Index Active Returns
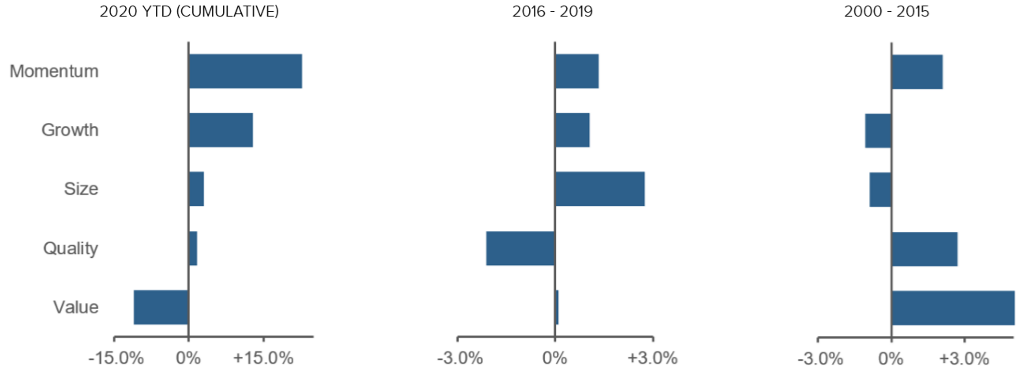
These patterns in EM performance are consistent with the manifestation of the “one-factor bet on growth” discussed above in a handful of EM large-cap stocks. A consequence is that EM strategies that have not been geared to large-cap growth have, in recent years, likely underperformed the EM cap-weighted benchmark. Such strategies would include balanced EM investing approaches that prioritize diversity across types of signals, geographies, and industries as well as strategies with mid- and small-cap orientations, seeking inefficient markets. While it is tempting for investors to chase the past performance of large-cap growth, looking forward we would advocate recommitment to EM strategies that are well diversified. Outperformance of narrow sets of drivers often ends abruptly, and there are risks to trends that have contributed to rising large-cap growth profitability, as discussed in the prior section.
Conclusion
A central challenge facing EM investors is to dispassionately reassess the investing climate following several years of relative underperformance, particularly in comparison to the U.S. Based on close inspection of trends in returns and their drivers, we believe that the case for EM allocations remains sound. Moreover, we would caution investors not to chase recent performance trends, specifically, the exceptional outperformance of a handful of large-cap growth stocks that has left EM benchmarks unusually concentrated. Instead, we would urge recommitment to more durable EM investing approaches that provide exposure to a diverse set of returns drivers, geographies, and industries.
Endnotes
- See Re-examining Diversification: 2020 Perspective, Acadian Asset Management LLC, June 2020.
- The decomposition is as follows:= Multiple Expansion + Cash Earnings Growth + Dividend Yield + Currency Effects. The decomposition covers periods ending in 2019 since annual financial statement information for 2020 is not yet available. As a result, Table 1 and the table in Figure 1 cover different date ranges. The portfolios used in the two exhibits also differ modestly, the latter being constructed from stock-level data.

- For further discussion of this topic, please see Value Revisited, Acadian Asset Management LLC, November 2019.
- See IMF GDP data available using the item NGDP_RPCH for the USA in the IMF WEO database.
- Although the large gap between GDP and market cap shares may reflect relative undervaluation of EM equities, we do not expect a close relationship between the two. The wedge reflects many factors, including public capital market development as well as accessibility and investability constraints. Moreover, changes that would increase market cap share, e.g., privatization or issuance, may not benefit current public equity holders. Please contact us to discuss in further detail.
- We show index concentration using the Herfindahl-Hirschman indexcalculated over all stocks in the index/portfolio). For equally weighted baskets, the HHI exactly matches the number of stocks in the underlying portfolio. For cap-weighted baskets, it returns an effective number of stocks that can be interpreted as a measure of index concentration.

- The companies mentioned are for illustrative purposes only and are not a recommendation to buy or sell a specific security.
Hypothetical Legal Disclaimer
Acadian is providing hypothetical performance information for your review as we believe you have access to resources to independently analyze this information and have the financial expertise to understand the risks and limitations of the presentation of hypothetical performance. Please immediately advise if that is not the case.
Hypothetical performance results have many inherent limitations, some of which are described below. No representation is being made that any account will or is likely to achieve profits or losses similar to those shown. In fact, there are frequently sharp differences between hypothetical performance results and the actual performance results subsequently achieved by any particular trading program.
One of the limitations of hypothetical performance results is that they are generally prepared with the benefit of hindsight. In addition, hypothetical trading does not involve financial risk, and no hypothetical trading record can completely account for the impact of financial risk in actual trading. For example, the ability to withstand losses or to adhere to a particular trading program in spite of trading losses are material points which can also adversely affect actual trading results. There are numerous other factors related to the markets in general or to the implementation of any specific trading program which cannot be fully accounted for in the preparation of hypothetical performance results and all of which can adversely affect actual trading results.
Legal Disclaimer
These materials provided herein may contain material, non-public information within the meaning of the United States Federal Securities Laws with respect to Acadian Asset Management LLC, Acadian Asset Management Inc. and/or their respective subsidiaries and affiliated entities. The recipient of these materials agrees that it will not use any confidential information that may be contained herein to execute or recommend transactions in securities. The recipient further acknowledges that it is aware that United States Federal and State securities laws prohibit any person or entity who has material, non-public information about a publicly-traded company from purchasing or selling securities of such company, or from communicating such information to any other person or entity under circumstances in which it is reasonably foreseeable that such person or entity is likely to sell or purchase such securities.
Acadian provides this material as a general overview of the firm, our processes and our investment capabilities. It has been provided for informational purposes only. It does not constitute or form part of any offer to issue or sell, or any solicitation of any offer to subscribe or to purchase, shares, units or other interests in investments that may be referred to herein and must not be construed as investment or financial product advice. Acadian has not considered any reader's financial situation, objective or needs in providing the relevant information.
The value of investments may fall as well as rise and you may not get back your original investment. Past performance is not necessarily a guide to future performance or returns. Acadian has taken all reasonable care to ensure that the information contained in this material is accurate at the time of its distribution, no representation or warranty, express or implied, is made as to the accuracy, reliability or completeness of such information.
This material contains privileged and confidential information and is intended only for the recipient/s. Any distribution, reproduction or other use of this presentation by recipients is strictly prohibited. If you are not the intended recipient and this presentation has been sent or passed on to you in error, please contact us immediately. Confidentiality and privilege are not lost by this presentation having been sent or passed on to you in error.
Acadian’s quantitative investment process is supported by extensive proprietary computer code. Acadian’s researchers, software developers, and IT teams follow a structured design, development, testing, change control, and review processes during the development of its systems and the implementation within our investment process. These controls and their effectiveness are subject to regular internal reviews, at least annual independent review by our SOC1 auditor. However, despite these extensive controls it is possible that errors may occur in coding and within the investment process, as is the case with any complex software or data-driven model, and no guarantee or warranty can be provided that any quantitative investment model is completely free of errors. Any such errors could have a negative impact on investment results. We have in place control systems and processes which are intended to identify in a timely manner any such errors which would have a material impact on the investment process.
Acadian Asset Management LLC has wholly owned affiliates located in London, Singapore, and Sydney. Pursuant to the terms of service level agreements with each affiliate, employees of Acadian Asset Management LLC may provide certain services on behalf of each affiliate and employees of each affiliate may provide certain administrative services, including marketing and client service, on behalf of Acadian Asset Management LLC.
Acadian Asset Management LLC is registered as an investment adviser with the U.S. Securities and Exchange Commission. Registration of an investment adviser does not imply any level of skill or training.
Acadian Asset Management (Singapore) Pte Ltd, (Registration Number: 199902125D) is licensed by the Monetary Authority of Singapore. It is also registered as an investment adviser with the U.S. Securities and Exchange Commission.
Acadian Asset Management (Australia) Limited (ABN 41 114 200 127) is the holder of Australian financial services license number 291872 ("AFSL"). It is also registered as an investment adviser with the U.S. Securities and Exchange Commission. Under the terms of its AFSL, Acadian Asset Management (Australia) Limited is limited to providing the financial services under its license to wholesale clients only. This marketing material is not to be provided to retail clients.
Acadian Asset Management (UK) Limited is authorized and regulated by the Financial Conduct Authority ('the FCA') and is a limited liability company incorporated in England and Wales with company number 05644066. Acadian Asset Management (UK) Limited will only make this material available to Professional Clients and Eligible Counterparties as defined by the FCA under the Markets in Financial Instruments Directive, or to Qualified Investors in Switzerland as defined in the Collective Investment Schemes Act, as applicable.