Opportunity Beyond U.S. Shores
Key Takeaways
-
We encourage U.S. investors to look beyond their shores and consider opportunities in international equity markets.
-
EAFE and EM equities look appealing relative to the U.S. on a valuation basis. Growthy speculation that has particularly benefited the U.S. has not fully abated. Value stocks look unusually cheap outside of the U.S. and especially in EAFE.
-
While the dollar’s strength in recent years likely dissuaded some U.S. investors from allocating overseas, that headwind may have ebbed.
Table of contents
For more than a decade after the Global Financial Crisis (GFC), U.S. equities dramatically outperformed international markets. Dating back to 2010, MSCI’s U.S. benchmark has delivered an annualized total return more than twice that of EAFE and more than four times that of EM.1 That run of dominance left many investors with regret over non-U.S. allocations and, in many cases, an uncomfortable task of defending them.
Nevertheless, we caution investors not to chase this past performance in their allocations. In fact, in present context, we believe international equities look comparatively attractive relative to the U.S. on the basis of valuations. Moreover, an era of dollar appreciation, which likely dissuaded U.S. investors from allocating overseas, may be ending.
Risks of Chasing Past U.S. Performance
Based on the U.S. market’s dominant run after the GFC, many investors despaired of being adequately rewarded by foreign holdings and narrowed their focus to the U.S. But such periods of dominance inevitably end, sometimes abruptly.
As a cautionary example, consider Japan in 1990. After five years of spectacular outperformance amid popular narratives anointing the country as the next economic superpower, how many investors predicted—and were willing to put money behind the view—that Japan would massively underperform the global market over the next decade?
Moreover, in an investment industry plagued by short memories, how many investors recall that from 2003 to 2007 EAFE and EM outperformed the U.S. market by over 9% and 22% per annum, respectively?
Such examples highlight the risks of allowing past performance to over-influence regional allocations.
International Equities: Attractive Valuations
At present, international equities look attractive relative to the U.S. on the basis of valuations. By one measure, the U.S. equity market recently has grown so expensive that the cap-weighted index offers little compensation for bearing risk. As the grey trace in Figure 1 shows, U.S. forward earnings yields are barely above returns on cash, the margin having plunged to its lowest level since the TMT bubble 20 years ago. By contrast, in key EAFE countries and in EM they remain several points above short-term interest rates and unexceptional by historical standards.
Figure 1: Valuations — Forward Earnings Yields Minus Short-Term Interest Rates
Data through April 2023
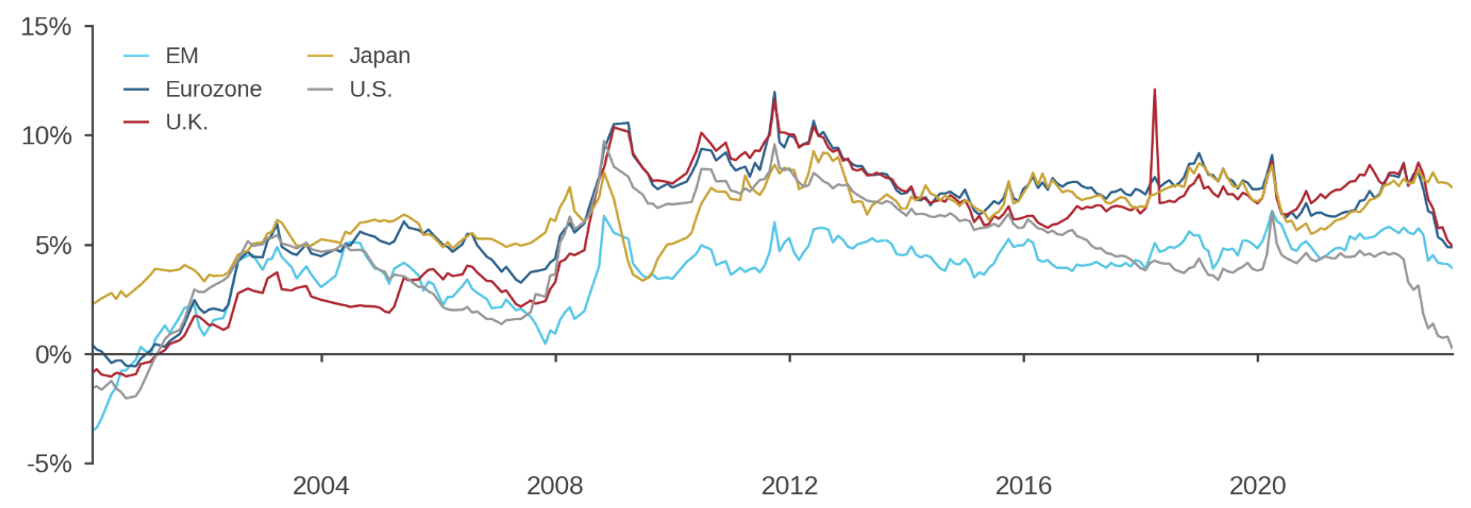
Several related factors have contributed to this divergence across geographies. First, U.S. price-to-earnings multiples have expanded apace with other regions even though the Federal Reserve has tightened more aggressively than other central banks.
Second, speculative pressures in growthy assets that built up from 2017 to 2021 have not fully abated, despite the 2022 market drawdown. The tech-heavy U.S. was the epicenter of that speculation, a “one-factor bet on growth” that we’ve chronicled extensively in prior research.2 Growth multiples there remain lofty both by historical standards and relative to EAFE and EM. (Figure 2, left panel)
Figure 2: Price to Forward Earnings Ratios
Data through April 2023
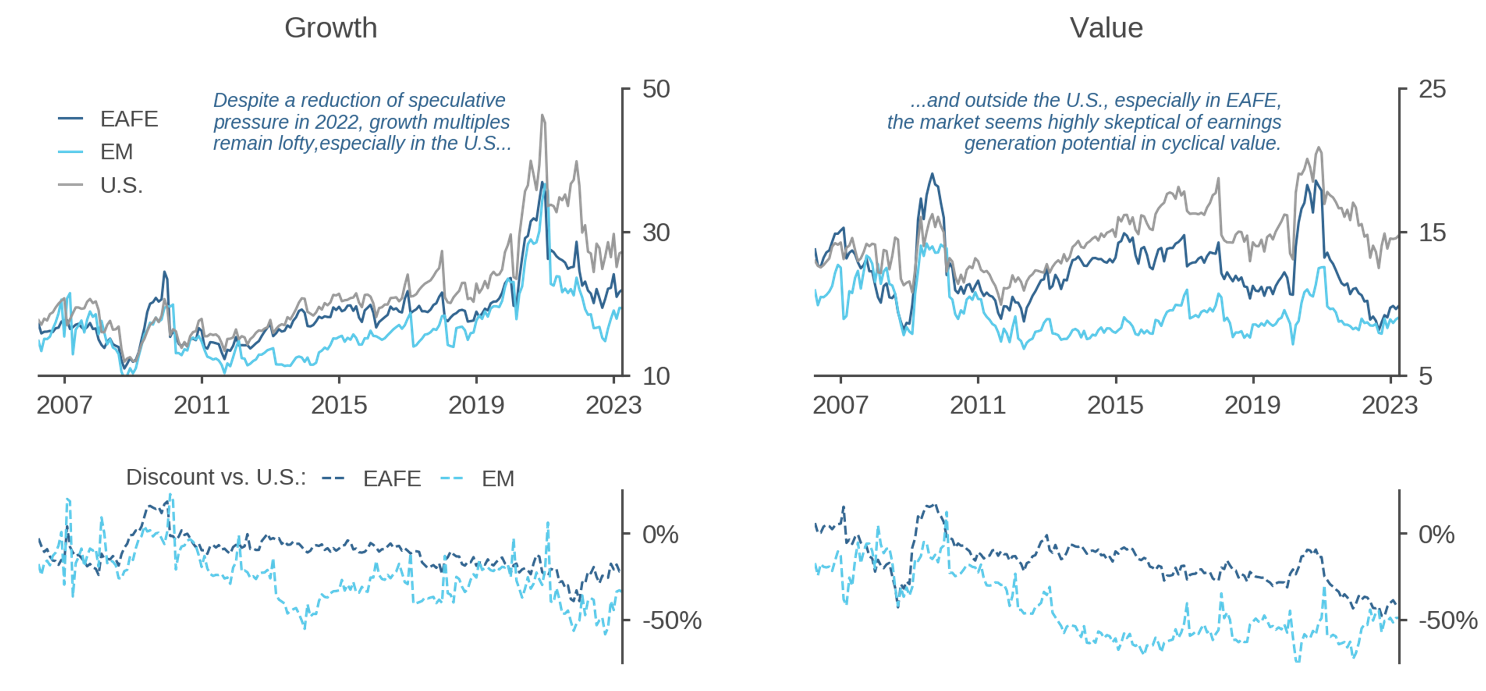
Finally, value has become historically cheap in EAFE. Relative to the U.S., the forward P/E for value in EAFE is as low as it has been in at least 15 years. (Figure 2, right panel) The market seems deeply skeptical of earnings generation potential in non-U.S. value stocks, perhaps in part due to the elevated geopolitical uncertainty and comparatively severe deterioration in consumer and business sentiment that was inflicted on Europe by the war in Ukraine.3
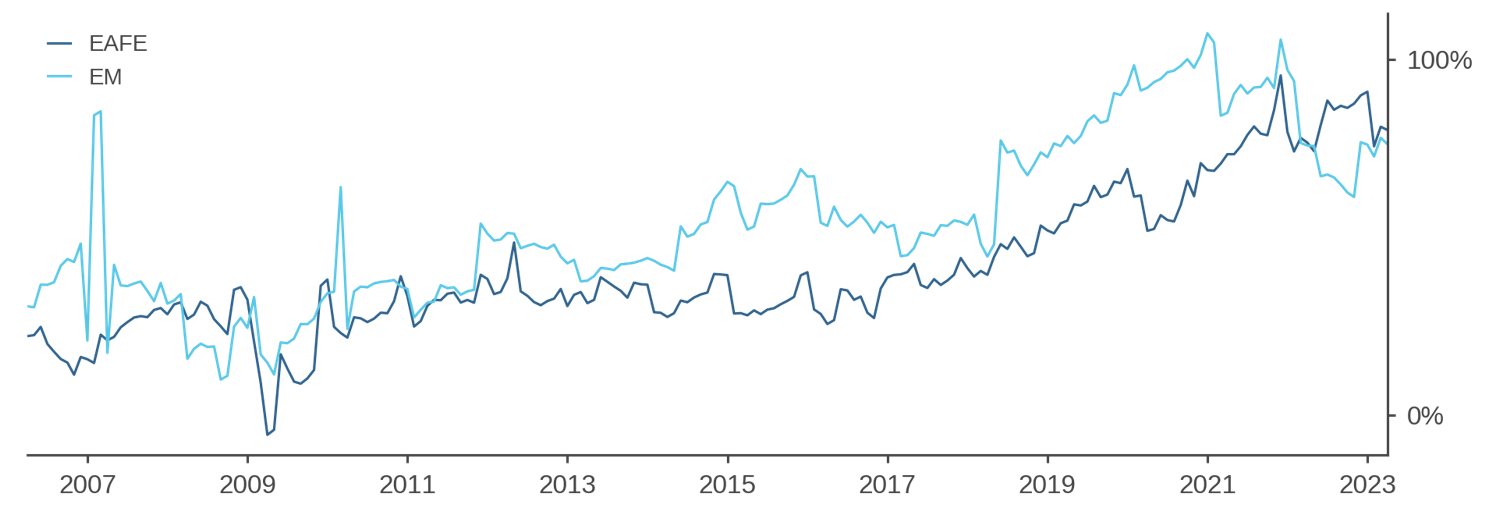
Given this environment, we believe that the balance of risks favors EAFE and EM allocations relative to the U.S. Moreover, a corollary of this view is that value-oriented investing approaches currently look appealing in those international markets. As evidence, Figure 3 combines the relative expensiveness of growth and cheapness of value from the bottom panels of Figure 2 into a single metric. The chart shows that growth multiples in both EAFE and EM are historically elevated relative to value multiples, which suggests an attractive opportunity set for active strategies that seek to benefit from reversion of mispriced fundamentals.
Figure 3: Growth to Value Premium in International Markets
Data through April 2023
Dollar Headwinds Ebbing?
For many years, an appreciating dollar eroded the performance of unhedged overseas equity allocations for U.S. investors. For example, during the first year of the Federal Reserve’s aggressive hiking cycle, from March 2022 to February 2023, the dollar’s strength reduced unhedged USD EAFE returns by more than 8%.4 More broadly, as Figure 4 shows, dollar appreciation and its consequent negative impact on international equity returns was for many years a consistent feature of the post-GFC environment.
Figure 4: Post-GFC Strength of the U.S. Dollar and its Impact on USD-Based Returns
Data through April 2023
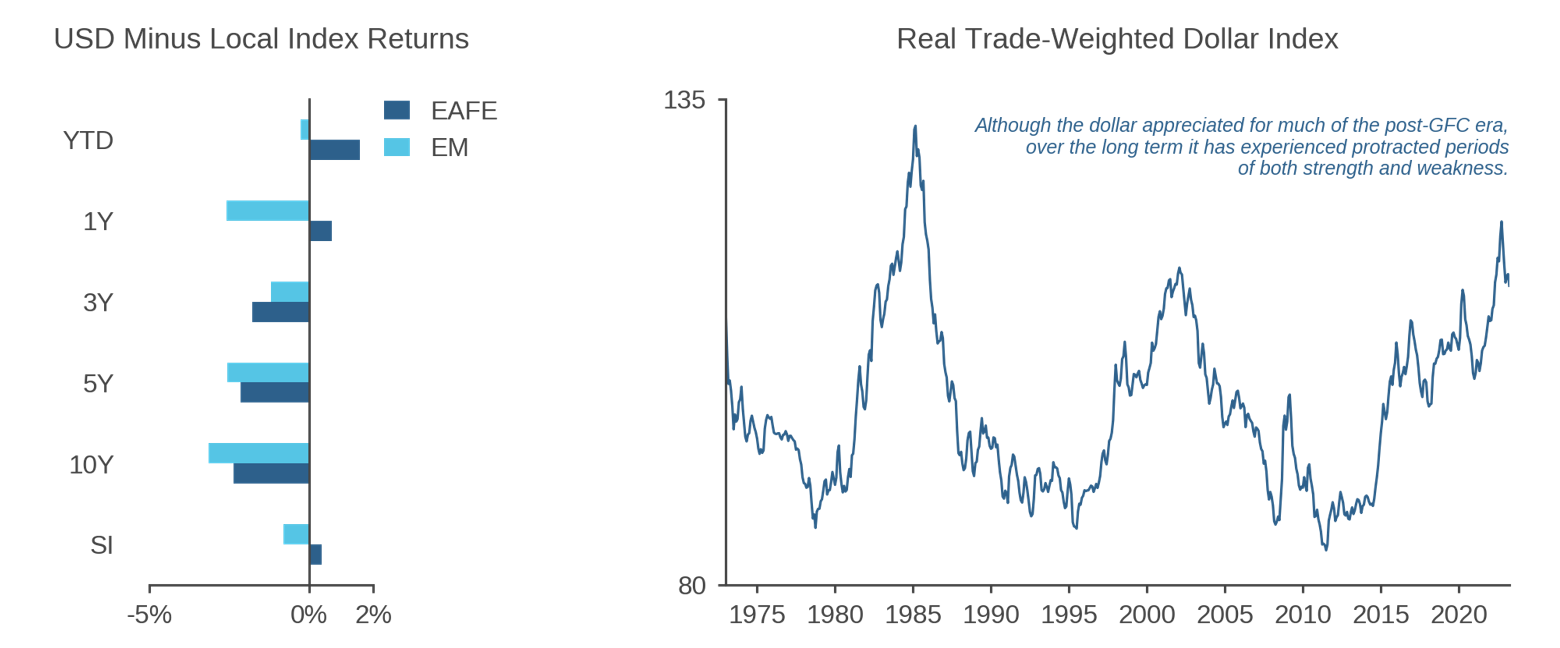
But we do not see the post-GFC experience as representative of what investors should expect going forward. Returning to the left panel of Figure 4, while USD-based versions of EAFE and EM have trailed local currency versions of the indexes for many holding periods of up to a decade, the bottom bars of the chart show that since-inception returns, which start in 2001, are quite similar. Consistent with that observation, the long history of the Real Trade-Weighted Dollar Index (right panel) shows protracted periods of dollar depreciation as well as appreciation. In other words, while dollar appreciation has in recent years eroded USD returns on international investments, it has at other times provided a tailwind.5
In fact, the currency headwind has diminished during the first part of 2023. The dollar has softened against other major currencies since late 2022 as the U.S. inflation outlook has cooled, sparking expectations that the Federal Reserve might be closer to the end of its tightening program than the ECB or BOE. Although currency markets remain highly sensitive to macroeconomic data and central bank messaging, our Multi-Asset Strategies team’s near-term forecast for the dollar versus other DM currencies remains modestly bearish, reflecting the relative impacts of falling commodity prices, monetary policy, and inflation.
Conclusion
Pressure to chase the dominant performance of growthy U.S. equities during the post-GFC environment left some U.S.-based investors underexposed to investment opportunities beyond their shores. With an era of low interest rates apparently at an end, we believe that U.S.-based investors should revisit the case for international equities afresh and value-oriented active approaches in particular.
Endnotes
- From 2010 to April 2023, USD returns (net dividends): MSCI USA +346.7%, MSCI EAFE +95.6%, MSCI EM +35.9%.
- See, for example, Growth Versus Value: End of an Era?, Acadian, November 2022 and International Equities: Timely Appeal, Acadian, February 2022 (available upon request).
- See European Equities: Making Sense of a Peculiar Era, Acadian, May 2023
- Versus a hypothetical (and uninvestible) “local currency” version of the index. The spread between local and USD index returns is not an indication of the performance impact of hedging foreign currency risk to USD.
- In addition to the empirical observations, there are conceptual reasons to believe that U.S. investors should not expect a material return, either positive or negative, from exposure to other DM currencies. For DM equity portfolios, currency exposure generally only contributes modestly to portfolio risk, and the sign of the covariation between currency and equity returns isn’t consistent. As such, investors should not necessarily expect to be compensated for it. We view EM currencies differently, as “risk assets” that tend to contribute a larger fraction of portfolio risk than in DM. Moreover, currency-equity covariation has generally raised portfolio risk for USD-based EM investors. As such, we would expect that over the long term, the market generally compensates U.S. investors with a premium for bearing risk in EM investments. In other words, theory suggests that EM equity portfolios should generate absolute returns that are higher in USD than in local terms but similar performance on a risk adjusted basis (assuming the risk premium is fair). For in-depth discussion of currency risk in international equity portfolios and currency hedging considerations, see The Currency Exposure in Your Equity Portfolio: Beyond the Knee-Jerk Response, Acadian, March 2019.
Hypothetical Legal Disclaimer
Acadian is providing hypothetical performance information for your review as we believe you have access to resources to independently analyze this information and have the financial expertise to understand the risks and limitations of the presentation of hypothetical performance. Please immediately advise if that is not the case.
Hypothetical performance results have many inherent limitations, some of which are described below. No representation is being made that any account will or is likely to achieve profits or losses similar to those shown. In fact, there are frequently sharp differences between hypothetical performance results and the actual performance results subsequently achieved by any particular trading program.
One of the limitations of hypothetical performance results is that they are generally prepared with the benefit of hindsight. In addition, hypothetical trading does not involve financial risk, and no hypothetical trading record can completely account for the impact of financial risk in actual trading. For example, the ability to withstand losses or to adhere to a particular trading program in spite of trading losses are material points which can also adversely affect actual trading results. There are numerous other factors related to the markets in general or to the implementation of any specific trading program which cannot be fully accounted for in the preparation of hypothetical performance results and all of which can adversely affect actual trading results.
Legal Disclaimer
These materials provided herein may contain material, non-public information within the meaning of the United States Federal Securities Laws with respect to Acadian Asset Management LLC, Acadian Asset Management Inc. and/or their respective subsidiaries and affiliated entities. The recipient of these materials agrees that it will not use any confidential information that may be contained herein to execute or recommend transactions in securities. The recipient further acknowledges that it is aware that United States Federal and State securities laws prohibit any person or entity who has material, non-public information about a publicly-traded company from purchasing or selling securities of such company, or from communicating such information to any other person or entity under circumstances in which it is reasonably foreseeable that such person or entity is likely to sell or purchase such securities.
Acadian provides this material as a general overview of the firm, our processes and our investment capabilities. It has been provided for informational purposes only. It does not constitute or form part of any offer to issue or sell, or any solicitation of any offer to subscribe or to purchase, shares, units or other interests in investments that may be referred to herein and must not be construed as investment or financial product advice. Acadian has not considered any reader's financial situation, objective or needs in providing the relevant information.
The value of investments may fall as well as rise and you may not get back your original investment. Past performance is not necessarily a guide to future performance or returns. Acadian has taken all reasonable care to ensure that the information contained in this material is accurate at the time of its distribution, no representation or warranty, express or implied, is made as to the accuracy, reliability or completeness of such information.
This material contains privileged and confidential information and is intended only for the recipient/s. Any distribution, reproduction or other use of this presentation by recipients is strictly prohibited. If you are not the intended recipient and this presentation has been sent or passed on to you in error, please contact us immediately. Confidentiality and privilege are not lost by this presentation having been sent or passed on to you in error.
Acadian’s quantitative investment process is supported by extensive proprietary computer code. Acadian’s researchers, software developers, and IT teams follow a structured design, development, testing, change control, and review processes during the development of its systems and the implementation within our investment process. These controls and their effectiveness are subject to regular internal reviews, at least annual independent review by our SOC1 auditor. However, despite these extensive controls it is possible that errors may occur in coding and within the investment process, as is the case with any complex software or data-driven model, and no guarantee or warranty can be provided that any quantitative investment model is completely free of errors. Any such errors could have a negative impact on investment results. We have in place control systems and processes which are intended to identify in a timely manner any such errors which would have a material impact on the investment process.
Acadian Asset Management LLC has wholly owned affiliates located in London, Singapore, and Sydney. Pursuant to the terms of service level agreements with each affiliate, employees of Acadian Asset Management LLC may provide certain services on behalf of each affiliate and employees of each affiliate may provide certain administrative services, including marketing and client service, on behalf of Acadian Asset Management LLC.
Acadian Asset Management LLC is registered as an investment adviser with the U.S. Securities and Exchange Commission. Registration of an investment adviser does not imply any level of skill or training.
Acadian Asset Management (Singapore) Pte Ltd, (Registration Number: 199902125D) is licensed by the Monetary Authority of Singapore. It is also registered as an investment adviser with the U.S. Securities and Exchange Commission.
Acadian Asset Management (Australia) Limited (ABN 41 114 200 127) is the holder of Australian financial services license number 291872 ("AFSL"). It is also registered as an investment adviser with the U.S. Securities and Exchange Commission. Under the terms of its AFSL, Acadian Asset Management (Australia) Limited is limited to providing the financial services under its license to wholesale clients only. This marketing material is not to be provided to retail clients.
Acadian Asset Management (UK) Limited is authorized and regulated by the Financial Conduct Authority ('the FCA') and is a limited liability company incorporated in England and Wales with company number 05644066. Acadian Asset Management (UK) Limited will only make this material available to Professional Clients and Eligible Counterparties as defined by the FCA under the Markets in Financial Instruments Directive, or to Qualified Investors in Switzerland as defined in the Collective Investment Schemes Act, as applicable.
Biographies