Multi-asset investing appeals as a potential source of diversifying returns, but curious investors are faced with an extremely diverse universe of strategies, which includes categories such as traditional balanced mandates, global macro hedge funds, risk parity strategies, CTAs, alternative risk premia, etc. To make decisions, an allocator needs to fully understand a strategy’s investment objectives as well as its potential sources of risk and return. In this note, we aim to identify the similarities and differences between Acadian’s flagship Multi-Asset Absolute Return Strategy (MAARS) and some common types of multi-asset strategies.
Acadian’s Multi-Asset Absolute Return Strategy (MAARS) diversifies equity and bond risk and aims to deliver:
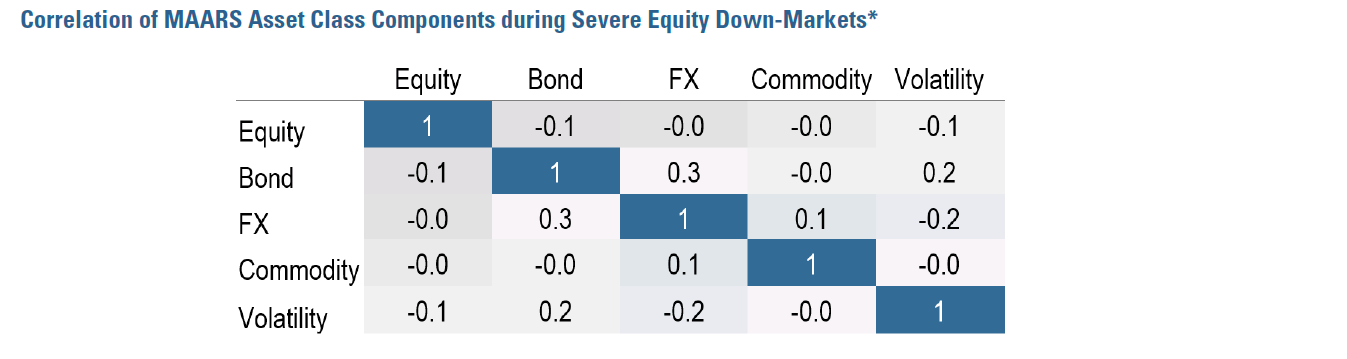
The investment process is systematic and captures a broad set of diversified return sources across five asset classes (equities, bonds, FX, commodities and volatility) and about 100 underlying markets. These potential return sources are captured via factor forecasts and tend to be uncorrelated to one another, even during periods of market stress.
For everything we do at Acadian, our philosophy is grounded in the belief that markets are inefficiently priced as a result of investor behavior, which is often reinforced by structural features. Specifically, in the case of multi-asset investing, there are institutional constraints to the transfer of information from one asset class to another, that create challenges in the arbitraging of information across asset classes as well as within them.
Potential return sources: Very diverse – include asset specific and cross asset factors, market betas
Risk management: Sophisticated and holistic (across all asset classes)
Portfolio construction: Holistic process
What Strategies Should Acadian’s MAARS Be Compared With?
While the multi-asset landscape and its terminology can appear overwhelming, in the vast majority of cases there are clear differentiators to Acadian’s approach. Risk parity, for example, as we will see below, is long-only and its returns are driven by exposure to market betas, while MAARS is absolute return long/short oriented. In fact, MAARS’ returns show very little correlation with most multi-asset strategies and therefore, we believe would be additive to most multi-asset investment programs.
Most frequently, MAARS is compared to alternative risk premia (ARP; also sometimes referred to as style premia) strategies. The prevalence of ARP and some similarities that exist between ARP and MAARS merit a more detailed look. We have also included some thoughts on other important multi-asset strategies.
Comparison To Alternative Risk Premia Strategies
ARP strategies have grown significantly over the last few years. They seek to provide exposure to documented market anomalies or risk premia, typically within asset classes. They are offered by investment managers and investment banks. While they share many similarities with Acadian’s MAARS, they also differ in important ways.
Similarities:
-
Systematic investment approach: MAARS and ARP use a systematic investment approach, which seeks to exploit return opportunities associated with behavioral or risk-based anomalies.
-
Diversified return sources: Both MAARS and ARP rely on diversified return sources across multiple asset classes. Equally important, both tend to have low correlations to equity and bond markets, and rely on long/ short cross-sectional positions within each asset class to generate most of their returns.
-
Asset-specific factors: ARP strategies are based on asset-specific factors across multiple asset classes, which are grouped into Value, Carry, Quality, and Momentum. MAARS also uses these types of factors. However, contrary to generic ARP strategies, MAARS contains multiple factors within each thematic grouping (Value, Carry, etc.) in order to avoid concentration in any single idea. Moreover, factors are carefully constructed with the understanding of the market micro structure of each asset class.
Differences:
- Cross-asset macro factors: ARP strategies tend to exclusively rely on asset-specific factors described above. However, MAARS also uses macro factors to capture linkages across asset classes. These factors reflect economic intuition and are grouped into broad macro themes such as Growth, Inflation, and Stimulus. For example, a recent increase in a country’s bond yields is a sign of stimulus withdrawal and is negative for that country’s future equity returns, but positive for that country’s future currency return. Macro factors provide different sources of return and nicely complement what is captured by traditional asset-specific factors.
- Portfolio construction and risk management: MAARS portfolios are constructed holistically, allocating to assets as basic building blocks. MAARS uses proprietary models to generate return and risk forecasts across all assets. This full set of asset return and risk forecasts allows us to simultaneously compare the return and risk profile of assets within and across asset classes in a truly holistic fashion.
Unlike ARP strategies, which first translate individual factor forecasts into factor portfolios and then aggregate these portfolios (“factor investing”), MAARS takes individual (asset-specific and macro) factor forecasts and aggregates them, thus generating return forecasts for each asset.
We believe that assets and the factors that forecast their returns are like two sides of the same coin, both of which have to be managed when constructing a portfolio. It bears noting, though, that assets tend to be well-defined and observable, making portfolio construction, risk management, and client communication easier and more intuitive. For example, an optimal allocation to the Australian dollar should take into account interactions with related assets, including the New Zealand dollar, Australian equities, Australian bonds, and industrial metals. Factors, in contrast, are more of a construct of the mind, their behavior depending on specific choices of construction and varying over time, as the composition of associated factor portfolios changes.
Main ways ARP differs from Acadian’s MAARS: ARP has little, if any, use of cross-asset factors and builds a portfolio of factors – not a portfolio of assets. Portfolio construction is not necessarily holistic across assets and asset classes.
Comparison To Risk Parity Strategies
Even though risk parity strategies also invest across multiple asset classes and balance portfolio risk, they are quite different from Acadian’s MAARS. Risk parity strategies attempt to generate returns by taking long exposures to broad asset class betas (equity, bond, and commodity markets), and they seek to achieve balanced risk (“risk parity”) through the use of leverage. In contrast, MAARS seeks to generate most of its returns from cross-sectional, long/short, intra-asset class exposures (i.e., not broad asset-class betas). MAARS does have modest exposure to asset-class betas via its long-term allocation component. This long-term component of the MAARS strategy is similar to a risk parity strategy.
Similar to risk parity, MAARS seeks to have a balanced exposure to diverse return sources and will use leverage to achieve diversification.
Main ways risk parity differs from MAARS: Risk parity is long-only; has no return forecasts; relies on market betas performing well.
Comparison To Long-Only Global Asset Allocation (GAA) Strategies
Long-only global asset allocation strategies are also multi-asset, but relative to Acadian’s MAARS are even less balanced in terms of risk than risk parity. Even though asset class coverage in GAA strategies has expanded from standard 60% equity / 40% bond balanced funds, the majority of the risk in these strategies still comes from equity market beta, as these strategies typically do not use leverage.
Main ways GAA differs from MAARS: Long-only; dominated by equity risk; asset class silos mostly.
Comparison To CTAs
CTAs (aka managed futures or trend following strategies) rely on a single factor theme (momentum) applied across asset classes. For Acadian’s MAARS, time-series and cross-sectional momentum are important components, but momentum is just one of many factor themes used to forecast asset returns.
Main ways CTAs differ from MAARS: CTAs are based on a single factor theme (momentum). Managers usually promote a somewhat different return profile (so-called “smile” – downside protection), which usually does not protect during reversals but often delivers performance in bear markets.
Comparison To “Idiosyncratic” Strategies
Idiosyncratic strategies can be thought of as “go anywhere” strategies. They are centered on a manager or a team of managers whose job it is to identify profitable trades within and across asset classes and to combine them in a risk-controlled way. These strategies can be eclectic, incorporating some systematic elements, but at heart they are discretionary. Another way to look at them is as “macro light.”
Main ways idiosyncratic strategies differ from Acadian’s MAARS: They are a collection of trades with a strong emphasis on risk management. MAARS systematically evaluates a wide range of markets.
Conclusion
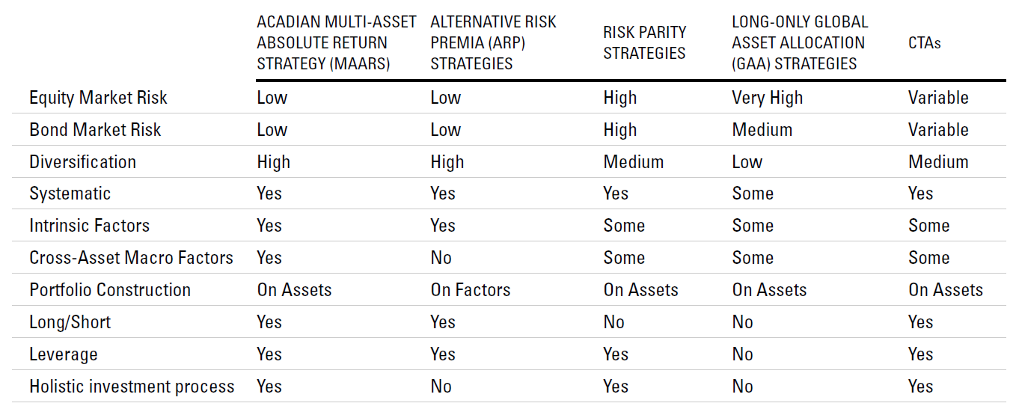
As highlighted in the appended table, there are a multitude of approaches in today’s multi-asset investment landscape that vary considerably in their sources of risk and return and general philosophies of building portfolios. Although most often compared to ARP due to a number of similarities between the two, Acadian’s MAARS strategy has many points of differentiation not only when held up against ARP, but even more so when compared with the broad spectrum of strategies we’ve discussed.
At its core, MAARS holds true to Acadian’s core philosophies that speak to the importance of breadth, diversification, and prudent incorporation of both return and risk forecasts into the portfolio construction process. Drawing from both asset-specific factors and cross-asset macro factors, we aim to take advantage of the opportunities presented by imparting leverage and also allowing expression of negative forecasts through short positions. We believe that these features create an optimal approach to holistically building multi-asset portfolios.
Source: Acadian. For illustrative purposes only.
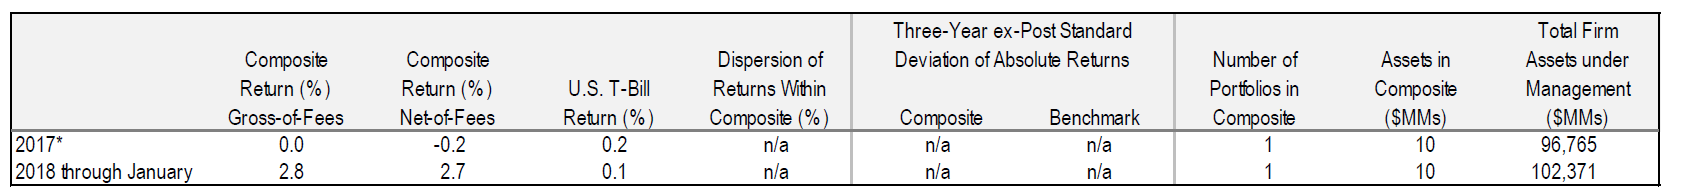
*Performance Inception: November 1, 2017. This composite was created on December 1, 2017. All figures stated in USD.
Acadian Asset Management claims compliance with the Global Investment Performance Standards (GIPS®) and has prepared and presented this report in compliance with the GIPS standards. Acadian Asset Management has been independently verified for the periods January 1, 1994 through September 30, 2017.1 A copy of the verification report is available upon request. Verification assesses whether (1) the firm has complied with all the composite construction requirements of the GIPS standards on a firm-wide basis and (2) the firm’s policies and procedures are designed to calculate and present performance in compliance with the GIPS standards. Verification does not ensure the accuracy of any specific composite presentation. Reference to the benchmark is for comparative purposes only and is not intended to indicate that the composite will contain the same investments as the benchmark. Investors have the opportunity for losses as well as profits. Past performance is no guarantee of future results. Acadian Asset Management is an investment adviser specializing in global equity management. Acadian Asset Management is defined to include assets managed by Acadian Asset Management LLC, an investment adviser registered with and regulated by the United States Securities and Exchange Commission, as well as assets managed by its four wholly-owned affiliates, Acadian Asset Management (Australia) Limited (ABN 41 114 200 127), Acadian Asset Management (Japan), registered with the Kanto Local Financial Bureau, Acadian Asset Management Singapore Pte Ltd, (Registration Number: 199902125D) is licensed by the Monetary Authority of Singapore, and Acadian Asset Management (UK) Limited, authorized and regulated by the Financial Conduct Authority of the United Kingdom. On June 30, 2015, Acadian acquired the assets of Acadian’s Australian office.
Methodology: Returns are net of estimated foreign withholding taxes on dividends, interest, and capital gains. As of January 1, 2010 Acadian’s methodology was augmented to produce a more accurate gross return figure by eliminating modest cash flows such as securities lending income and custodial fees which are regarded as independent of the investment management process; the reinvestment of all income and trading expenses continue to be included. Gross returns will be reduced by investment advisory fees and other expenses. Monthly composite results are asset-weighted by beginning-of-month asset values of member portfolios which are geometrically linked to arrive at the annual composite return. Net-of-fee performance is accrued on a monthly basis and is calculated using the highest management fee as described in section 2A of the firm’s Form ADV for the investment process utilized to manage this strategy; such form is available upon request. Net-net-of-fees additionally include incentive fees which, when applicable, are also accrued on a monthly basis. The standard fee schedule for accounts managed with this product is 1% on assets managed. For the year ending 2017 the non-fee-paying account percentage of the composite is 100%. Management fees may vary according to the range of services provided, investment performance, and the amount of assets under management. Constituent portfolios are included from the first full month after inception to the present or the last full month prior to cessation of the client relationship with the firm. For example, an account that opened January 15, 2010 will be included beginning February 1, 2010. An account that terminated February 12, 2010 will be included through January 31, 2010. Policies for valuing portfolios, calculating performance, and preparing compliant presentations are available upon request.
Dispersion: Acadian’s broad definitions are mainly the product of a highly customized process that may result in modest differences with regards to portfolio characteristics among constituents. All accounts managed with directly comparable investment objectives are included, though it’s possible for members to utilize slightly different benchmarks in optimization and reporting. Although at times dispersion among constituents may be high, the long-term forecast for each portfolio is consistent with the overall composite. The ‘Dispersion’ statistic presented above is an annual, asset-weighted standard deviation calculation performed only on those portfolios who have been members for the entire calendar year. Thirty-six months are required to calculate the ‘Three Year ex-Post Standard Deviation’ statistic. These figures are not shown if the requirements necessary to perform the calculations are unavailable.
Composite Description: This composite is an absolute return strategy with low correlations to equities and other asset classes, and targets half the volatility of global equities. The strategy is implemented via long/short positions across and within five major asset classes: Equities, Bonds, FX, Commodities, and Volatility. The strategy seeks to incorporate diverse sources of return in a holistic, risk-balanced approach. It seeks return from three main sources – long term beta exposures, active allocations at the asset class level, and market selection within asset classes. A complete list of the firm’s composites and their descriptions is available upon request.
Benchmark Description: The benchmark for the composite is the 90-Day U.S. T-Bill.
1 Ashland Partners verified Acadian’s GIPS Compliance claim through March 31, 2017. ACA Compliance Group acquired Ashland’s GIPS Verification unit and provided subsequent verifications.
ACA Compliance Group acquired Ashland’s GIPS Verification unit and provided subsequent verifications.