The stock market is chugging along this year despite the conflict with Iran. While prices initially swooned when fighting began, the market quickly recovered. The same thing happened last spring around the Trump administration’s “Liberation Day” tariff announcements: an initial decline followed by a swift reversal. As of mid-May 2026, the market is calm. Is it too calm?
One common concern is that share prices are too high and the stock market is like Wile E. Coyote, just about to succumb to gravity.[1] A related hypothesis, dubbed the “excess tranquility” puzzle by Emil Verner of MIT, is that prices are too stable and should fluctuate more in response to various geopolitical calamities.[2] The excess tranquility puzzle stands in contrast to Robert Shiller’s excess volatility puzzle: historically, stock prices have been too volatile relative to fundamentals as explained in Shiller (2014).
If the stock market is indeed excessively tranquil, the explanation may lie in the rise of contrarian investing behavior. In this piece, I offer evidence from Korean retail investors that supports this hypothesis. Over the past five years, their behavior has shifted from return-chasing to contrarian.
The wellsprings of tranquility
Where does return volatility come from? One source is return-chasing or positive-feedback strategies as in De Long, Shleifer, Summers, and Waldmann (1990). Return-chasing investors magnify price volatility, while contrarian investors moderate price volatility. When prices fall, return-chasing investors sell (“cut your losses”); when prices rise, they buy (“FOMO”). In contrast, when prices fall, contrarians buy (“buy-the-dip”) or at least refrain from selling (“diamond hands”), and when prices rise, contrarians sell (“profit-taking”).
Consider the stock market crash of October 19, 1987. When prices initially declined, the decline caused some market participants to sell (perhaps because they were engaged in dynamic “portfolio insurance” strategies), which caused further price declines. That’s return-chasing over an intraday horizon. We can also consider return-chasing at longer horizons, such as months or years. What caused the tech stock bubble? One cause was return-chasing inflows by retail investors into actively managed mutual funds, as shown by Frazzini and Lamont (2008).
Thus, a plausible explanation for increased tranquility is increased contrarian behavior. In recent years, we’ve seen two major structural changes that tilt the market toward contrarian flows.[3] First, following the passage of the Pension Protection Act of 2006, target-date funds captured an increasingly large fraction of retirement assets. When prices fall, target-date funds will generally buy the dip as they rebalance to target weights. This “macro-contrarian” behavior may dampen stock market volatility according to Parker, Schoar, and Sun (2023).
Second, repurchases by publicly traded firms became common after the 1980s, creating a huge pool of buy-the-dip investors. While firms have always been able to sell when prices are too high (as they did in 1929, 1999, and 2021, issuing equity), only in recent decades has it been easy for them to buy when prices are low.[4]
Another possibility is that retail investors have become more contrarian. Retail investors have historically exhibited both contrarian and return-chasing behavior in different situations, depending on time horizon, type of asset, and the assets they already own, as discussed in Barber and Odean (2013). For our purposes, the relevant question is whether aggregate net retail buying is correlated with aggregate stock prices at the weekly or monthly horizon.
A tale of two dips
In this section, I look at the behavior of Korean retail investors who trade U.S. equities. I study them not because they are the world’s most important investors, but because they are the world’s most easily measured investors. The Korea Securities Depository provides daily data on their total buys, sells, and holdings. As of December 2025, these investors held $163B of U.S. stocks and ETFs; for comparison, total equity holdings of Robinhood investors were $212B. The Korean holdings are heavily concentrated in large tech stocks and related ETFs including levered ETFs.
Let’s compare two recent episodes where the U.S. stock market fell sharply: the response to COVID in 2020, and the response to the tariff turmoil in 2025. In each case, I examine cumulative net buying by Korean investors.
Figure 1: Cumulative net buying by Korean retail investors – COVID onset and recovery
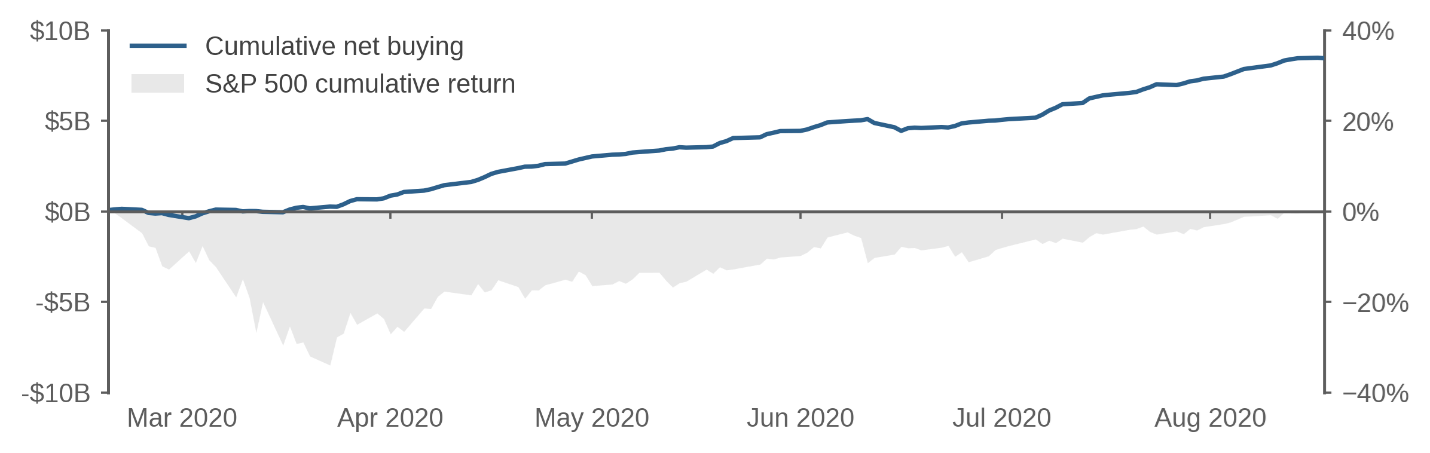 Source: Acadian and Korea Securities Depository Securities Information Portal. The left axis shows net buying, cumulative, in USD billions. The right axis shows S&P 500 index returns. The period is February 19, 2020, to August 18, 2020. Index Source: S&P Copyright (c) 2026, Standard & Poor's Financial Services LLC. All rights reserved.
 Figure 1 shows behavior around March 2020. As prices fell through mid-March, there was little reaction as measured by net buying by Korean investors. We see neither panic selling nor aggressive dip-buying.
But after the market recovered, Korean buying soared. By the time the market had recouped its losses in August, they had bought about $8B of new equity. During COVID, Korean retail investors did not buy the dip in March 2020; instead, they “bought the rip” after March 2020. We could describe their behavior as neutral or perhaps a little contrarian in February and March, but from April to August they were wildly return-chasing.
Figure 2 shows a very different pattern around April 2025—Korean investors were contrarians. First, as the market fell, they continually bought, eventually accumulating $7B at the market’s nadir and an additional $2B over the next two weeks. Then, as prices recovered over the subsequent six weeks, they sold $2B.
Figure 2: Cumulative net buying by Korean retail investors – April 2025
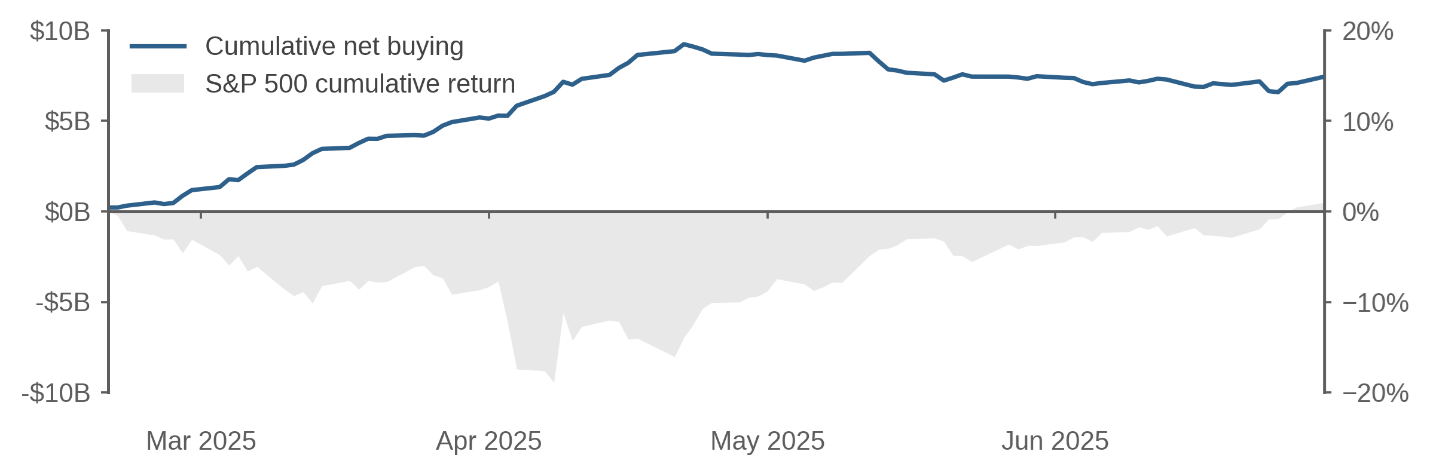 Source: Acadian and Korea Securities Depository Securities Information Portal. The left axis shows net buying, cumulative, in USD billions. The right axis shows S&P 500 index returns. The period is February 19, 2025, to June 30, 2025. Index Source: S&P Copyright (c) 2026, Standard & Poor's Financial Services LLC. All rights reserved.
 It’s worth noting that Figure 2 describes aggregate net buying as opposed to the behavior of any one person. We don’t know if those individuals who bought in April later sold in May. Figure 2 also doesn’t tell us whether April’s increase in net buying came mainly from new buyers entering the market or from existing owners refraining from selling.
Moving from these two case studies to more formal analysis over the period from January 2019 to April 2026, Figure 3 shows the sensitivities of net buying (normalized by prior holdings) to contemporaneous market returns, at both weekly and monthly horizons. Figure 3 shows that for the aggregate U.S. stock market, Korean retail investors were mostly return-chasing from 2019 to 2021 but then flipped to being contrarian after 2022. Thus the patterns seen in Figures 1 and 2 are representative of a more general trend.
The monthly coefficient is about 0.3 before 2022, meaning that if they held $10B of U.S. equities and then the market rose 10% in a month, we’d expect them to buy $0.3B in that month. The blip around March 2020 reflects the fact that (as seen in Figure 1) they did not sell as prices fell, as we would’ve predicted given their prior behavior. You could say that early 2020 was a few months of diamond hands in the middle of four years of return-chasing.
Figure 3: Sensitivity of net buying to market returns
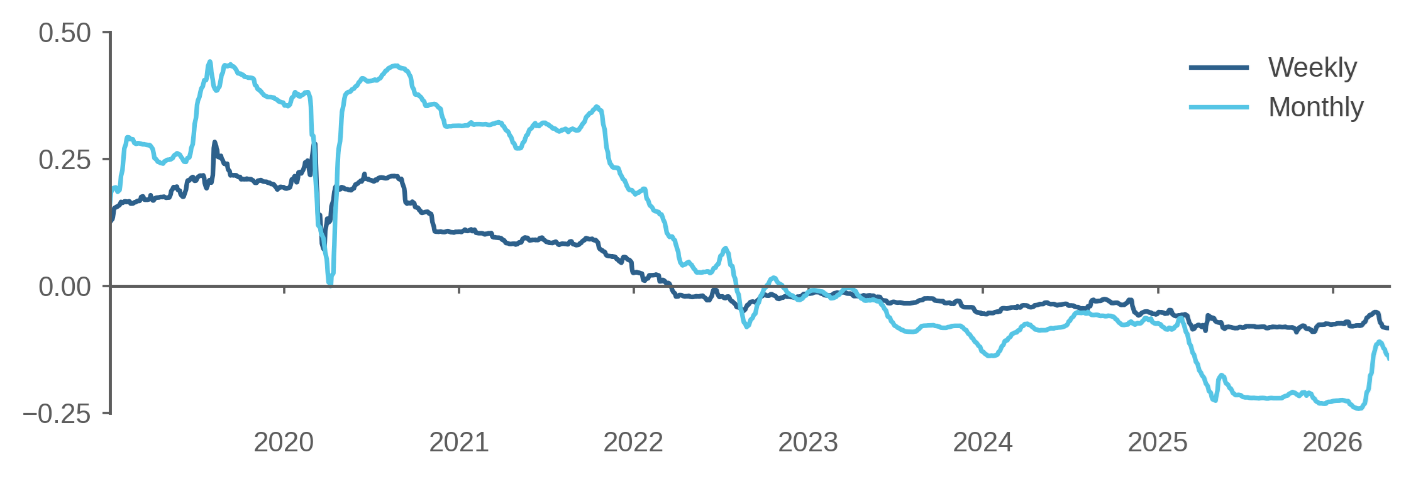
Source: Acadian and Korea Securities Depository Securities Information Portal. Regression of cumulative net buys from day t-h to day t, normalized by holdings as of day t-h-1 vs. S&P 500 returns from t-h to t, where h = 5 (weekly) or h = 20 (monthly). The regression uses overlapping daily periods with exponentially discounted weights with a half-life of 120 days. Regression coefficients are shown January 2019 to April 2026, data starts January 2018. Figure 3 shows that around 2022, something changed and Korean retail investors became contrarian. Both at the monthly and weekly horizon, the coefficient is consistently negative after 2022.
Why do we see this change in behavior? It’s not clear. Perhaps it reflects a deliberate “buy-the-dip” strategy by retail investors. Alternatively, it may reflect the psychological motive of existing owners to avoid selling at a loss. Net buying is the sum of buys and sells by many different individuals with different motives. All we can say is that right now, the net result is that retail flows are stabilizing the market.
Bubbles and return-chasing
Last, let’s talk about bubbles. I define a bubble as a self-sustaining rise in prices over time resulting in the speculative trading of an obviously overvalued asset.[5] Bubbles are about chasing returns. One explanation of the tech stock bubble is that it was driven by retail investors who, inspired by FOMO, kept buying more tech stocks after prices rose. This return-chasing was possibly exacerbated by hedge funds who attempted to “ride the bubble.” [6]
Are we in a stock market bubble today? Figure 3 says no. While stock prices may be too high, they are not being pushed higher by return-chasing flows, at least judging by the behavior of Korean retail investors.
Is the U.S. stock market excessively tranquil? I’m not sure, but it’s certainly true that retail behavior has dramatically shifted since 2021. We live in the age of buy-the-dip or at least refrain-from-selling-the-dip. Who knows how long it will last.
Endnotes
[1] See “Owenomics: What I learned from COVID,” Acadian, September 2025.
[2] https://x.com/EmilVerner/status/2043688509517537506
[3] See also the discussion in “Placid Markets, Uncertain Times,” Acadian, January 2018, by my colleague Seth Weingram. He raises the possibility that the rise of ETFs may create return-chasing dynamics.
[4] See “Owenomics: Firms are the smart money,” Acadian, November 2025.
[5] See “Owenomics: No, we are not in a bubble yet,” Acadian, March 2024.
[6] See “Owenomics: We’re still dancing: How bubbles grow,” Acadian, March 2025.
References
Barber, Brad M., and Terrance Odean. "The behavior of individual investors." In Handbook of the Economics of Finance, vol. 2, pp. 1533-1570. Elsevier, 2013.
De Long, J. Bradford, Andrei Shleifer, Lawrence H. Summers, and Robert J. Waldmann. "Positive feedback investment strategies and destabilizing rational speculation." The Journal of Finance 45, no. 2 (1990): 379-395.
Frazzini, Andrea, and Owen A. Lamont. "Dumb money: Mutual fund flows and the cross-section of stock returns." Journal of Financial Economics 88, no. 2 (2008): 299-322.
Parker, Jonathan A., Antoinette Schoar, and Yang Sun. "Retail financial innovation and stock market dynamics: The case of target date funds." The Journal of Finance 78, no. 5 (2023): 2673-2723.
Shiller, Robert J. "Speculative asset prices." American Economic Review 104, no. 6 (2014): 1486-1517.




