May 2018
Introduction
In early February, concerns over rising interest rates, compounded by a short squeeze in the volatility market, triggered a sharp equity market selloff. Losses extended beyond equity-dominated and short-volatility portfolios; many multi-asset strategies suffered material losses during the selloff. For the month, the Barclay CTA Indexi lost -3.8%, and the HFR Risk Parity Vol 10 Indexii lost -2.8%.1 The performance of CTAs, in particular, may seem surprising based on a popular narrative that these strategies are “long volatility,” in which case we might have expected them to enjoy gains.
In this note, we examine features of CTAs and risk parity that expose vulnerabilities during market drawdowns. We contrast these strategies to more robust multi-asset investing approaches that incorporate more diverse returns drivers.
Hidden Vulnerabilities—CTAs
Typical CTA strategies take long/short positions across a range of futures and currency markets. As trend followers, they aim to capture both positive and negative price momentum based on the premise that past price movement tends to continue.
CTA strategies are sometimes characterized as “long volatility” based on a purported ability to perform well during both strong market rallies and severe declines. Figure 1 helps illustrate the origins of this notion, charting monthly aggregate CTA returns versus those of a global equity benchmark over the past 10 years. The best fit curve looks like a “smile,” suggesting stronger CTA performance when equity markets have moved substantially, whether rising or falling.
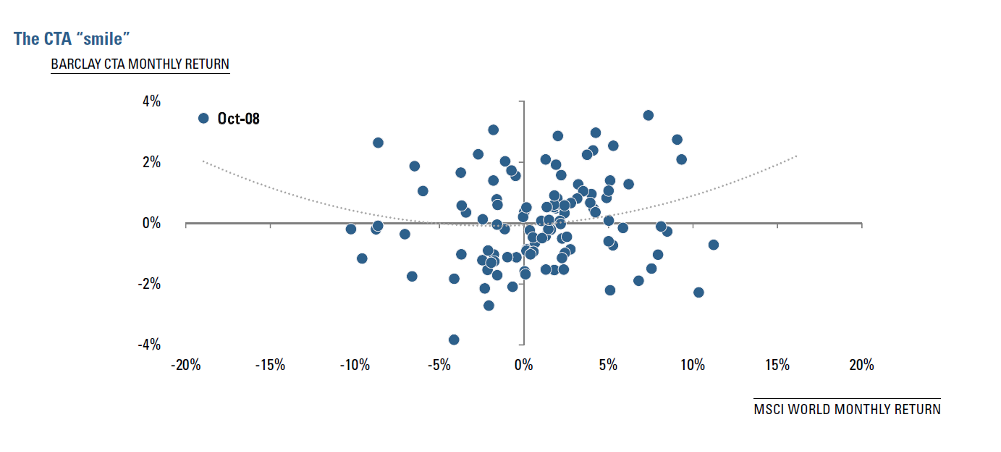
Sources: MSCI, BarclayHedge. Copyright MSCI 2018. All Rights Reserved. Unpublished. PROPRIETARY TO MSCI. For illustrative purposes only. It is not possible to invest directly in any index. Past results are not indicative of future trading results. The Barclay CTA Index represents speculative investments and involves a high degree of risk. An investor could lose all or a substantial portion of his or her investment.
Also supportive of their popular reputation as a risky asset diversifier, Figure 2 shows strong CTA performance during the large equity selloffs over the past 35+ years. CTA performance during these episodes might indicate that bear markets typically don’t come out of the blue, but rather that they represent the acceleration of already established downturns. In other words, CTAs typically have time to reposition their portfolios—seeking to reduce long equity exposure or increase short exposure before a great deal of market damage is done.
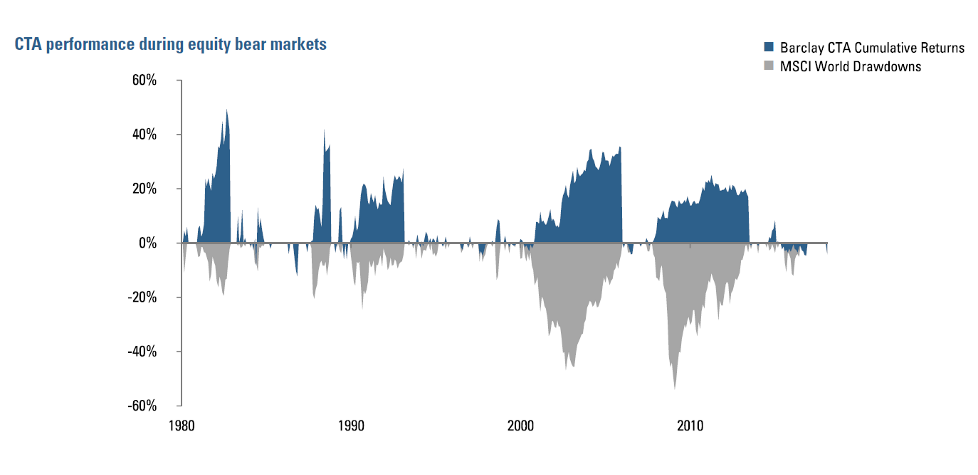
Sources: MSCI, BarclayHedge. Copyright MSCI 2018. All Rights Reserved. Unpublished. PROPRIETARY TO MSCI. For illustrative purposes only. It is not possible to invest directly in any index. Past results are not indicative of future trading results. The Barclay CTA Index represents speculative investments and involves a high degree of risk. An investor could lose all or a substantial portion of his or her investment.
But CTA performance since the global financial crisis suggests that conventional wisdom associated with CTA’s protective value has shaky foundations. To start with, a closer look at Figure 1 hints that the purported smile pattern in CTA returns is quite sensitive to a few rare and outsized events. If we were to remove just one data point from the chart (October 2008), the best-fit curve would become nearly flat.
Further, outside of the most severe drawdowns, “minor” panics have been characterized by abrupt, simultaneous momentum reversals across multiple markets that generate losses for trend followers. Figure 3 shows a simple reversal indicator, which captures how a given month’s performance across markets relates to performance over the prior six months. The average return for the Barclay CTA index is -1.4% when the reversal indicator scores below -0.4, but +1.5% when it scores above 0.4. Incidentally, the reversal indicator’s highest value occurred in October 2008, when CTAs performed extremely well. In contrast, February 2018’s poor CTA performance occurred when the indicator was near 10-year lows.
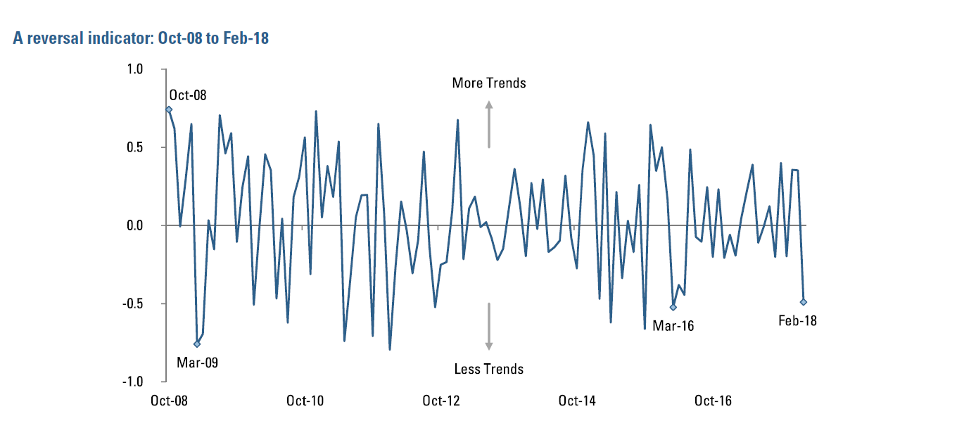
Source: Acadian. For illustrative purposes only. It is not possible to invest directly in any index. Past results are not indicative of future trading results. The Barclay CTA Index represent speculative investments and involve a high degree of risk. An investor could lose all or a substantial portion of his or her investment.
Overall, CTAs haven’t generated substantial positive returns in the post-GFC environment, suggesting that the diversification potential that they do provide may also come at a material opportunity cost. In fact, the annualized return for the Barclay CTA Index since October 2008 has been 0.8%. (See Figure 4.) In addition to their vulnerability to reversals, CTA returns are also adversely affected by range-bound markets, as we have observed in fixed income, with interest rates stuck near historically low levels. Diversified CTAs benefit when multiple markets are trending simultaneously (even if counter to one another). An isolated trend in one asset class, however, likely won’t “move the needle.” The headwind from fixed income has likely negatively offset contributions to CTA performance from the broad equity market rally.
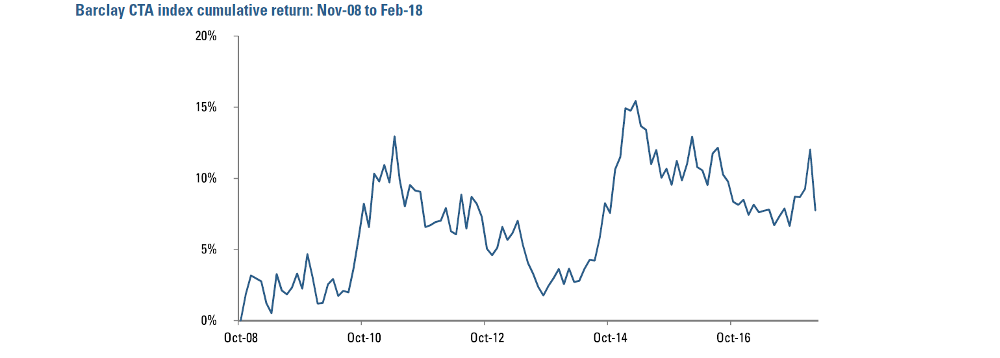
Source: BarclayHedge. For illustrative purposes only. It is not possible to invest directly in any index. Past results are not indicative of future trading results. The Barclay CTA Index represents speculative investments and involves a high degree of risk. An investor could lose all or a substantial portion of his or her investment.
Hidden Vulnerabilities—Risk Parity
Risk parity has, at its heart, an intuitive asset allocation approach designed to equalize contributions to portfolio risk across all asset classes in a diversified portfolio. The motivation is compelling: traditional capital-focused portfolio allocations, including the once ubiquitous 60%/40% equity/fixed income blend, tend to suffer from significant concentrations of risk. For example, equity risk would have accounted for a staggering 98% of the variation in a hypothetical 60% MSCI World / 40% Barclays Global Aggregate Hedged portfolio from 2003-2018.2
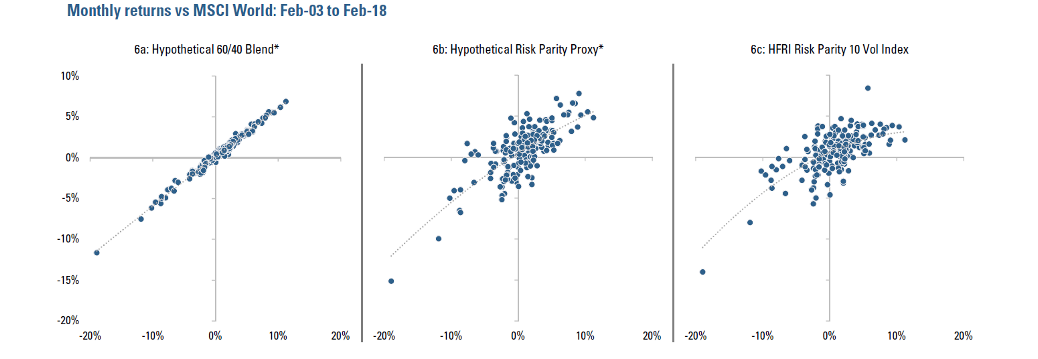
One subtle implication of equity’s dominance in driving the portfolio’s returns is that even a 40% allocation to fixed income would have provided limited diversification value during a period in which the equity/fixed income correlation was zero (Figure 5). In fact, as Figure 6a illustrates, over the period in question, returns from the 60/40 blend resembled a roughly 40% delevered version of the equity benchmark—in the scatter chart of these two portfolios’ hypothetical returns, there is little visible variation around a best-fit line that has a slope of roughly 0.6. The explanation for this apparent paradox is sizing. The volatility of the Barclays Aggregate Index has simply been too low relative to MSCI World, (around 1/5th), thus a fixed income allocation greater than 40% would be required to generate a substantial interactive effect with equities.
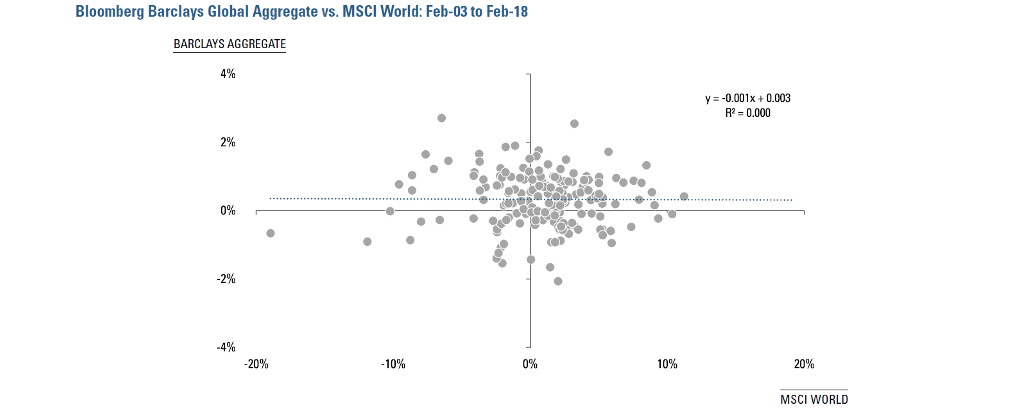
Sources for figures 5 and 6: Acadian, Bloomberg Barclays Global Aggregate Indices,** HFRI Source: Hedge Fund Research, Inc. www.hedgefundresearch. com, © 2018. All rights reserved. MSCI. Copyright MSCI 2018. All Rights Reserved. Unpublished. PROPRIETARY TO MSCI. *Hypothetical Portfolios. For illustrative purposes only. This is meant to be an educational illustrative example and is not intended to represent investment returns generated by an actual portfolio. The hypothetical results do not represent actual trading or an actual account, but were achieved by means of retroactive application of a model designed with the benefit of hindsight for the period specified above. Results are gross and would be reduced by advisory fees. Results reflect transaction costs and other implementation costs. Reference to the benchmark is for comparative purposes only. Hypothetical results are not indicative of actual future results. Every investment program has the opportunity for loss as well as profit.
**The Bloomberg Barclays Indices are owned by Bloomberg Index Services Limited. The Bloomberg Commodity Indices are owned by Bloomberg Index Services Limited or Bloomberg’s licensors, including UBS AG and UBS Securities LLC. BLOOMBERG®, the Bloomberg Commodity Index and the names of the other indices and subindices that are part of the Bloomberg Commodity Index family (such indices and subindices collectively referred to as the “BCOM Indices”) are trademarks and service marks of Bloomberg Finance L.P. and its affiliates (collectively “Bloomberg”). BARCLAYS® is a trademark and service mark of Barclays Bank Plc (collectively with its affiliates, “Barclays”), used under license. Neither Bloomberg nor its third party licensors, UBS AG, UBS Securities LLC or Barclays, or any of their respective subsidiaries or affiliates approves or endorses this material, or guarantees the accuracy or completeness of any information herein, or makes any warranty, express or implied, as to the results to be obtained therefrom and, to the maximum extent allowed by law, neither shall have any liability or responsibility for injury or damages arising in connection therewith.
Risk parity provides a solution to this problem. It extracts meaningful diversification benefits from a multi-asset portfolio by combining high- and low- volatility asset classes on equal risk footings. But there is an obvious catch: dramatically increasing the weight of fixed income and other lower-volatility assets reduces total portfolio risk— along with a commensurate reduction in expected returns.3 With interest rates at current levels, these returns would potentially range in the low single digits.
So risk parity levers up the portfolio to restore its total volatility to a desired target level, 10% being typical. To illustrate the process, we create a hypothetical risk parity proxy incorporating equities, fixed income, and commodities (using MSCI World, Bloomberg Barclays Global Aggregate,iiand BCOM commoditiesi indices). Balancing the three asset classes’ contributions to risk would require allocating about 75% of capital to fixed income. Without leverage, we would expect the resulting portfolio to have volatility of only approximately 3.7%, annualized. So in order to achieve a 10% risk target, this portfolio requires roughly 2.7x leverage, specifically, 35% to equities, 35% to commodities, and 200% to fixed income.
Our proxy’s hypothetical performance demonstrates that risk parity can produce material diversification benefits. Figure 6b shows that its returns are much less tightly related to equity than those of the 60/40 portfolio in Figure 6a. The risk parity proxy has a correlation with equity of 0.7 versus nearly 1 for the 60/40 blend.
How many long-only market betas are there? The diversification benefits of our simple hypothetical proxy resemble those of the HFR Risk Parity 10 index, as evidenced by comparing Figures 6b and 6c. This suggests that the diversification benefit of real-world risk parity implementations, in aggregate, may be largely understandable in terms of simple representations of only three broad assets—equity, fixed income, and commodities. This observation helps to explain risk parity losses during some recent drawdowns, including October 2008 and February 2018, when equities and commodities sold off and fixed income failed to rally.
Moreover, the current market environment presents headwinds for traditionally fixed income-heavy risk parity implementations. Backtests of risk parity strategies have shown benefits from a 35-year fixed income bull market and declining equity/fixed income correlations, associated with flight-to-quality behavior. Going forward, however, the strategy is exposed to potential headwinds from both rising rates and rising stock/bond correlations, particularly if inflation expectations increase.
Benefits of More Robust Diversification
To improve diversification, more sophisticated multi-asset approaches, such as Acadian’s Multi-Asset Absolute Return Strategy (MAARS), diversify across a broader set of return drivers than employed by CTAs or risk parity. Specifically, MAARS makes use of:
- a diverse set of asset classes (equities, bonds, currencies, commodities, and options volatility)
- selection within asset classes
- dynamic allocation across asset classes
A MAARS composite returns attribution from the February 2018 selloff (Figure 7) illustrates how these components of the strategy interact to improve diversification and highlights points of similarity and departure relative to CTAs and risk parity. Overall, for February, the MAARS strategy composite returned -0.5% (net of fees), in comparison MSCI World, which returned -4.1%.4 The strategy entered the month with long net exposure to equities, which contributed negatively to performance during the sell-off. The attribution shows, however, that the strategy benefited from diversification across asset classes, and especially through selection effects within currencies, commodities, and bonds. While dynamic allocation generated negative contributions to returns during February, particularly in equities and commodities, their materiality illustrates relevance in diversifying the portfolio.
Pointing to a similarity with risk parity, MAARS incurred negative return contributions from long-term allocations to equities and volatility. Both approaches take long exposure to the historically observed return premia associated with these asset classes. But MAARS’ dynamic allocation and within-market selection elements, both of which are based on return forecasting signals and are not part of typical risk parity implementations, made material and diversifying contributions to returns during this episode.
CTAs bear similarity to one slice of MAARS’ performance drivers, specifically dynamic allocation and market selection elements driven by sentiment-based signals. However, for the Multi-Asset Absolute Return Strategy, sentiment is only one of a variety of “themes” that represent returns drivers not found in typical CTA strategies, including other asset-specific factors, namely value, carry, and quality, as well as several macro-based signals.
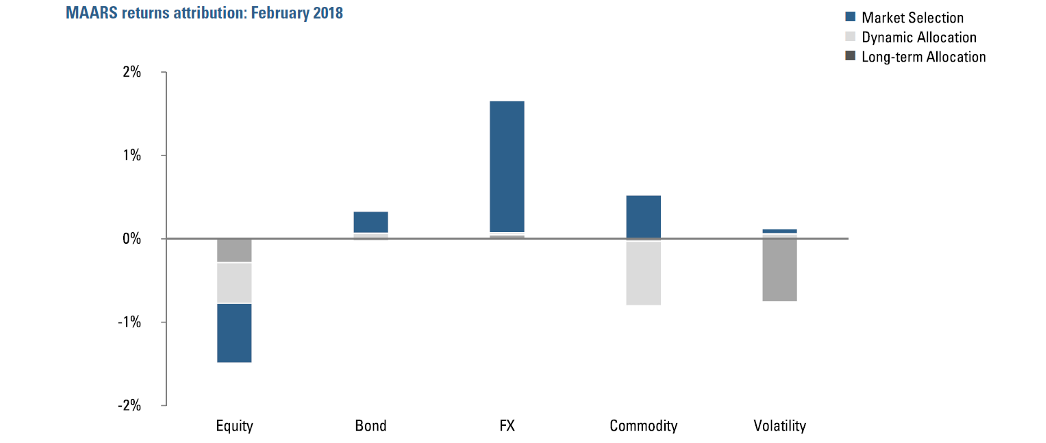
Source: Acadian. The data presented here is for a representative portfolio and is supplemental to the composite performance disclosure page attached. Investors have the opportunity for losses as well as profits. Past performance is no guarantee of future results.
Conclusion
CTAs and risk parity each have a history of providing attractive sources of multi-asset returns. Based on that track record, we have incorporated aspects of these approaches into Acadian MAARS. But we believe there are material benefits to expanding diversifying elements beyond the narrow range reflected in either CTAs or risk parity; on a standalone basis, each approach may experience greater vulnerability to pronounced market drawdowns than more sophisticated multi-asset investing approaches. Consistent with this perspective on diversification, we believe that investors may also have the potential to benefit from richer returns forecasting and holistic portfolio construction approaches embedded in MAARS than the implicitly restricted approaches reflected in CTAs and risk parity.
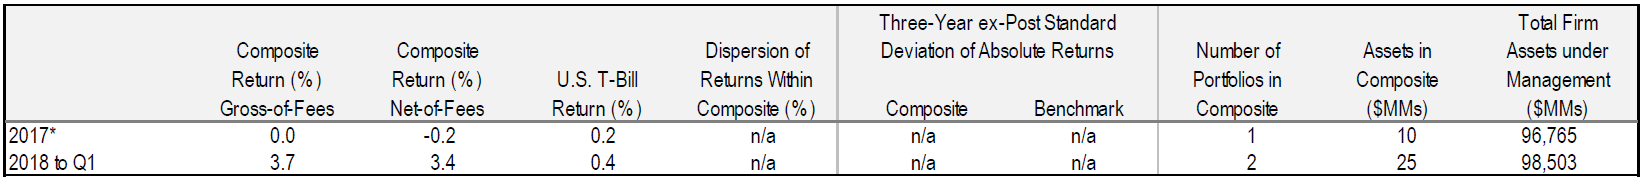
*Performance Inception: November 1, 2017. This composite was created on December 1, 2017. All figures stated in USD. Acadian Asset Management claims compliance with the Global Investment Performance Standards (GIPS®) and has prepared and presented this report in compliance with the GIPS standards.
Acadian Asset Management has been independently verified for the periods January 1, 1994 through December 31, 2017.1 A copy of the verification report is available upon request. Verification assesses whether (1) the firm has complied with all the composite construction requirements of the GIPS standards on a firm-wide basis and (2) the firm’s policies and procedures are designed to calculate and present performance in compliance with the GIPS standards. Verification does not ensure the accuracy of any specific composite presentation. Reference to the benchmark is for comparative purposes only and is not intended to indicate that the composite will contain the same investments as the benchmark. Investors have the opportunity for losses as well as profits. Past performance is no guarantee of future results. Acadian Asset Management is an investment adviser specializing in global equity management. Acadian Asset Management is defined to include assets managed by Acadian Asset Management LLC, an investment adviser registered with and regulated by the United States Securities and Exchange Commission, as well as assets managed by its four wholly-owned affiliates, Acadian Asset Management (Australia) Limited (ABN 41 114 200 127), Acadian Asset Management (Japan), registered with the Kanto Local Financial Bureau, Acadian Asset Management Singapore Pte Ltd, (Registration Number: 199902125D) is licensed by the Monetary Authority of Singapore, and Acadian Asset Management (UK) Limited, authorized and regulated by the Financial Conduct Authority of the United Kingdom. On June 30, 2015, Acadian acquired the assets of Acadian’s Australian office.
Methodology: Returns are net of estimated foreign withholding taxes on dividends, interest, and capital gains. As of January 1, 2010 Acadian’s methodology was augmented to produce a more accurate gross return figure by eliminating modest cash flows such as securities lending income and custodial fees which are regarded as independent of the investment management process; the reinvestment of all income and trading expenses continue to be included. Gross returns will be reduced by investment advisory fees and other expenses. Monthly composite results are asset-weighted by beginning-of-month asset values of member portfolios which are geometrically linked to arrive at the annual composite return. Net-of-fee performance is accrued on a monthly basis and is calculated using the highest management fee as described in section 2A of the firm’s Form ADV for the investment process utilized to manage this strategy; such form is available upon request. Net-net-of-fees additionally include incentive fees which, when applicable, are also accrued on a monthly basis. The standard fee schedule for accounts managed with this product is 1% on assets managed. For the year ending 2017 the non-fee-paying account percentage of the composite is 100%. Management fees may vary according to the range of services provided, investment performance, and the amount of assets under management. Constituent portfolios are included from the first full month after inception to the present or the last full month prior to cessation of the client relationship with the firm. For example, an account that opened January 15, 2010 will be included beginning February 1, 2010. An account that terminated February 12, 2010 will be included through January 31, 2010. Policies for valuing portfolios, calculating performance, and preparing compliant presentations are available upon request.
Dispersion: Acadian’s broad definitions are mainly the product of a highly customized process that may result in modest differences with regards to portfolio characteristics among constituents. All accounts managed with directly comparable investment objectives are included, though it’s possible for members to utilize slightly different benchmarks in optimization and reporting. Although at times dispersion among constituents may be high, the long-term forecast for each portfolio is consistent with the overall composite. The ‘Dispersion’ statistic presented above is an annual, asset-weighted standard deviation calculation performed only on those portfolios who have been members for the entire calendar year. Thirty-six months are required to calculate the ‘Three Year ex-Post Standard Deviation’ statistic. These figures are not shown if the requirements necessary to perform the calculations are unavailable.
Composite Description: This composite is an absolute return strategy with low correlations to equities and other asset classes, and targets half the volatility of global equities. The strategy is implemented via long/short positions across and within five major asset classes: Equities, Bonds, FX, Commodities, and Volatility. The strategy seeks to incorporate diverse sources of return in a holistic, risk-balanced approach. It seeks return from long/short positioning at the broad asset class level (asset allocation) and at the market level within asset classes (market selection). A complete list of the firm’s composites and their descriptions is available upon request.
Benchmark Description: The benchmark for the composite is the 90-Day U.S. T-Bill.
1Ashland Partners verified Acadian’s GIPS Compliance claim through March 31, 2017. ACA Compliance Group acquired Ashland’s GIPS Verification unit and provided subsequent verifications.