
Taking the Heat Out of Decarbonization Strategies
Key Takeaways
-
Neither exclusion-based approaches nor low-carbon benchmark tracking indexes incorporate a deliberate means of generating alpha.
-
Exclusion-based approaches tend to rely on industry allocation bets that generate substantial uncompensated risk.
-
In contrast, we show that combining a rich stock-selection model with sophisticated portfolio construction may durably improve financial outcomes while meeting decarbonization objectives.
Table of contents
Poor year-to-date returns of many low-carbon equity strategies have called into question the financial wisdom of conventional methods of achieving sustainability objectives. In the following we examine the drivers of that disappointing 2022 performance and demonstrate an approach designed to provide superior financial outcomes.
We first examine shared characteristics among mainstream decarbonization strategies that are available in the marketplace. Many of these strategies employ blunt industry reallocations to modify their carbon profiles and, in doing so, take on active industry exposures. In our view, these exposures represent a form of uncompensated risk that for years provided an incidental performance tailwind but in 2022 has generated a significant headwind. Another class of decarbonization strategies hugs the benchmark, better controlling for industry risk but also generating minimal active return, essentially by design.
We then demonstrate the benefits of incorporating an active return-seeking objective and more sophisticated portfolio construction into a low active risk decarbonization strategy. Relative to conventional alternatives, we show that this approach generates more durable alpha from stock selection while both minimizing uncompensated risks and meeting decarbonization targets.
Decarbonization Strategies: Distinguishing Characteristics
Over the past decade, investment strategies that limit exposure to carbon delivered generally attractive investment returns. In 2022, however, many have underperformed market indexes. To better understand what has driven the shift in performance, Figure 1 highlights salient characteristics of a broad sample of asset managers’ low-carbon global equity offerings drawn from the Refinitiv Ownership database. Based on their names and other basic attributes, we group the strategies into four categories:
-
Paris Aligned: The objective of these strategies is to reduce carbon exposure without regard to maximizing returns.1 Paris Aligned strategies incorporate strict fossil fuel-related exclusions, which achieve a 73.5% benchmark-relative reduction in weighted average carbon intensity (WACI) through material underweights to the energy and materials sectors. From a financial perspective, these strategies have been the worst underperformers in 2022.
-
Climate Transition: These strategies aim to be well positioned for a transition to a more climate-friendly global economy. While they invest in alternative energy, they also invest in carbon-inefficient companies that may have the most to gain from a transition. Perhaps surprisingly, as a result, Transition strategies tend to have materially higher carbon exposure than the benchmark by some measures (e.g., median +78.5% WACI). From an allocation perspective, they have material overweights to utilities.
-
Low Carbon: Strategies in this group lie between the Climate Transition and Paris Aligned categories in terms of their benchmark-relative carbon exposure. To achieve a median 41.9% WACI reduction, they typically underweight energy companies but have small overweights to utilities and, consequently, some exposure to fossil fuels.
-
Low Carbon Enhanced Indexes: These strategies differ materially from the others with respect to objectives and methods. They are aimed at investors who wish to decarbonize but who have limited appetite for active risk. Specific approaches vary, but they are often based on security-level exclusions, constraints on portfolio-level exposures implemented through optimization,2 or some combination of the two.3 Low Carbon Enhanced strategies are often systematic, as is evident in their large number of holdings. While they are effective in generating large carbon reductions with smaller sector reallocations, as a group they have still underperformed the benchmark index.
Figure 1: Asset Managers’ Decarbonization Offerings—Salient Characteristics
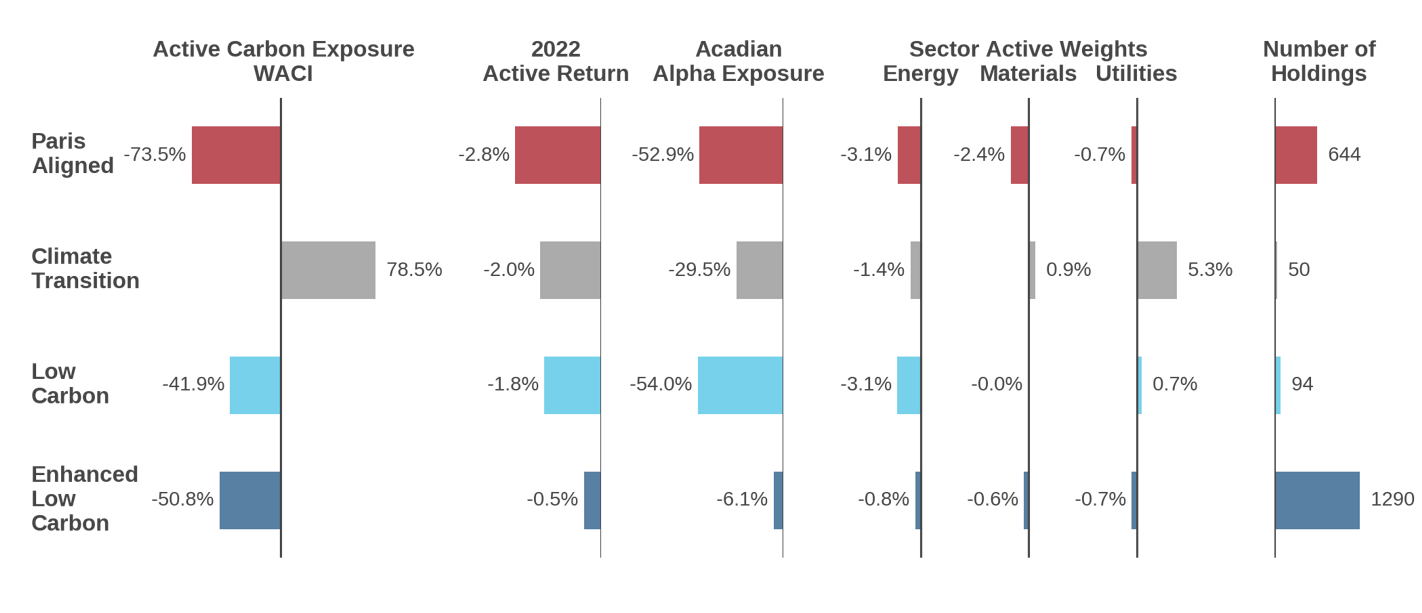
While the strategies represented in Figure 1 may deliver on their varied sustainability objectives, we believe that investors who are focused on financial performance and active risk should consider more sophisticated approaches. Specifically, we would advocate for incorporating an explicit returns-seeking element in the form of stock selection. Figure 1 provides specific motivation beyond the general underperformance of the conventional strategies in 2022: the typical strategy in each category has negative active exposure to Acadian’s stock selection alpha signals relative to the cap-weighted benchmark. In other words, it has relatively undesirable exposure to Value, Quality, Growth, and Technical characteristics that have been shown, over the long term, to improve returns.
Achieving Better Financial Outcomes
To flesh out the choices involved in decarbonizing, we compare an approach that incorporates Acadian’s return model with two baseline strategies that embody salient features of the available offerings studied in Figure 1.
-
Baseline #1 Rules Based: This hypothetical strategy excludes securities from the MSCI World Index based upon revenue exposure to fossil fuels. In the specific implementation, we apply commonly accepted fossil fuel exclusion criteria using the Paris Aligned Benchmark methodology.4
-
Baseline #2 Carbon Constrained: This hypothetical strategy applies systematic portfolio construction techniques to explicitly target a reduction in portfolio-level carbon exposure while limiting active industry exposures and minimizing overall active risk.5 To ensure like-for-like comparisons across approaches, we constrain WACI to the average reduction achieved by the Rules Based strategy, -34% versus the benchmark. The Acadian-based approach, which we label Active Enhanced, maximizes risk-adjusted returns using our stock-level return and risk forecasts while targeting the same WACI reduction as the two baselines.
The Active Enhanced hypothetical strategy targets 20bps of active risk, consistent with Carbon Constrained strategies. In the last section, we offer perspective on higher active risk contexts.
In a hypothetical historical analysis from 2010 – July 2022, all three strategies deliver similar ex post carbon reductions, as intended.6 But Figure 3 shows that the three decarbonization approaches produce materially different financial outcomes.
Figure 2: Hypothetical Decarbonization Strategies—Key Attributes
.png)
Figure 3: Hypothetical Cumulative Active Returns
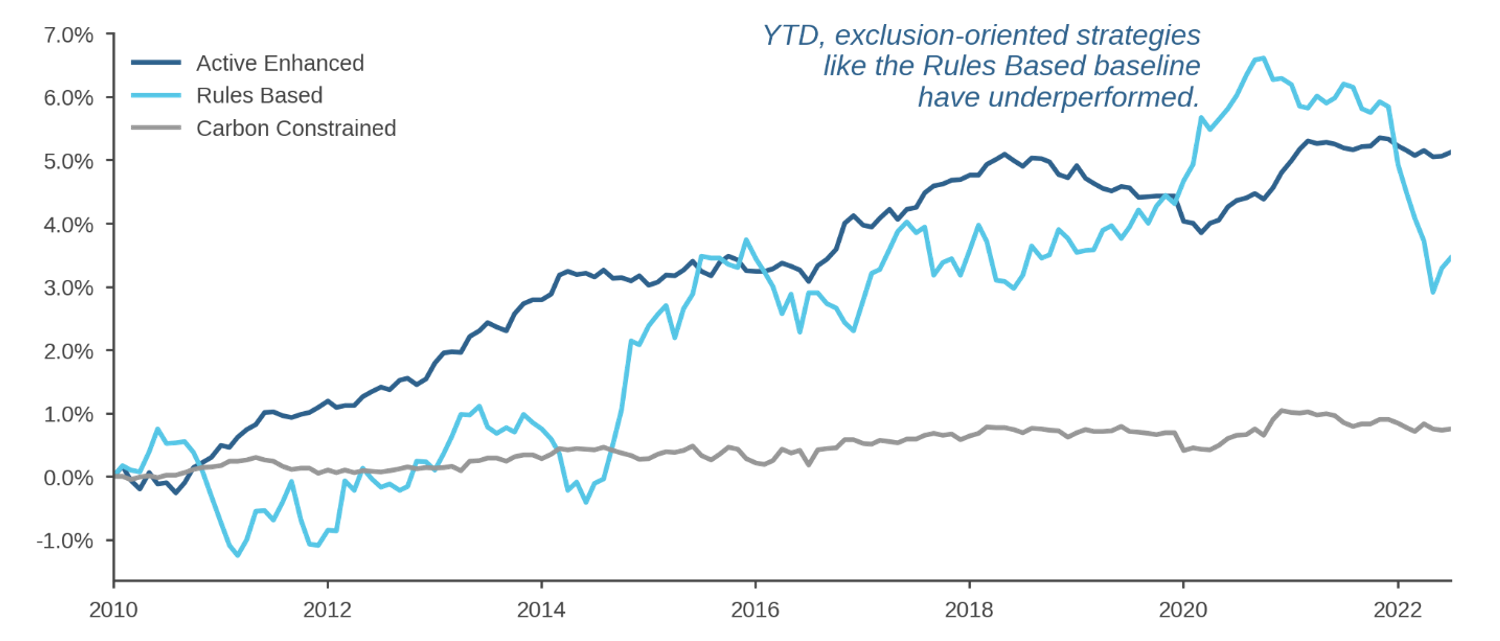
Specifically, the Active Enhanced strategy provides a stream of positive active returns. The Rules Based baseline delivers a cumulatively positive active return, but its benchmark-relative performance is volatile and exhibits significant drawdowns, including during 2022. The Carbon Constrained baseline generates minimal outperformance, which is hardly surprising given that it is more or less designed to neither under- nor outperform, minimizing active risk with no alpha-generation driver.
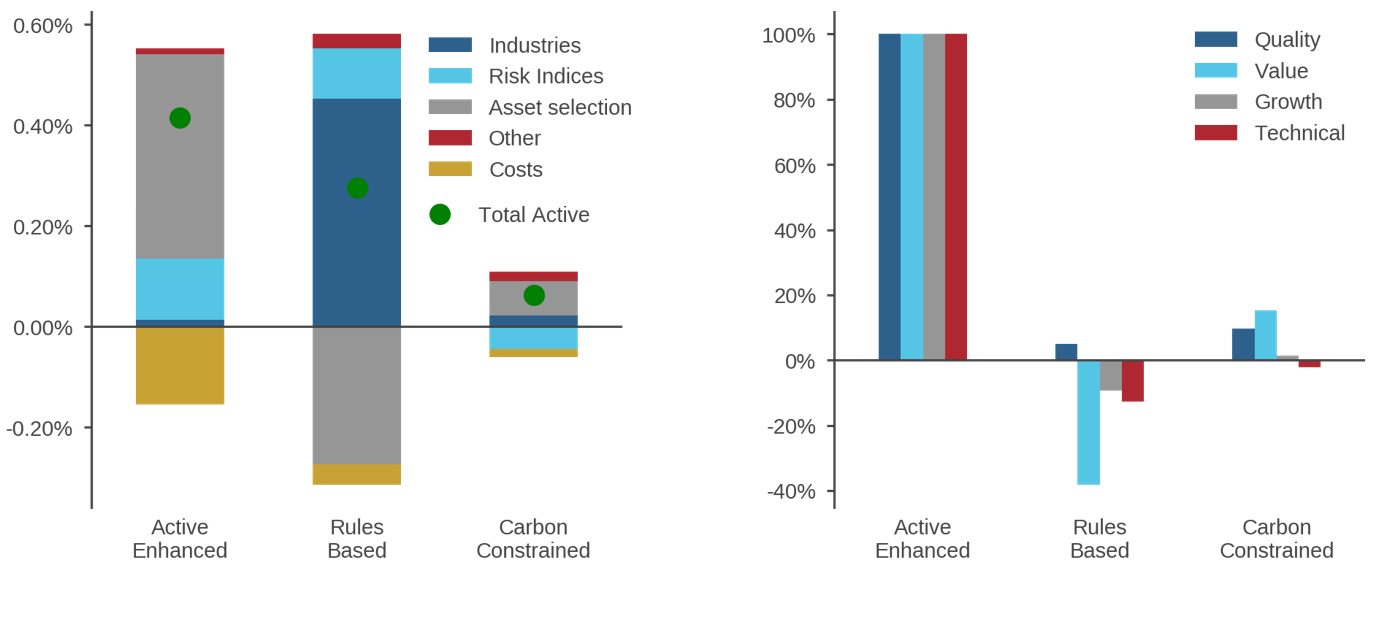
A returns attribution in the left panel of Figure 4 identifies key sources of discrepancy. The Rules Based approach achieves most of its outperformance through active industry allocation bets (dark blue shading). In contrast, outperformance of the Active Enhanced strategy is driven by stock selection (gray), consistent with the design decision to maximize exposure to Acadian’s bottom-up return signals. Drilling deeper, the right panel of Figure 4 shows that relative to the Active Enhanced strategy, both the Rules Based and Carbon Constrained baselines have small and sometimes negative active exposure across all four signal groups in our stock-selection model. Close inspection of the left panel shows that the Active Enhanced strategy delivers its higher active returns even though inclusion of the alpha model generates higher trading costs (gold) associated with increased turnover relative to the other two approaches.7
Figure 4: Hypothetical Active Returns Analysis
The importance of whether active returns derive from industry allocation or stock selection is driven home by a risk attribution in Figure 5. The left panel shows that the Rules Based approach generates ex ante active risk of 0.90% on average over the simulation period, more than three times the levels exhibited by the Carbon Constrained and Active Enhanced strategies, both of which tightly control ex ante active risk exposure from a wide range of systematic factors.
Figure 5: Contributions to Hypothetical Ex Ante Active Risk
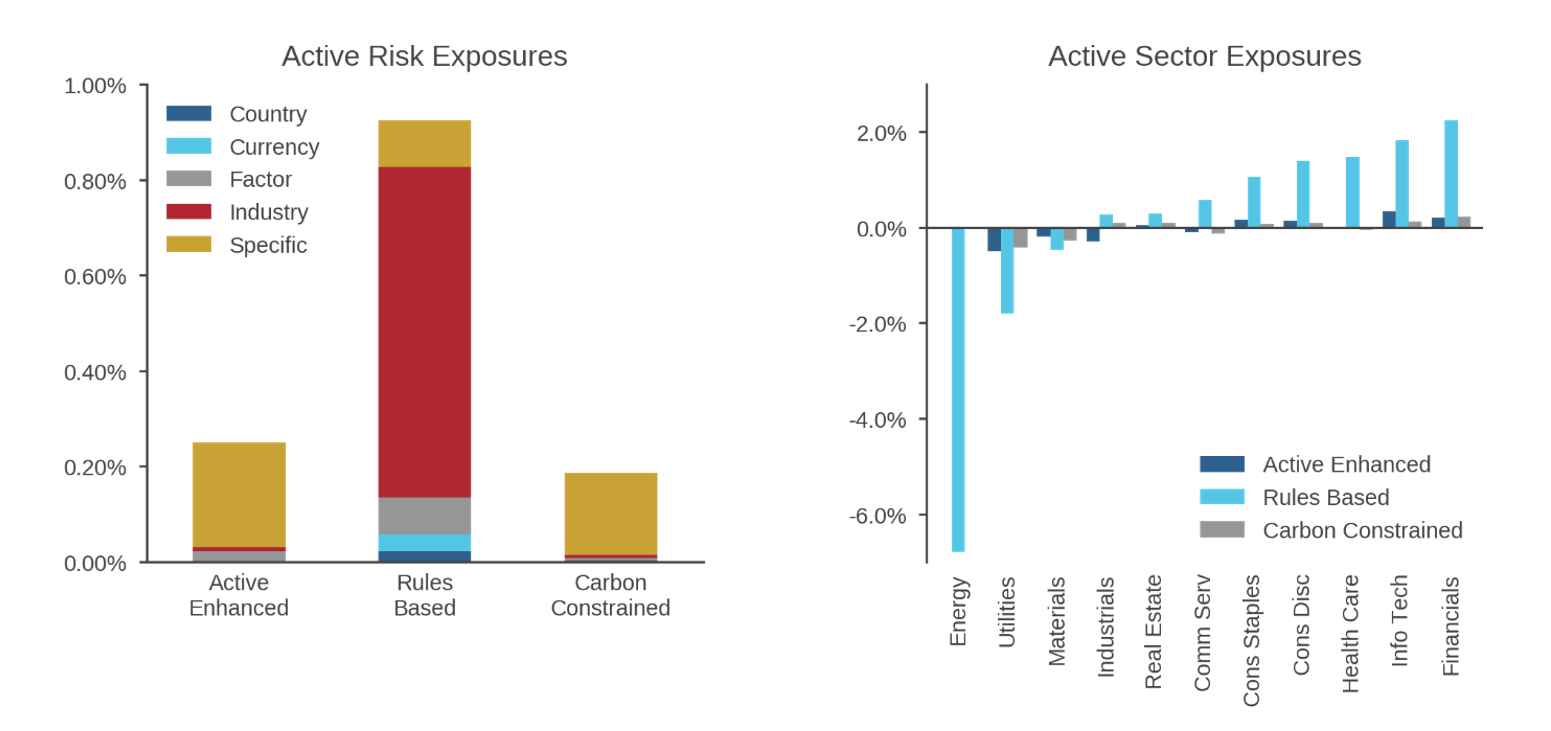
The right panel documents that most of the active risk associated with the Rules Based approach represents industry exposures that result from the blunt fossil-fuel exclusions. In other words, the Rules Based strategy’s active returns will almost entirely depend on the future relative performance of the affected industries, including both the underweighted energy and utilities sectors and the overweighted financials and technology sectors. Moreover, as we have noted in prior research, the active risk of decarbonization strategies that primarily rely on industry reallocations may vary considerably over time because these strategies do not generally include mechanisms to modulate exposures to affected sectors or industries as their volatilities rise and fall.8
Flexibility of Active Systematic Approaches
The hypothetical analysis described above compares three low-carbon implementations in a low active risk context. In that setting, the Active Enhanced approach offers additional benefits. Its flexible portfolio construction machinery can be tailored to an investor’s specific decarbonization objectives, other sustainability goals, and financial requirements, and it is designed to optimize the tradeoffs between them.
Moreover, moving away from the low active risk setting, additional analysis emphasizes the benefits of incorporating active stock selection as the active risk constraint is relaxed. In essence, given the current composition of most equity benchmarks, a well-conceived systematic active strategy can achieve significant portfolio decarbonization with little sacrifice in terms of alpha exposure.9 All the more reason not to neglect alpha generation in decarbonizing allocations.
Conclusion
At certain points in time, the choice of decarbonization implementation within enhanced investment strategies has not materially detracted from financial outcomes. In fact, some approaches have episodically benefited from an incidental tailwind. The year 2022 has shown the risks of such indifference, however. The current environment has highlighted the need to understand the drivers of a strategy’s observed active performance. Approaches that employ more sophisticated portfolio construction rather than defaulting to blunt exclusions, in our view, can better control for unintended risk exposures resulting from carbon reduction. To durably generate active returns, strategies should also include a sophisticated stock selection component.
Endnotes
- Such strategies are often promoted as Article 8 from a European Sustainable Finance Disclosure Regulation (SFDR) perspective.
- This option applies to investors seeking to reduce overall portfolio exposure to carbon emissions, it may not be applicable for those with strict divestment policies.
- Portfolio construction techniques, including exclusions or carbon exposure constraints, are not the only tools that can be applied to low-carbon strategies. A holistic approach would also include the use of corporate engagement aimed to influence real-world change in carbon emissions. Please see Acadian, ESG Engagement: By the Numbers, 2022.
- The approach excludes companies from the benchmark that derive greater than 1% of their revenues from thermal coal mining, greater than 10% revenue from oil and gas-related activities, or greater than 50% of revenue from thermal coal, liquid fuel or natural gas-based power generation. In unreported results, we also applied the exclusion criteria within a risk-controlled optimization. This did not result in a reduction in active carbon exposure, because the optimization process minimized tracking error that resulted from the exclusions by bringing in high carbon intensity securities, such as those within materials and industrials.
- Specifically, while minimizing active risk, we also apply active bounds of ±5% for country and sector exposures and ±2% for security exposure to align with the constraints implemented by the Paris Aligned Benchmark.
- These results are available upon request.
- The Active Enhanced strategy exhibits an average annual turnover of 51.8% compared to less than 5% for the Rules Based and Carbon Constrained baselines.
- See Acadian, ESG: The Imperative of a Systematic Approach, 2021.
- For example, in unreported results that are available upon request, we conduct a simulation exercise to evaluate the average ex ante active risk resulting from a range of carbon exposure reduction targets. We observe that average active risk only begins to rise beyond a 50% reduction in active carbon exposure.
Hypothetical Legal Disclaimer
Acadian is providing hypothetical performance information for your review as we believe you have access to resources to independently analyze this information and have the financial expertise to understand the risks and limitations of the presentation of hypothetical performance. Please immediately advise if that is not the case.
Hypothetical performance results have many inherent limitations, some of which are described below. No representation is being made that any account will or is likely to achieve profits or losses similar to those shown. In fact, there are frequently sharp differences between hypothetical performance results and the actual performance results subsequently achieved by any particular trading program.
One of the limitations of hypothetical performance results is that they are generally prepared with the benefit of hindsight. In addition, hypothetical trading does not involve financial risk, and no hypothetical trading record can completely account for the impact of financial risk in actual trading. For example, the ability to withstand losses or to adhere to a particular trading program in spite of trading losses are material points which can also adversely affect actual trading results. There are numerous other factors related to the markets in general or to the implementation of any specific trading program which cannot be fully accounted for in the preparation of hypothetical performance results and all of which can adversely affect actual trading results.
Legal Disclaimer
These materials provided herein may contain material, non-public information within the meaning of the United States Federal Securities Laws with respect to Acadian Asset Management LLC, Acadian Asset Management Inc. and/or their respective subsidiaries and affiliated entities. The recipient of these materials agrees that it will not use any confidential information that may be contained herein to execute or recommend transactions in securities. The recipient further acknowledges that it is aware that United States Federal and State securities laws prohibit any person or entity who has material, non-public information about a publicly-traded company from purchasing or selling securities of such company, or from communicating such information to any other person or entity under circumstances in which it is reasonably foreseeable that such person or entity is likely to sell or purchase such securities.
Acadian provides this material as a general overview of the firm, our processes and our investment capabilities. It has been provided for informational purposes only. It does not constitute or form part of any offer to issue or sell, or any solicitation of any offer to subscribe or to purchase, shares, units or other interests in investments that may be referred to herein and must not be construed as investment or financial product advice. Acadian has not considered any reader's financial situation, objective or needs in providing the relevant information.
The value of investments may fall as well as rise and you may not get back your original investment. Past performance is not necessarily a guide to future performance or returns. Acadian has taken all reasonable care to ensure that the information contained in this material is accurate at the time of its distribution, no representation or warranty, express or implied, is made as to the accuracy, reliability or completeness of such information.
This material contains privileged and confidential information and is intended only for the recipient/s. Any distribution, reproduction or other use of this presentation by recipients is strictly prohibited. If you are not the intended recipient and this presentation has been sent or passed on to you in error, please contact us immediately. Confidentiality and privilege are not lost by this presentation having been sent or passed on to you in error.
Acadian’s quantitative investment process is supported by extensive proprietary computer code. Acadian’s researchers, software developers, and IT teams follow a structured design, development, testing, change control, and review processes during the development of its systems and the implementation within our investment process. These controls and their effectiveness are subject to regular internal reviews, at least annual independent review by our SOC1 auditor. However, despite these extensive controls it is possible that errors may occur in coding and within the investment process, as is the case with any complex software or data-driven model, and no guarantee or warranty can be provided that any quantitative investment model is completely free of errors. Any such errors could have a negative impact on investment results. We have in place control systems and processes which are intended to identify in a timely manner any such errors which would have a material impact on the investment process.
Acadian Asset Management LLC has wholly owned affiliates located in London, Singapore, and Sydney. Pursuant to the terms of service level agreements with each affiliate, employees of Acadian Asset Management LLC may provide certain services on behalf of each affiliate and employees of each affiliate may provide certain administrative services, including marketing and client service, on behalf of Acadian Asset Management LLC.
Acadian Asset Management LLC is registered as an investment adviser with the U.S. Securities and Exchange Commission. Registration of an investment adviser does not imply any level of skill or training.
Acadian Asset Management (Singapore) Pte Ltd, (Registration Number: 199902125D) is licensed by the Monetary Authority of Singapore. It is also registered as an investment adviser with the U.S. Securities and Exchange Commission.
Acadian Asset Management (Australia) Limited (ABN 41 114 200 127) is the holder of Australian financial services license number 291872 ("AFSL"). It is also registered as an investment adviser with the U.S. Securities and Exchange Commission. Under the terms of its AFSL, Acadian Asset Management (Australia) Limited is limited to providing the financial services under its license to wholesale clients only. This marketing material is not to be provided to retail clients.
Acadian Asset Management (UK) Limited is authorized and regulated by the Financial Conduct Authority ('the FCA') and is a limited liability company incorporated in England and Wales with company number 05644066. Acadian Asset Management (UK) Limited will only make this material available to Professional Clients and Eligible Counterparties as defined by the FCA under the Markets in Financial Instruments Directive, or to Qualified Investors in Switzerland as defined in the Collective Investment Schemes Act, as applicable.