U.S. Equities: Back to the Future?
Key Takeaways
-
U.S. large-cap growth stocks have delivered exceptional returns year-to-date with a handful of mega-cap tech stocks accounting for nearly 90% of the U.S. market’s gains.
-
We view this runup as an overextrapolation of a modest improvement in fundamentals that does not warrant such price action.
-
As such, we see this speculative excess as an opportunity to deploy capital into more attractively valued equities both within, and especially outside, the U.S.
Table of contents
For many investors, the past three months might conjure up a sense of déjà vu. In a pattern reminiscent of the COVID era, U.S. tech-oriented large-cap growth stock multiples have exploded. On the back of their strength, U.S. equities have overtaken other developed and emerging markets in terms of year-to-date performance. (Figure 1)
Figure 1: 2023 Year-to-Date Performance—Select MSCI Equity Indexes
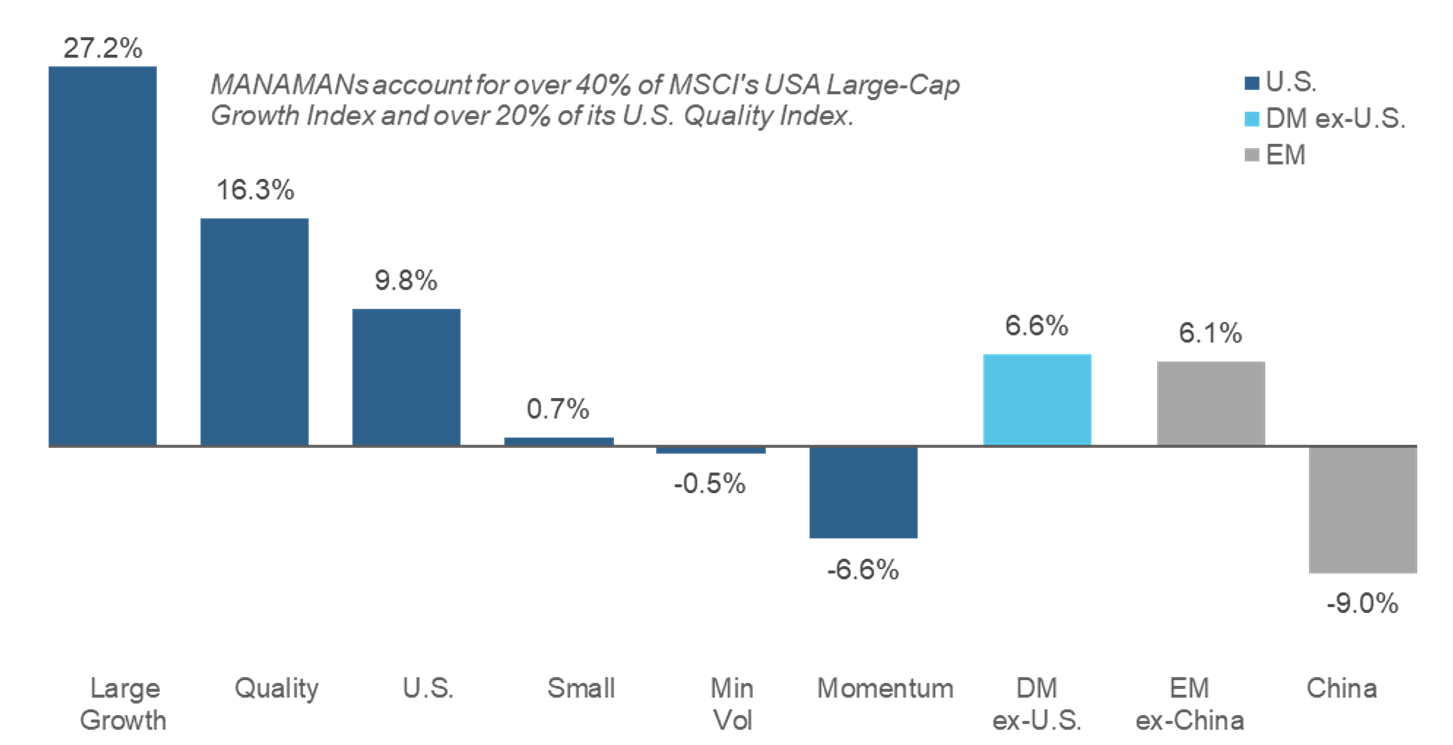
In this brief note, we offer our take on salient themes that have driven equity market performance in 2023 as well as on the outlook going forward. While the U.S. large-cap growth runup has a basis in economics and fundamentals, we provide evidence that valuations have become stretched. Based on that view, we believe that U.S. large-cap growth has again become expensive and, by extension, that other markets and market segments look relatively attractive.
A Narrow Rally
Through the first five months of the year, U.S. equities have risen nearly 10%. They have recently pulled ahead of other developed markets (DM) and are well in front of emerging markets (EM) too, which are roughly flat on the year. Large-cap growth stocks have led the way; the MSCI USA Large Cap Growth Index has climbed more than 27%, much of that during a steady advance since mid-March.
As has been chronicled in the financial media, however, the runup has been quite narrowly based. Just seven large-cap tech companies, which we might refer to as the MANAMANs,1 have accounted for almost 90% of the MSCI USA Index’s gain.2 Moreover, MSCI’s Small Cap U.S. growth benchmark has underperformed its large-cap cousin by a remarkable 21% YTD.
For investors, a key question is whether this narrow tech-led U.S. growth rally will persist or might even herald a resumption of explosive multiple expansion characteristic of the COVID era.
Drivers of the Runup
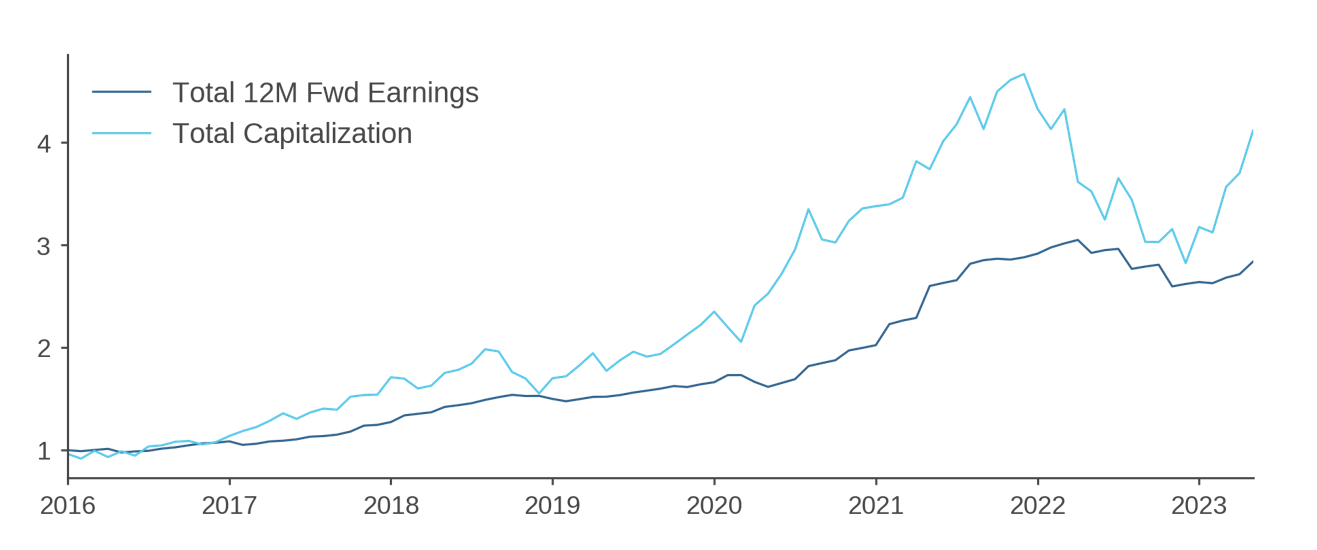
Undoubtedly, substantive fundamental and economic drivers have contributed to this runup. The dark blue trace in Figure 2 shows that earnings estimates for the MANAMANs stabilized in early 2023 and have risen since, increasing 5% in May alone. This reflected a combination of factors, including some reduction in concern about a Fed-led contraction as inflation started to cool. It has also reflected a ChatGPT-inspired focus on advancements in AI and hopes for its commercialization. Several of the MANAMANs are viewed as direct beneficiaries of these technologies because they produce inputs required to apply them in scale, especially the chip-designer NVIDIA, or have made substantial early investments in AI itself, such as Microsoft, Apple, and Alphabet.
Figure 2: MANAMAN Earnings Expectations and Market Capitalizations
Normalized versus December 31, 2015
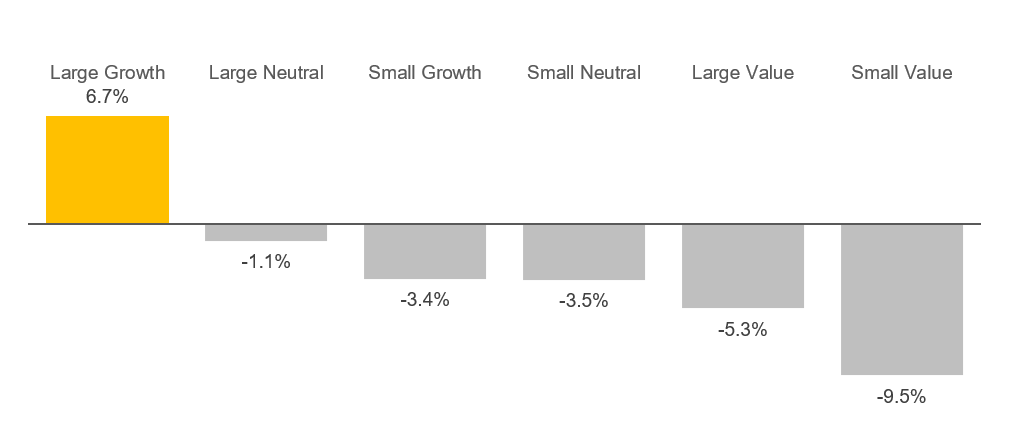
But aspects of sentiment have played a role as well. Large-cap growth stocks benefited from a flight to quality during March, as investors sought the most reliable producers of fundamental earnings growth amid concerns that financial instability originating with regional U.S. banks might weigh on the economy. In fact, Figure 3 shows that the Fama-French U.S. large-cap growth portfolio dramatically outperformed all other market segments during March.
Figure 3: March 2023 Performance—Select U.S. Equity Style Groups
Speculation and Growth Valuations
But in this runup we also see signs of renewed speculation that is vulnerable to reversion. Tech stocks, and particularly AI-related ones, are behaving much like “work from home” stocks did in 2020. Returning to Figure 2, the light blue trace shows that price increases have far outstripped the rise in earnings expectations, suggesting that investors are capitalizing expectations of even higher future growth. In fact, collective MANAMAN market values are within 15% of their 2021 peak. Moreover, Figure 4 documents that forward-earnings multiples of the MANAMANs have expanded dramatically during 2023, and much more so than major equity indexes. The MANAMAN premium versus the U.S. index is essentially at highs last seen in August 2020. At a time when discount rates are substantially higher than their 2020 lows, long-term earnings growth rates would have to rise sharply to justify MANAMANs’ current multiples.
Figure 4: Price to Forward Earnings Ratios—MANAMANs vs Select MSCI Equity Indexes
12M Forward P/E (Percent Change) as of May 31, 2023
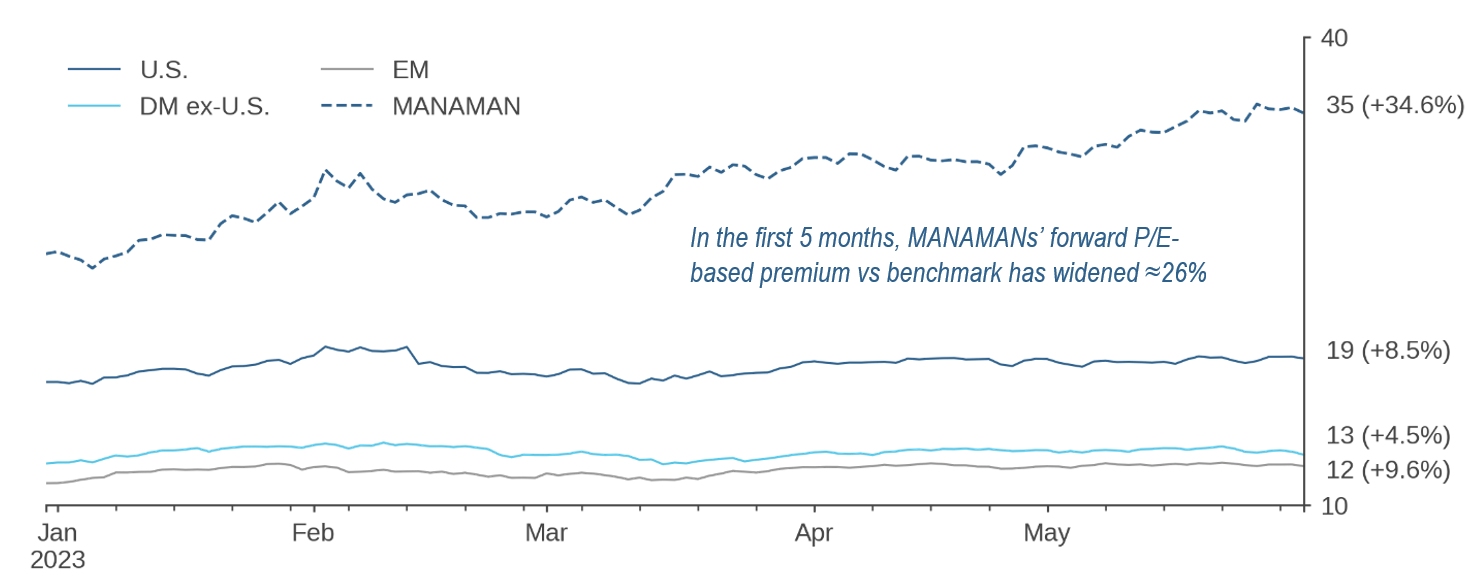
Given this evidence, we view U.S. large-growth stocks, and the benchmarks in which they have significant weight, as vulnerable to retracement relative to the broader market and non-U.S. equities. In fact, as Figure 4 shows, U.S. equities currently trade at a significant premium, on the order of 50%, relative to other markets.3 This is not a call that the U.S. will falter as an engine of technological innovation, with respect to AI or more broadly, or that the U.S. market is due for a major drawdown. Rather, it is a view about relative attractiveness on the basis of valuations. This is also not to say that all AI-related companies are overvalued. The present context is one in which we would expect markets to have trouble understanding and evaluating the complex web of relationships that companies have with these new technologies.4 Indeed, for some stocks, the market may not appreciate the potential for fundamental growth, and for others, sentiment may become so strong as to warrant a forecast of further gains in the short-term.
Conclusion
In our 2020 work on diversification, we cautioned investors against chasing strong performance of U.S. large-cap growth stocks.5 Their protracted run of dominance ended abruptly in 2022. As we consider the environment today, we would see this speculative excess as an impetus to seek out more attractively valued areas of the equity markets both within the U.S. and, particularly, elsewhere.
Endnotes
- Microsoft, Apple, Netflix, Alphabet, Meta, Amazon, and Nvidia. References to these and any other specific companies in this write-up should not be construed as recommendations to buy or sell any securities.
- 8.8% of 9.8% through May 31, 2023.
- For more details, see Opportunities Beyond U.S. Shores, Acadian, 2023.
- Perhaps indicative of the challenges facing investors in parsing corporate rhetoric around the use of AI, FactSet noted that more companies used the term “AI” in Q1 2023 earnings calls than at any point over the prior decade.
- See Re-examining Diversification: 20/20 Perspective, Acadian, 2020.
Hypothetical Legal Disclaimer
Acadian is providing hypothetical performance information for your review as we believe you have access to resources to independently analyze this information and have the financial expertise to understand the risks and limitations of the presentation of hypothetical performance. Please immediately advise if that is not the case.
Hypothetical performance results have many inherent limitations, some of which are described below. No representation is being made that any account will or is likely to achieve profits or losses similar to those shown. In fact, there are frequently sharp differences between hypothetical performance results and the actual performance results subsequently achieved by any particular trading program.
One of the limitations of hypothetical performance results is that they are generally prepared with the benefit of hindsight. In addition, hypothetical trading does not involve financial risk, and no hypothetical trading record can completely account for the impact of financial risk in actual trading. For example, the ability to withstand losses or to adhere to a particular trading program in spite of trading losses are material points which can also adversely affect actual trading results. There are numerous other factors related to the markets in general or to the implementation of any specific trading program which cannot be fully accounted for in the preparation of hypothetical performance results and all of which can adversely affect actual trading results.
Legal Disclaimer
These materials provided herein may contain material, non-public information within the meaning of the United States Federal Securities Laws with respect to Acadian Asset Management LLC, Acadian Asset Management Inc. and/or their respective subsidiaries and affiliated entities. The recipient of these materials agrees that it will not use any confidential information that may be contained herein to execute or recommend transactions in securities. The recipient further acknowledges that it is aware that United States Federal and State securities laws prohibit any person or entity who has material, non-public information about a publicly-traded company from purchasing or selling securities of such company, or from communicating such information to any other person or entity under circumstances in which it is reasonably foreseeable that such person or entity is likely to sell or purchase such securities.
Acadian provides this material as a general overview of the firm, our processes and our investment capabilities. It has been provided for informational purposes only. It does not constitute or form part of any offer to issue or sell, or any solicitation of any offer to subscribe or to purchase, shares, units or other interests in investments that may be referred to herein and must not be construed as investment or financial product advice. Acadian has not considered any reader's financial situation, objective or needs in providing the relevant information.
The value of investments may fall as well as rise and you may not get back your original investment. Past performance is not necessarily a guide to future performance or returns. Acadian has taken all reasonable care to ensure that the information contained in this material is accurate at the time of its distribution, no representation or warranty, express or implied, is made as to the accuracy, reliability or completeness of such information.
This material contains privileged and confidential information and is intended only for the recipient/s. Any distribution, reproduction or other use of this presentation by recipients is strictly prohibited. If you are not the intended recipient and this presentation has been sent or passed on to you in error, please contact us immediately. Confidentiality and privilege are not lost by this presentation having been sent or passed on to you in error.
Acadian’s quantitative investment process is supported by extensive proprietary computer code. Acadian’s researchers, software developers, and IT teams follow a structured design, development, testing, change control, and review processes during the development of its systems and the implementation within our investment process. These controls and their effectiveness are subject to regular internal reviews, at least annual independent review by our SOC1 auditor. However, despite these extensive controls it is possible that errors may occur in coding and within the investment process, as is the case with any complex software or data-driven model, and no guarantee or warranty can be provided that any quantitative investment model is completely free of errors. Any such errors could have a negative impact on investment results. We have in place control systems and processes which are intended to identify in a timely manner any such errors which would have a material impact on the investment process.
Acadian Asset Management LLC has wholly owned affiliates located in London, Singapore, and Sydney. Pursuant to the terms of service level agreements with each affiliate, employees of Acadian Asset Management LLC may provide certain services on behalf of each affiliate and employees of each affiliate may provide certain administrative services, including marketing and client service, on behalf of Acadian Asset Management LLC.
Acadian Asset Management LLC is registered as an investment adviser with the U.S. Securities and Exchange Commission. Registration of an investment adviser does not imply any level of skill or training.
Acadian Asset Management (Singapore) Pte Ltd, (Registration Number: 199902125D) is licensed by the Monetary Authority of Singapore. It is also registered as an investment adviser with the U.S. Securities and Exchange Commission.
Acadian Asset Management (Australia) Limited (ABN 41 114 200 127) is the holder of Australian financial services license number 291872 ("AFSL"). It is also registered as an investment adviser with the U.S. Securities and Exchange Commission. Under the terms of its AFSL, Acadian Asset Management (Australia) Limited is limited to providing the financial services under its license to wholesale clients only. This marketing material is not to be provided to retail clients.
Acadian Asset Management (UK) Limited is authorized and regulated by the Financial Conduct Authority ('the FCA') and is a limited liability company incorporated in England and Wales with company number 05644066. Acadian Asset Management (UK) Limited will only make this material available to Professional Clients and Eligible Counterparties as defined by the FCA under the Markets in Financial Instruments Directive, or to Qualified Investors in Switzerland as defined in the Collective Investment Schemes Act, as applicable.
Biographies