Sentiment Versus Fundamentals: The Current Case for EM over U.S. Equity
-
Over Q2 and much of Q3, the U.S. thematic sentiment-driven rally broadened from a handful of tech giants to include a large swath of unprofitable stocks.
-
In contrast, equity returns in EM have remained more closely tethered to fundamentals.
-
Better-grounded earnings expectations, and the potential for a pause in monetary tightening, favor equity allocations to EM over the U.S.
Table of contents
Markets, Ben Graham said, work like a voting machine in the short term but like a weighing machine in the long term. Over much of 2023, this aphorism well characterizes the divergent behavior of U.S. and EM equity markets. The U.S. has been caught up by thematic sentiment and thereby resembles a voting machine, while EM has been trading more soberly based on fundamentals, resembling a weighing machine. As a result, fundamentally oriented active investing approaches have performed well in EM but have been challenged in the U.S.
The U.S.: Speculative Sentiment Propels Growth Stocks (Again)
Global equity markets have delivered strong returns year-to-date, with the U.S. leading the way. Although a small group of stocks, often referred to as "the Magnificent Seven" has captured the lion’s share of investor attention, their influence on returns has not been as dominant since late Q2. 1 During the last four months, other high-beta stocks, including companies with negative earnings, have delivered strong returns. Figure 1 demonstrates this trend, showing that the historically large outperformance of high-beta stocks this year is substantial even when we remove the Magnificent Seven from that cohort.
Figure 1: A Historic Year for U.S. High-Beta Stocks
2023 data is year-to-date, as of end-September (not annualized)

In the past, such strong high-beta performance has coincided with recovery from significant global systemic shocks, such as the Global Financial Crisis (2009) and the onset of the pandemic (2020). However, in the absence of a post-recessionary driver, 2023’s returns to U.S. high-beta stocks are best viewed as a rapid reflation of earnings expectations for tech-oriented growth stocks catalyzed by AI-centric speculation. In a nutshell, among U.S. equities, investors have thrown their weight behind thematic sentiment.
This U.S. investing climate resembles the frothy environment that characterized 2020-21.2 Seen through a factor lens in the left panel of Figure 2, expensive, growth-oriented stocks have delivered strong returns and outperformed cheap stocks by a wide margin. Moreover, the figure also shows robust returns from unprofitable stocks—a group that, in the U.S., features many early-stage, tech-oriented companies.
Figure 2: U.S. – Returns to Fundamentally Oriented Factors
Year-to-date as of Aug 31, 2023
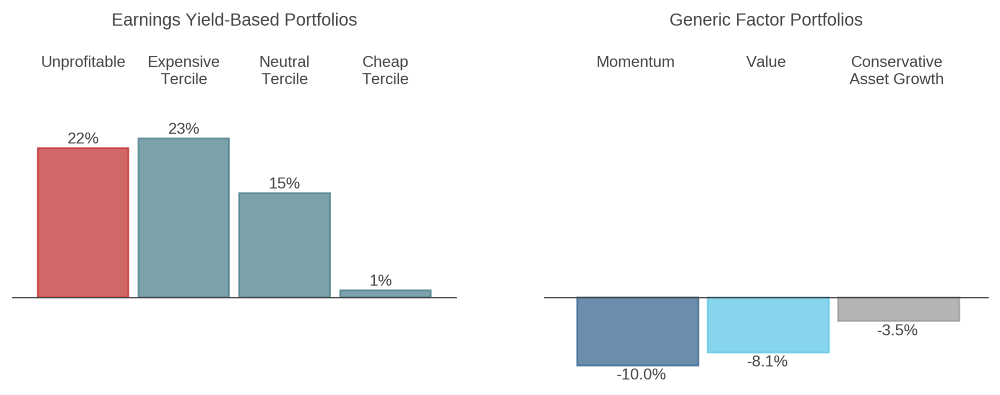
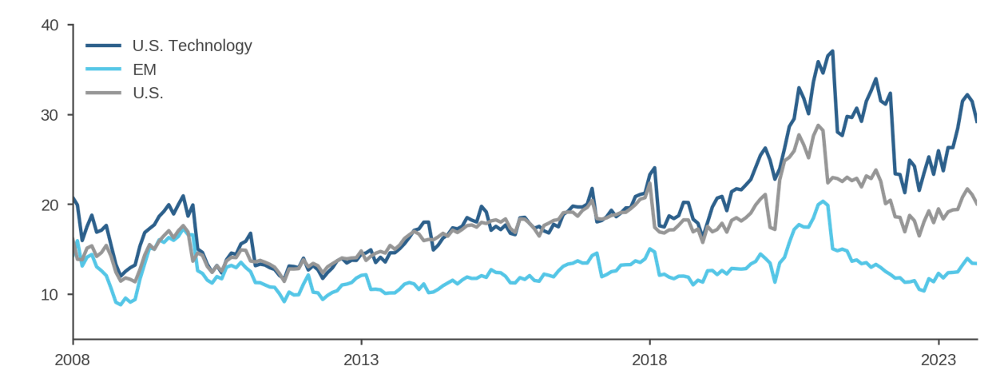
The right panel of Figure 2 adds further detail. It shows that high-momentum stocks underperformed (dark blue). Although momentum delivered strong returns in 2022, it suffered from an abrupt reversal as last year’s losers in IT, consumer discretionary, and communication services have run-up. In addition, the underperformance of companies that invest conservatively (grey) is further evidence that investors pursued aggressive growth. In our view, valuations have become stretched as a consequence of the sentiment-driven rally, notwithstanding the market’s modest retracement in recent weeks (Figure 3). For profitable U.S. tech firms, earnings expectations quickly rebounded to highs from early 2022, prior to the start of monetary tightening. Moreover, pandemic-era tailwinds that helped to elevate those lofty expectations have been fading. Instead, these tech companies face a much higher cost of capital and a challenging operating environment as wage pressures remain strong. Though AI-oriented investments may pay off over the long run for these firms, their current focus is on boosting profitability through cost-cutting measures.3 For unprofitable tech firms, higher interest rates may imply shorter runways to positive earnings than they enjoyed during most of the post-GFC era.4
Figure 3: U.S. Technology Valuations Remain Stretched
Price to Forward Earnings Ratios, 2008 – Sep 2023
EM: A Stronger Tether to Fundamentals
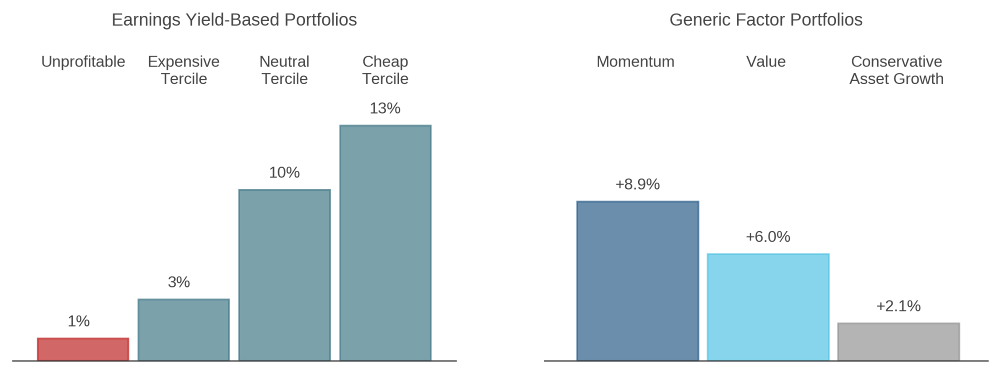
Emerging markets have behaved very differently than the U.S. this year. The left panel of Figure 4 shows that in EM, expensive stocks—both those with earnings and those that are unprofitable—have underperformed the benchmark. In other words, in EM, investors seem to be “weighing” current profits rather than channeling thematic sentiment.5 In fact, the right panel of the figure shows that EM performance drivers were nearly the mirror image of those in the U.S. and that there were positive payoffs from exposure to cheap, conservative companies and positive price momentum.
Figure 4: EM – Returns to Fundamentally Oriented Factors
Year-to-date as of Aug 31, 2023
Explaining the Divergence
Differences in industrial structure have contributed to regional variation in the expression of thematic sentiment. The U.S., as the engine of technological innovation backed by the Silicon Valley ecosystem, provides greater access to stocks in generative AI and related technologies. Furthermore, prominent examples of unprofitable companies transforming into industry leaders, such as Tesla in 2020-21, have left investors, and perhaps even analysts, vulnerable to behavioral biases that can inflame speculation. For example, they may be anchoring current valuations to the frothy price levels and earnings expectations of 2020-21 or overestimating the likelihood that a given unprofitable company will become the next Tesla or Nvidia.6 As a result, we expect AI-driven sentiment to remain overly pervasive in the near-term as investors struggle to differentiate signal from noise around AI, with companies continuing to vie for their attention.
In EM, in contrast, growth-oriented sentiment has been tempered by the flare-up in U.S.-China geopolitical tensions and a slower-than-expected recovery in China. This has shifted the focus among investors to current profits. Moreover, unlike in 2018-20 when EM tech stocks enjoyed multiple expansion in an environment of perceived regulatory permissiveness, more recently the market has become sensitive to potential regulatory pressures, which has helped to keep a lid on multiples.
Growth Equities: Sentiment Not Rates
An alternative explanation that has been offered for the U.S. growth stock-led rebound is that anticipation of an end to monetary tightening may be decreasing the discount rate that investors are applying to cash flows. As the argument goes, tech-oriented growthy stocks, and especially currently unprofitable ones, are “longer duration” assets than other equities because their earnings are further in the future. As a result, they might benefit more on a relative basis from falling rate expectations.
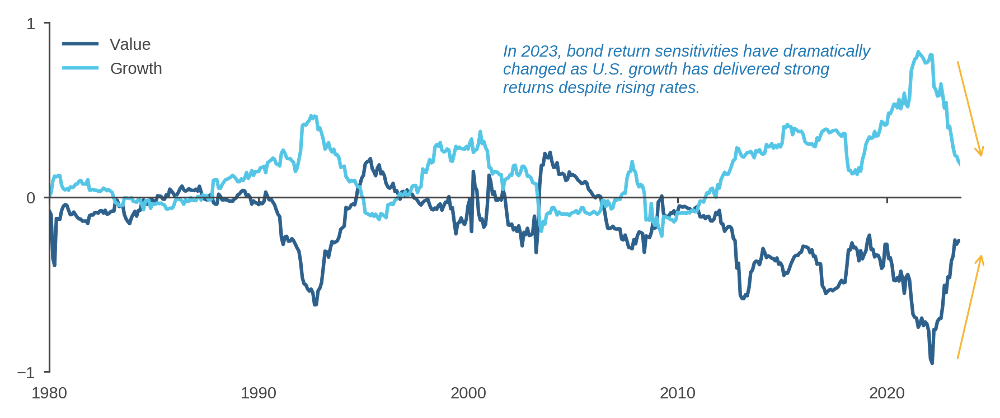
As we noted in prior research, however, the empirical relationship between value-growth and interest rates may be an artifact of the 2010s rather than a dependable market feature. 7 In fact, during 2023, rate expectations were rising as growth equities outperformed, contrary to the prediction of DCF-based priors. As a result, growth equities’ measured sensitivity to bonds has sharply fallen. (Figure 5) Based on these observations, we think the case is all the stronger that growth-value dynamics have been influenced by sentiment more than (mechanically) by interest rates.
Figure 5: Growth/Value Sensitivity to 10-year Bond Returns
Bond Betas through Aug 31, 2023
From an allocation perspective, we would view the end of tightening, accompanied by lower inflation, as of particular benefit to emerging economies, through the easing of financial conditions.8 As such, we find the contrast between optimism regarding the U.S. and diffidence towards EM particularly striking.
Conclusion
In the U.S., unprofitable and high-beta tech stocks have, in recent months, joined what was originally a narrower rally led by the Magnificent Seven. In EM, by contrast, investors have been more cautious, and stocks have been tethered more closely to fundamentals. As a result, we view EM equities as appealing relative to the U.S., where valuations remain stretched, and the market seems relatively vulnerable, once again, to a potential shift in sentiment.
Endnotes
- The Magnificent Seven refers to Microsoft, Apple, Netflix, Alphabet, Meta, Amazon, and Nvidia. References to these and any other specific companies in this write-up should not be construed as recommendations to buy or sell any securities
- For detailed analysis of this period, see Growth vs Value: End of an Era, Acadian, 2021 and Managed Volatility in the Pandemic: The One-Year Anniversary, Acadian, March 2021.
- See, for example, A comprehensive list of 2023 tech layoffs, TechCrunch, September 29, 2023.
- Rate Hikes Curb Innovation and Economic Output, Jackson Hole Paper Finds, Bloomberg, August 25, 2023.
- Returns in EM ex-China present a broadly similar picture as to the rest of EM. Contact us for details.
- The latter is a manifestation of the representativeness heuristic.
- Please see Value vs Rates: Don’t Believe (All) the Hype, Acadian, 2021 for further discussion.
- E.g., see Are Rising U.S. Interest Rates Destabilizing for Emerging Market Economies?, Federal Reserve Economic Research, June 23, 2021.
Hypothetical
Acadian is providing hypothetical performance information for your review as we believe you have access to resources to independently analyze this information and have the financial expertise to understand the risks and limitations of the presentation of hypothetical performance. Please immediately advise if that is not the case.
Hypothetical performance results have many inherent limitations, some of which are described below. No representation is being made that any account will or is likely to achieve profits or losses similar to those shown. In fact, there are frequently sharp differences between hypothetical performance results and the actual performance results subsequently achieved by any particular trading program.
One of the limitations of hypothetical performance results is that they are generally prepared with the benefit of hindsight. In addition, hypothetical trading does not involve financial risk, and no hypothetical trading record can completely account for the impact of financial risk in actual trading. For example, the ability to withstand losses or to adhere to a particular trading program in spite of trading losses are material points which can also adversely affect actual trading results. There are numerous other factors related to the markets in general or to the implementation of any specific trading program which cannot be fully accounted for in the preparation of hypothetical performance results and all of which can adversely affect actual trading results.
Legal Disclaimer
These materials provided herein may contain material, non-public information within the meaning of the United States Federal Securities Laws with respect to Acadian Asset Management LLC, BrightSphere Investment Group Inc. and/or their respective subsidiaries and affiliated entities. The recipient of these materials agrees that it will not use any confidential information that may be contained herein to execute or recommend transactions in securities. The recipient further acknowledges that it is aware that United States Federal and State securities laws prohibit any person or entity who has material, non-public information about a publicly-traded company from purchasing or selling securities of such company, or from communicating such information to any other person or entity under circumstances in which it is reasonably foreseeable that such person or entity is likely to sell or purchase such securities.
Acadian provides this material as a general overview of the firm, our processes and our investment capabilities. It has been provided for informational purposes only. It does not constitute or form part of any offer to issue or sell, or any solicitation of any offer to subscribe or to purchase, shares, units or other interests in investments that may be referred to herein and must not be construed as investment or financial product advice. Acadian has not considered any reader's financial situation, objective or needs in providing the relevant information.
The value of investments may fall as well as rise and you may not get back your original investment. Past performance is not necessarily a guide to future performance or returns. Acadian has taken all reasonable care to ensure that the information contained in this material is accurate at the time of its distribution, no representation or warranty, express or implied, is made as to the accuracy, reliability or completeness of such information.
This material contains privileged and confidential information and is intended only for the recipient/s. Any distribution, reproduction or other use of this presentation by recipients is strictly prohibited. If you are not the intended recipient and this presentation has been sent or passed on to you in error, please contact us immediately. Confidentiality and privilege are not lost by this presentation having been sent or passed on to you in error.
Acadian’s quantitative investment process is supported by extensive proprietary computer code. Acadian’s researchers, software developers, and IT teams follow a structured design, development, testing, change control, and review processes during the development of its systems and the implementation within our investment process. These controls and their effectiveness are subject to regular internal reviews, at least annual independent review by our SOC1 auditor. However, despite these extensive controls it is possible that errors may occur in coding and within the investment process, as is the case with any complex software or data-driven model, and no guarantee or warranty can be provided that any quantitative investment model is completely free of errors. Any such errors could have a negative impact on investment results. We have in place control systems and processes which are intended to identify in a timely manner any such errors which would have a material impact on the investment process.
Acadian Asset Management LLC has wholly owned affiliates located in London, Singapore, and Sydney. Pursuant to the terms of service level agreements with each affiliate, employees of Acadian Asset Management LLC may provide certain services on behalf of each affiliate and employees of each affiliate may provide certain administrative services, including marketing and client service, on behalf of Acadian Asset Management LLC.
Acadian Asset Management LLC is registered as an investment adviser with the U.S. Securities and Exchange Commission. Registration of an investment adviser does not imply any level of skill or training.
Acadian Asset Management (Singapore) Pte Ltd, (Registration Number: 199902125D) is licensed by the Monetary Authority of Singapore. It is also registered as an investment adviser with the U.S. Securities and Exchange Commission.
Acadian Asset Management (Australia) Limited (ABN 41 114 200 127) is the holder of Australian financial services license number 291872 ("AFSL"). It is also registered as an investment adviser with the U.S. Securities and Exchange Commission. Under the terms of its AFSL, Acadian Asset Management (Australia) Limited is limited to providing the financial services under its license to wholesale clients only. This marketing material is not to be provided to retail clients.
Acadian Asset Management (UK) Limited is authorized and regulated by the Financial Conduct Authority ('the FCA') and is a limited liability company incorporated in England and Wales with company number 05644066. Acadian Asset Management (UK) Limited will only make this material available to Professional Clients and Eligible Counterparties as defined by the FCA under the Markets in Financial Instruments Directive, or to Qualified Investors in Switzerland as defined in the Collective Investment Schemes Act, as applicable.
About the Authors