Beta Indexing and Valuations
Table of contents
May 2016
Introduction
Contrary to a currently popular narrative, over the ten years 2006-2016, lower-beta stocks have had lower average valuations than higher-beta stocks. Even in 2016, lower-beta stocks have no valuation premium, unless extreme-valued stocks, which tend to have higher betas, are not considered. Higher-beta countries and industries have higher valuations in later years, a reversal from 2006.
In all years, the ranges of valuations within lower-beta stocks and within higher-beta stocks are wide, suggesting meaningful opportunity for stock selection based on valuations. Importantly, stocks included in MSCI’s Minimum Volatility index have very high valuations indeed.*
Equity strategies that overweight lower-beta or lower-volatility stocks recently have attracted press and investment attention. In part this attention may simply reflect perceived investment opportunity, based on arguments that lower risk stocks are materially and persistently mispriced (see, e.g., Baker et al. 2011). However, recent market commentary also has focused on these stocks’ valuations, sparked by high valuations of lower-volatility equity indexes like MSCI’s Minimum Volatility index. This paper documents the high average price-to-book (P/B) valuations of constituents of MSCI’s index, but cautions against extrapolating this result to be generally true for all lower-beta and lower-volatility stocks. In fact, quite the opposite is the case: the general pattern is that lower-beta stocks have lower P/Bs than higher-beta stocks. We also document valuation patterns according to stocks’ market capitalizations, their country and industry affiliations, and their interest rate sensitivities (that is, their tendencies to behave more or less like bonds as interest rates rise and fall).
We find that over the past decade, consistent with equity markets rising by over 40% (60% in the U.S.), countries and industries that have higher equity betas now have higher valuations, whereas a decade ago the opposite was true. Similarly, stocks with more bond-like characteristics, i.e., stocks that tend to outperform when interest rates fall, have a valuation premium in 2016, whereas they had no premium or a negative premium (depending on measurement) in 2006. This change in valuations is consistent with interest rates falling around the world over the decade. Finally, we find that in all periods, the ranges of valuations within lower-beta stocks and within higher-beta stocks are wide, suggesting that there is opportunity for valuation-based stock selection.
We emphasize three observations in connection with the points above. First, there is a range of valuations within groupings of both lower- and higher-beta stocks. Second, at present, there is no general valuation premium on lower-beta stocks; however, there does appear to be a valuation premium on stocks with low (bond-like) interest rate sensitivity. Third, certain constituents of MSCI’s Minimum Volatility index have dramatic valuations, and the index itself has a high average valuation overall.
Details
For our analysis we collected data for a full universe of developed market stocks on three dates: July 31, 2006, March 31, 2008, and January 31, 2016. The earliest date is the day before the inception of Acadian’s Global Managed Volatility equity composite; the second date is two weeks before the inception of MSCI’s World Minimum Volatility index; and the latest date is a recent date in 2016. On each date we collected the following information:
- the stocks’ most recent price-to-book (P/B) ratios;
- their betas to MSCI’s World equity index, according to an investment-caliber risk model that incorporates (only) information that was known on each respective date;1
- their most recent market capitalizations, which we make less positively skewed by taking the natural logarithm;
- their interest rate sensitivities, as measured by regressions of their returns on changes in long-term government bond yields over the prior three years;2
- their inclusion or exclusion (when applicable, after inception) in MSCI’s World Minimum Volatility index;
- their country and industry affiliations.
Table 1 presents summary statistics for these variables on each observation date. Mean P/B in the sample fell from 2.89 in 2006 to 2.09 in 2008, before rising back to 2.61 in 2016. Over this period, the range of valuations compressed dramatically from 2006 to 2008, before expanding even more dramatically through 2016, as evidenced both by the standard deviations in the second data column, and by the inter-quartile ranges in the third and fifth data columns. Average betas (β) in the sample fell monotonically over the decade, from 1.05 down to 0.90, while the range of betas stayed roughly constant. (Table 1 presents equal-weighted moments: changes in the average beta thus is attributable to shifting distributions of the betas of smaller-cap stocks.) The average (log) size of firms (ln ME) has increased modestly over the period, by about 16% in levels, a pattern consistent with contemporaneously rising equity markets. At the same time, the cross-sectional range of market capitalizations has remained relatively stable over the decade. The interest rate sensitivity (y) of stocks was positive in 2006 and 2008, meaning that the average stock tended to outperform when long-term interest rates rose, but by 2016 the interest rate sensitivity of the average stock was about zero. After its 2008 inception, MSCI included roughly 3% of stocks in its World Minimum Volatility index in 2008 and 2016, as measured by the cross-sectional average of the membership indicator variable (1i∈M).
Table 1
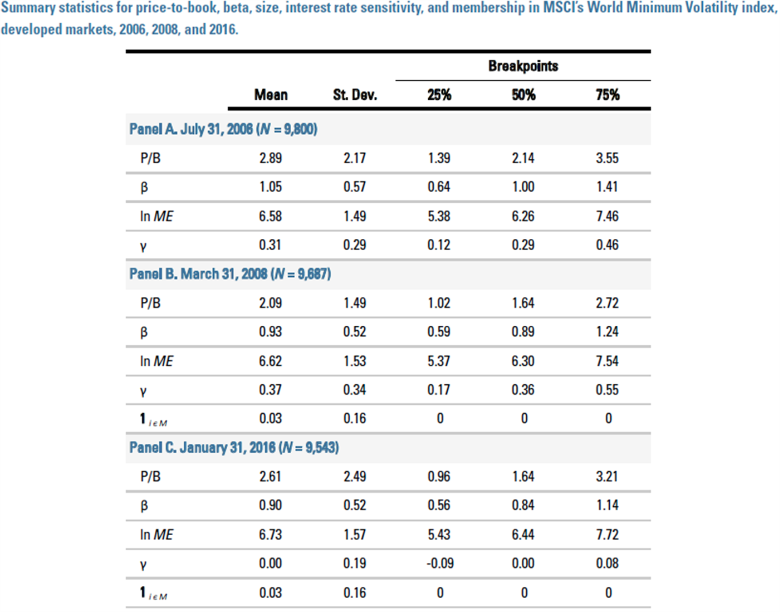
Table 2 presents results of cross-sectional regressions of P/B on the various stock characteristics. The first six data columns report results for regressions that do not incorporate controls for countries and industries, while the second six data columns include a full set of country and industry dummy variables. In both sets of columns, the first columns present results for univariate regressions, while the later columns present multivariate estimations. Numbers in brackets are t-statistics, and bold-face indicates significance at the 5% level.
Table 2
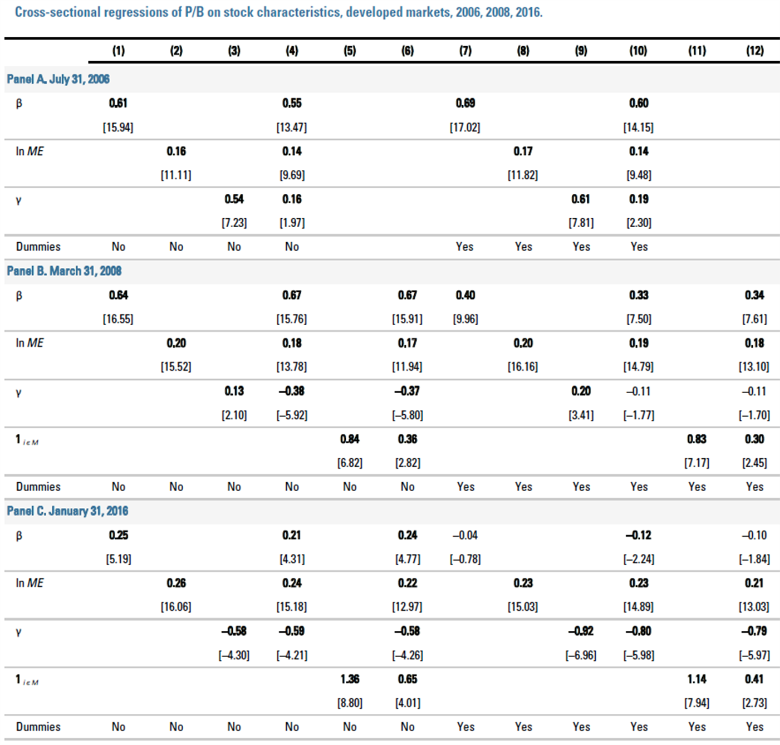
Estimates for the relationship between P/B and beta are positive and significant in 2006 (Panel A) and 2008 (Panel B), with (column 7) or without (column 1) controls for countries and industries. In 2006 the association was clear, if not overly strong, with an increase in market exposure (beta) of 0.10 being associated with a P/B that was higher by about 0.06 (0.6 x 0.10), with and without controls. However, in 2008, inclusion of country and industry controls reduced point estimates by a third to a half, suggesting that in early 2008, higher-beta countries and industries had higher valuations.
A similar relationship between beta, valuations, and country-industry affiliation does not appear in 2016. By 2016 (Panel C), the positive relationship between beta and P/B had fallen materially, and inclusion of country and industry controls eliminates the effect entirely. Thus, by 2016, the only relationship between beta and valuations was via the country-industry channel: higher-beta countries and industries had higher valuations, but there was no relationship between valuation and beta within countries and industries.
Estimates of the link between size (ln ME) and beta are statistically and economically significant for all observation dates, irrespective of the inclusion of controls. Larger-capitalization firms have higher valuations, roughly an additional 0.14 of P/B for every doubling of size (0.2 x ln 2).
The link between interest rate sensitivity (y) and valuations is the most variable over time and the most dependent on the inclusion of controls. In 2006, stocks with more positive interest rate sensitivity (i.e., those with less bond-like behavior) had higher valuations, though with controls for beta and size the relationship deteriorated materially. Less than two years later, the link had changed sign, so that more bond-like stocks had higher valuations, after controlling for beta and size. However, additional controls for country and industry eliminate this pattern’s statistical significance, suggesting that in early 2008, more bond-like countries and industries had higher valuations. By 2016, the negative relationship between interest rate sensitivity had solidified substantially. In the low interest rate environment of 2016, bond-like stocks have higher valuations, with the relationship being stronger when various controls are included.
Finally, the indicator for inclusion in MSCI’s World Minimum Volatility index (1i∈M) is positive and significant in both 2008 and 2016, with and without controls. Without controls for countries and industries, the magnitude of this premium roughly doubles from 2008 to 2016. With controls for countries and industries, the magnitude of the MSCI premium increases by roughly 25%. In either case, the inclusion premium that existed at the index’s inception has only gotten stronger. These patterns suggest that the countries and industries in which MSCI Minimum Volatility’s holdings are concentrated have become more expensive over the 2008-2016 period, controlling for other observables.
While this finding corroborates concern about the recent valuations of this MSCI index, it does not itself support broader and more extravagant claims regarding the valuations of all lower-risk and lower-beta stocks. In fact, results in Table 2 support the opposite conclusion. In 2016, the valuation premium appears to be on higher-beta stocks, except when controlling for industries and countries. With country and industry controls, the premium on beta disappears, consistent with higher-beta countries and industries having higher valuations in 2016.
Aside: Robustness
As the breakpoints in Table 1 imply, the distribution of P/Bs has a right skew. There also are a number of stocks that have zero or negative P/B ratios. So far we have addressed these problems by winsorizing the distribution at the 95% breakpoint, and by assigning zero and negative P/Bs to that 95% breakpoint (see header of Table 1). An alternative approach is simply to drop these extreme observations. Table A1 in the Appendix reports results analogous to Table 2, but excluding the stocks that receive these treatments.
The overall patterns in Table A1 are generally consistent with those in Table 2. In 2006, country and industry controls had no effect on the positive and significant loading of valuation on beta, while in 2008, the controls reduced but did not eliminate the premium. By 2016, there is no premium, and with controls for country and industry, the premium is reversed. This reversal is not present in Table 2. Thus, when the most highly valued companies are excluded, lower-beta stocks have higher valuations within countries and industries. The relationship is modest, roughly an increase of 0.02 P/B for every 0.10 reduction in beta. These patterns suggest that in 2016, the most extreme valuations are on higher-beta stocks.
Also in Table A1, elimination of the most highly valued companies reduces the estimated premium on stocks in MSCI’s World Minimum Volatility index in both 2008 and 2016. Moreover, when additional controls are added, the premium in 2016 vanishes. The positive and significant 2016 estimates in Table 2 evidently rely on the inclusion of the most highly valued companies, suggesting that constituents of MSCI’s index have high valuations indeed. (Table A3 in the Appendix lists the top 30 most expensive constituents of MSCI’s World Minimum Volatility index and their P/Bs as of January 31, 2016.)
Figure 1
Industry Valuation Ranges
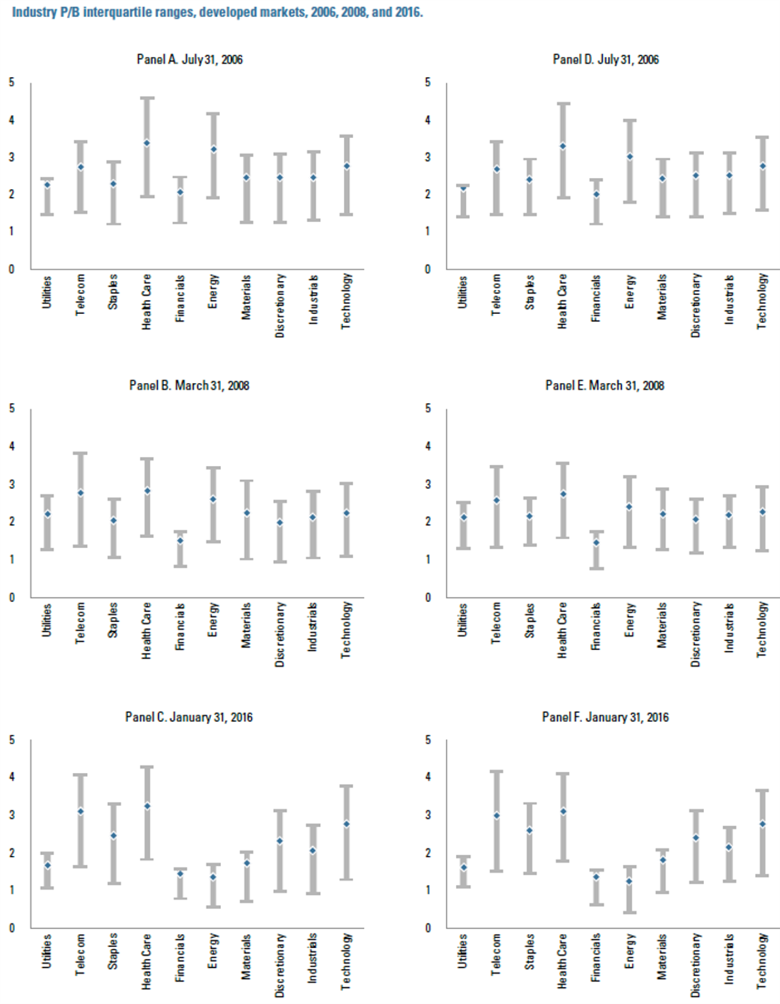
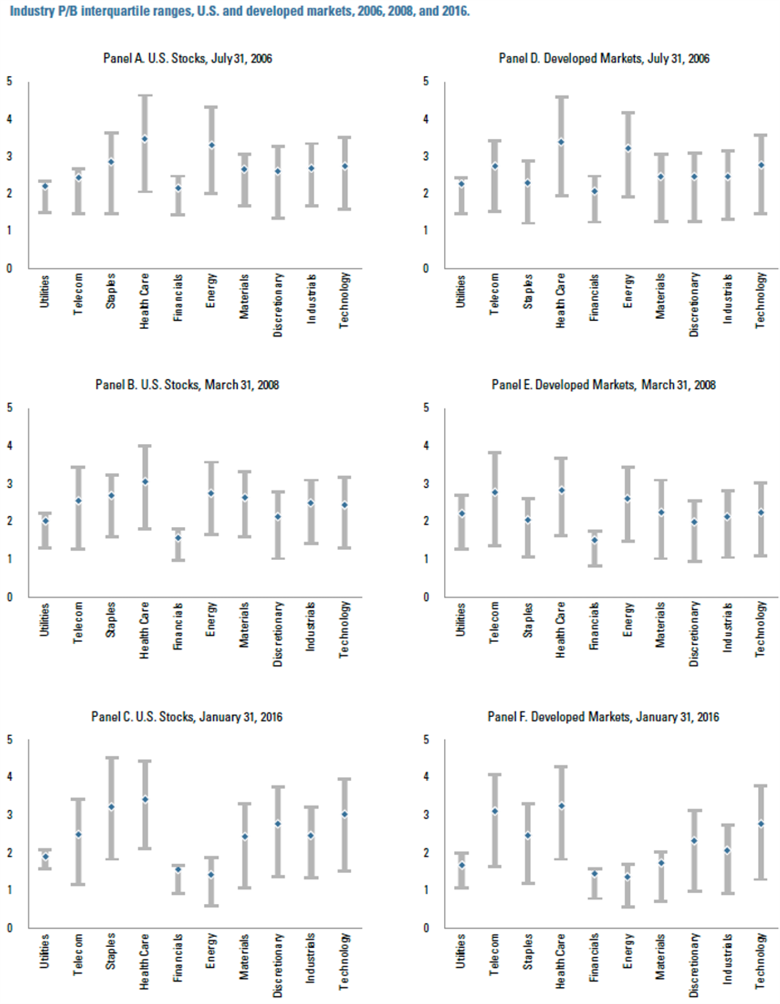
Figure 1 presents means and inter-quartile ranges for sector valuations, on each of the three observation dates. (Methodology is explained in Table A2 in the Appendix, and excludes stocks in the highest 5% of the valuation range.) Sectors are ordered from lowest to highest according to their average equity market betas. Among lower-beta sectors, from 2006 (Panel A) to 2008 (Panel B), valuation ranges in utilities (first bar) and telcos (second bar) widened. However, from 2008 to 2016 (Panel C), the range of valuations in utilities compressed while the range within telcos was stable. Average valuations in utilities fell from 2008 to 2016, while average valuations in telcos rose modestly.3 The average and range of valuations with staples was relatively stable from 2006 to 2008, but after 2008 the range widened dramatically, and the mean also rose. Healthcare has a lower valuation mean and range in 2016 than it did in 2006; this range was tighter and lower at the interim date 2008.
Among higher-beta sectors, technology has a modestly wider range of valuations in 2016 than in did in 2006, and both ranges were wider and higher than in 2008. Industrials have had a fairly stable valuation range over the decade, while consumer discretionary’s valuation range has expanded.
These changes are all subtle compared to those affecting middle-beta sectors, where falling energy and commodity prices have reduced the level and range of valuations in energy and materials sectors dramatically. Contemporaneously, the range of valuations within finance also has tightened materially.
For completeness, Panels D, E, and F of Figure 1 present means and inter-quartile ranges, controlling for countries. Variation in the valuations of countries accounts for some of the variation of valuations within sectors, so the ranges in Panels D-F are modestly tighter than the corresponding ranges in Panels A-C, but the general patterns are unchanged. Also for completeness, Table A4 and Figure A1 in the Appendix report valuation ranges using U.S. stocks only. In U.S. data, there is evidence of a multiple expansion in staples that is stronger than the general pattern across all developed markets.
The patterns in Figure 1 suggest that valuation ranges, and thus opportunity to pick lower- (or higher-) valuation stocks has increased modestly over the decade in both lower- and higher-beta sectors. This pattern contrasts with the pattern in financials and commodity-driven sectors, where valuation ranges lowered and tightened over the same decade.
Conclusion
We conclude by emphasizing the three important results noted above. First, there is a range of valuations within lower-beta and higher-beta stocks. Second, apart from patterns that are attributable to countries and industries, at present there is little to no valuation premium on lower-beta stocks, though stocks with low (bond-like) interest rate sensitivity do have higher valuations. Finally, some of the most dramatic valuations are associated with constituents of MSCI’s Minimum Volatility index, and this index tends to hold stocks in countries and industries with higher valuations.
References
Baker, Malcolm, Brendan Bradley, and Jeffrey Wurgler, “Benchmarks as Limits to Arbitrage: Understanding the Low Volatility Anomaly, ” Financial Analysts Journal 67, no. 1 (2011): 40-54.
Appendix
Table AI
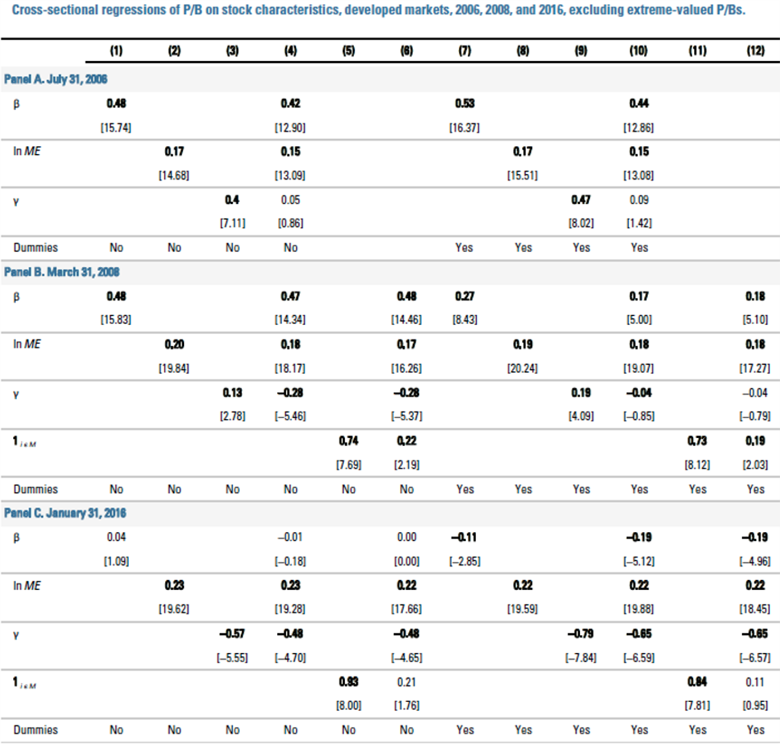
Table A2
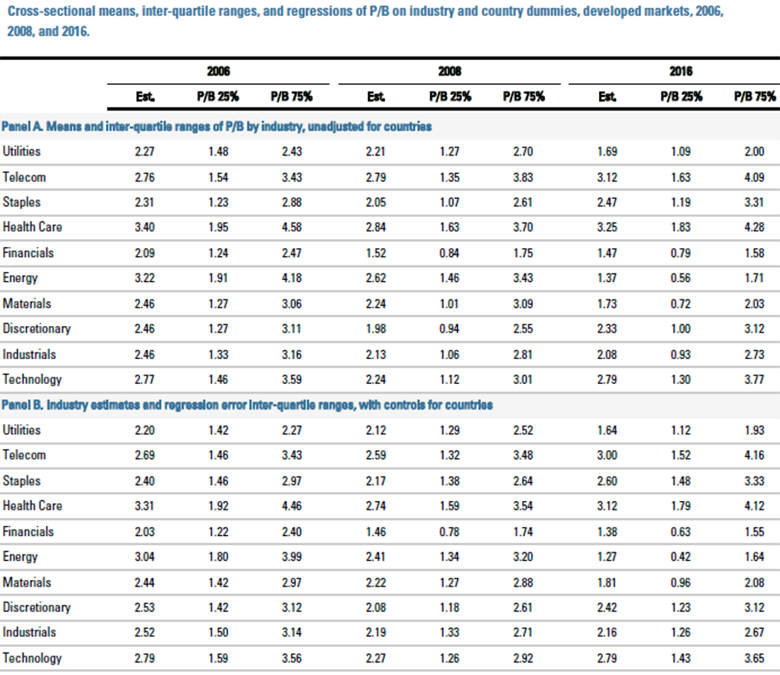
Table A3
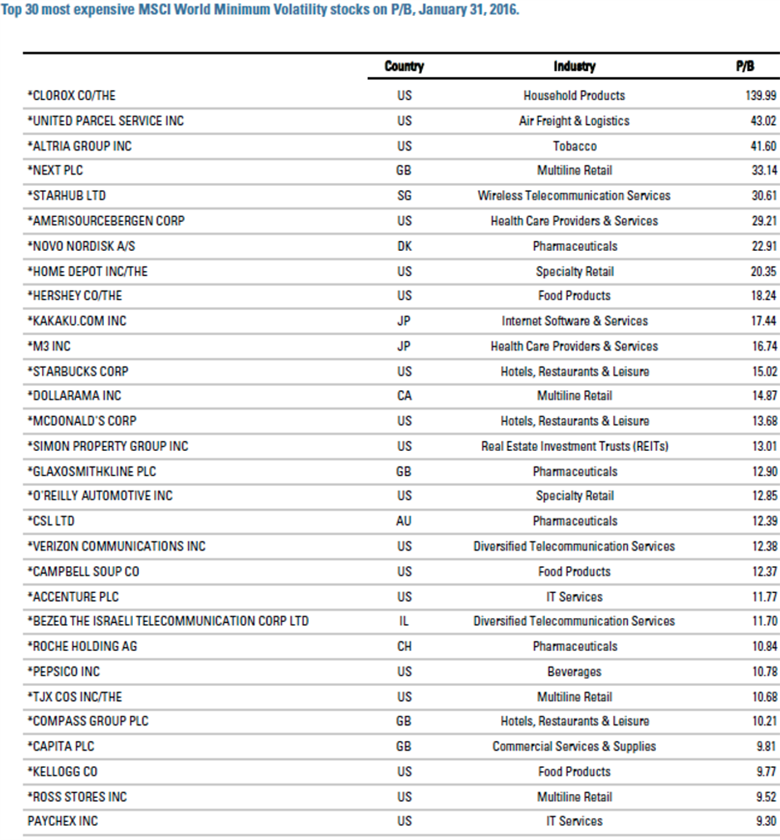
Table A4
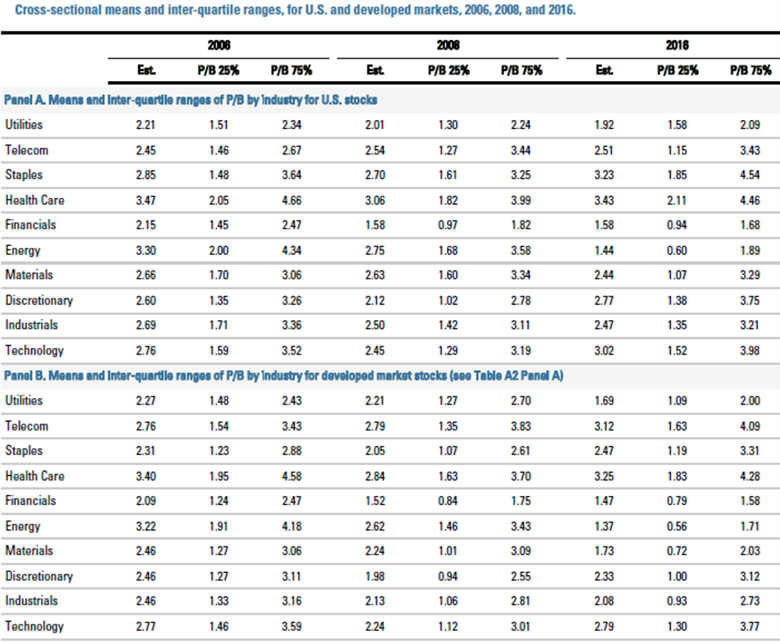
Figure A1
Endnotes
- Estimation uses daily returns and a rolling four-year lookback period.
- Estimation regresses weekly stock returns on contemporaneous changes in a nine-country GDP-weighted average of ten-year government bond yields, using a rolling three-year lookback period.
- This empirical pattern runs contrary to the increase in valuations in 2016 of more bond-like stocks (see Tables 2 and A1). Indeed, with utilities removed from the 2016 sample, the increase in valuations of bond-like stocks is even stronger. The fall in valuations among global utilities partially offsets the increase in valuations of other bond-like stocks.
Legal Disclaimer
These materials provided herein may contain material, non-public information within the meaning of the United States Federal Securities Laws with respect to Acadian Asset Management LLC, Acadian Asset Management Inc. and/or their respective subsidiaries and affiliated entities. The recipient of these materials agrees that it will not use any confidential information that may be contained herein to execute or recommend transactions in securities. The recipient further acknowledges that it is aware that United States Federal and State securities laws prohibit any person or entity who has material, non-public information about a publicly-traded company from purchasing or selling securities of such company, or from communicating such information to any other person or entity under circumstances in which it is reasonably foreseeable that such person or entity is likely to sell or purchase such securities.
Acadian provides this material as a general overview of the firm, our processes and our investment capabilities. It has been provided for informational purposes only. It does not constitute or form part of any offer to issue or sell, or any solicitation of any offer to subscribe or to purchase, shares, units or other interests in investments that may be referred to herein and must not be construed as investment or financial product advice. Acadian has not considered any reader's financial situation, objective or needs in providing the relevant information.
The value of investments may fall as well as rise and you may not get back your original investment. Past performance is not necessarily a guide to future performance or returns. Acadian has taken all reasonable care to ensure that the information contained in this material is accurate at the time of its distribution, no representation or warranty, express or implied, is made as to the accuracy, reliability or completeness of such information.
This material contains privileged and confidential information and is intended only for the recipient/s. Any distribution, reproduction or other use of this presentation by recipients is strictly prohibited. If you are not the intended recipient and this presentation has been sent or passed on to you in error, please contact us immediately. Confidentiality and privilege are not lost by this presentation having been sent or passed on to you in error.
Acadian’s quantitative investment process is supported by extensive proprietary computer code. Acadian’s researchers, software developers, and IT teams follow a structured design, development, testing, change control, and review processes during the development of its systems and the implementation within our investment process. These controls and their effectiveness are subject to regular internal reviews, at least annual independent review by our SOC1 auditor. However, despite these extensive controls it is possible that errors may occur in coding and within the investment process, as is the case with any complex software or data-driven model, and no guarantee or warranty can be provided that any quantitative investment model is completely free of errors. Any such errors could have a negative impact on investment results. We have in place control systems and processes which are intended to identify in a timely manner any such errors which would have a material impact on the investment process.
Acadian Asset Management LLC has wholly owned affiliates located in London, Singapore, and Sydney. Pursuant to the terms of service level agreements with each affiliate, employees of Acadian Asset Management LLC may provide certain services on behalf of each affiliate and employees of each affiliate may provide certain administrative services, including marketing and client service, on behalf of Acadian Asset Management LLC.
Acadian Asset Management LLC is registered as an investment adviser with the U.S. Securities and Exchange Commission. Registration of an investment adviser does not imply any level of skill or training.
Acadian Asset Management (Singapore) Pte Ltd, (Registration Number: 199902125D) is licensed by the Monetary Authority of Singapore. It is also registered as an investment adviser with the U.S. Securities and Exchange Commission.
Acadian Asset Management (Australia) Limited (ABN 41 114 200 127) is the holder of Australian financial services license number 291872 ("AFSL"). It is also registered as an investment adviser with the U.S. Securities and Exchange Commission. Under the terms of its AFSL, Acadian Asset Management (Australia) Limited is limited to providing the financial services under its license to wholesale clients only. This marketing material is not to be provided to retail clients.
Acadian Asset Management (UK) Limited is authorized and regulated by the Financial Conduct Authority ('the FCA') and is a limited liability company incorporated in England and Wales with company number 05644066. Acadian Asset Management (UK) Limited will only make this material available to Professional Clients and Eligible Counterparties as defined by the FCA under the Markets in Financial Instruments Directive, or to Qualified Investors in Switzerland as defined in the Collective Investment Schemes Act, as applicable.