
Smart Beta: Constrained Quantitative Active Management
Table of contents
January 2015
Recently, there has been a proliferation of investment products marketed as “smart beta.” Their evaluation has been hindered by lack of consensus as to what kinds of investment strategies fall under the smart-beta umbrella. Common product features, including intuitive investment theses tied to well known returns “anomalies,” rules-based portfolio composition, and mechanical implementation, point to one of smart beta’s defining properties: it is a constrained form of quantitative active management.
Identification of mispriced factors has been a focus of quantitative active management for decades; it is hardly a new approach or one that is unique to smart beta.
Commonalities among smart-beta product attributes reflect investment process restrictions born out of business models focused on creating products with mass distribution potential. That emphasis on scalability puts a premium on qualities like simplicity of investment thesis, process transparency, and holdings’ liquidity. While such product characteristics have superficial appeal, they are often accompanied by costs and risks, including lost alpha, unintended exposures, and implementation drag, that may be difficult for investors to recognize, let alone assess.
In this white paper, we contextualize smart beta as a form of single-factor investing, a subset of quantitative active management, and we contrast it with a multi-factor approach. We describe the quantitative active investment process, and we discuss costs and risks of common restrictions of the process that are implicit in many smart-beta offerings.
Smart Beta: Single-Factor Investing
Smart beta represents a form of what is known as factor investing, which has been a focus of quantitative active management for decades. These strategies provide exposure to a stock characteristic, perhaps a fundamental valuation or technical metric, that the purveyor asserts is associated with a mispricing of risk by the market.
Smart beta tends to focus on factors that find strong empirical support and intuitive justification in the academic finance literature. Many of the explanations are rooted in a combination of behavioral and structural arguments: 1) a mispricing arises because investors have mistaken beliefs, incomplete information, or non-rational preferences, and 2) the mispricing persists because there are limits or costs to arbitrage that prevent it from being bid away. Identification of mispriced factors has been a focus of quantitative active management for decades; it is hardly a new approach or one that is unique to smart beta.
Most smart-beta strategies are based on single factors. That is, they seek to capture a returns premium associated with one particular mispricing, say, quality. In contrast, quantitative active managers generally employ multi-factor approaches, simultaneously seeking to tap into several sources of alpha. While a single-factor approach may be profitable and appropriate for certain investment contexts, we believe that multi-factor approaches are, in general, more likely to offer superior investment outcomes.
Common Factors in Smart-Beta Offerings

Advantages of Multi-factor Approach
Single-factor strategies have appeal in that they are simpler than multi-factor. They would also seem to offer end users considerable flexibility to engineer multi-factor exposures by composing portfolios of single-factor products. But doing so is wasteful in terms of alpha and is capital inefficient. Blending single-factor products cannot provide full flexibility to manage factor interactions at the stock level.
Interactions between quality and value characteristics demonstrate the problem and its implications. Intuitively, an investor seeking exposure to both value and quality would naturally be inclined to omit expensive quality stocks and junky value stocks from the portfolio. But that would not be possible if the investor were limited to allocating across a smart-beta value product (formed without regard to quality) and a smart-beta quality product (formed without regard to value), and we would expect performance to suffer as a result.
Smart beta is not a form of passive investing. It explicitly rejects cap-weighted broad-market indexing. We view the decision as to how to diverge, even if via a rules-based, transparent strategy, as an active call.
Novy-Marx (2013) provides empirical evidence that this is, in fact, the reality that investors face.1 He shows that some definitions of quality tilt towards expensive and large cap stocks. While he provides evidence that quality signals are informative, portfolios formed solely on the basis of certain quality formulations do not generate market-adjusted excess returns due to headwinds from unintended (negative) value and market cap exposures. A 50/50 blend of quality and value portfolios produces a Sharpe ratio lower than that of a pure value portfolio. It is only in selecting a portfolio of stocks that exhibit both quality and value characteristics, that Novy-Marx generated performance exceeding that of value alone.
Profitably exploiting the incremental informational content of quality, would seem to require stock-level management of factor interrelationships. Expressed differently, incidental exposures arising from a single-factor approach can be avoided in a multi-factor context that targets the most profitable interaction of several attractive attributes. 1
Comparing Investment Process: Passive, Smart Beta, and Quantitative Active
Smart beta is not a form of passive investing. It explicitly rejects cap-weighted broad-market indexing. We view the decision as to how to diverge, even if via a rules-based, transparent strategy, as an active call. What is important about the shift from passive to active, with respect to this discussion, is that it transforms investment management from a theoretically guided activity requiring little skill into an empirical discipline. For a passive investor, there is only one significant decision – how much market exposure to take.2 Investment management, in this context, is straightforward, the domain of low-skill, low-fee passive index providers.
For quantitative active managers, in contrast, the identification of factors, analysis of their drivers, and validation of their efficacy is the focus of ongoing empirical research. Although behavioral finance and knowledge of market structure help to guide the search for excess returns, there is no theoretical framework that supplies anomalies or instructs how to construct signals that will best reflect them.3 As well, questions as to how to best form portfolios and execute strategies in the market are first order concerns.
To deal with these complex issues, quantitative managers have developed a methodical investment framework that we can describe in terms of three phases:
Alpha Modeling – identifying stock and firm characteristics that are associated with high risk-adjusted returns and understanding underlying causal relationships
Portfolio Construction – optimally composing a portfolio given the alpha model’s return forecasts, a model of risk, and estimates of implementation costs
Implementation – optimally trading a strategy in the market so as to precisely effect the intended position while minimizing costs and risk
While smart-beta products share the broad goal of identifying and systematically harvesting well-known returns premia, they, in general, employ investment processes that incorporate restricted versions of one or more phases of this framework. In other words, smart beta is constrained active quant. These restrictions have costs and risks, which we will illustrate with real-world examples.
Alpha Modeling
The institutional active manager’s job is to generate investment performance for clients. Quantitative active managers believe that consistent outperformance requires constant innovation, and clients expect that managers will refine their investment strategies on an ongoing basis. In contrast, many smart-beta products are motivated primarily by mass asset gathering and reflect vanilla implementations of well established anomalies in an effort to appeal to a broad potential customer base, both institutional and retail.
Momentum products offer an example of the difference in approaches. There are several available smart-beta implementations of momentum, one being MSCI’s Momentum Indexes. MSCI calculates each stock’s momentum based on a blend of 12-month and 6-month price appreciation. They exclude the most recent month, and normalize price appreciation by the stock’s historical volatility.4 This construction methodology resembles a momentum definition commonly found in the academic literature for control variables used in market efficiency tests and in manager performance assessment.5
Quantitative active managers believe that consistent outperformance requires constant innovation, and clients expect that they will refine their investment strategies on an ongoing basis.
We believe that it is possible to improve on such standard momentum constructions. For example, Acadian’s momentum signals incorporate a psychological phenomenon called the disposition effect, which is an empirical regularity reflecting investors’ predisposition to hold losing stocks and to sell winners. As a stock declines below the prices at which investors bought it, their reluctance to realize paper losses artificially depresses net selling pressure. Similarly, investors tend to be too quick to sell when a stock’s price rises above their entry points, depressing net buying pressure. If the disposition effect holds, then aggregate capital gains relative to investors’ entry points should be a valuable conditioning variable for momentum signals. There is empirical evidence to support the hypothesis.6
In evaluating smart-beta strategies, we would caution investors to temper their expectations about vanilla specifications that perform well in backtests. Constructions that gain credence in academia and find widespread practitioner uptake may experience performance degradation as assets managed to them grow. Proprietary strategy refinements and construction methods may preserve factor efficacy. Evidence of excess return in a backtest is insufficient justification to put capital at risk in an active strategy. A thoughtful and skilled asset manager will seek to understand why a mispricing exists so as to have confidence in the attribute’s enduring outperformance and to design a precise signal.
Portfolio Construction
Portfolio construction is a crucial and complex phase of quantitative active management. In this stage, managers combine return forecasts with models of risk and estimates of trading costs to determine optimal portfolio weights. Typically, risk forecasts model interactions between a host of common factors such as industry affiliation, region, and fundamental attributes, as well as idiosyncratic volatility uncorrelated with other sources of risk. Often, managers incorporate clientspecific risk tolerances into the portfolio optimization process, for example, as explicit limits to risk factor exposures. Transaction cost estimates typically reflect market impact models and risk associated with implementation delays.
Many smart-beta implementations, in contrast, structure portfolios based on rudimentary weighting schemes. As an example, fundamental indexers weight stocks by the value of accounting variables (e.g., earnings, sales, book value, etc.) to tilt the portfolio towards value stocks that may deliver higher risk-adjusted returns.
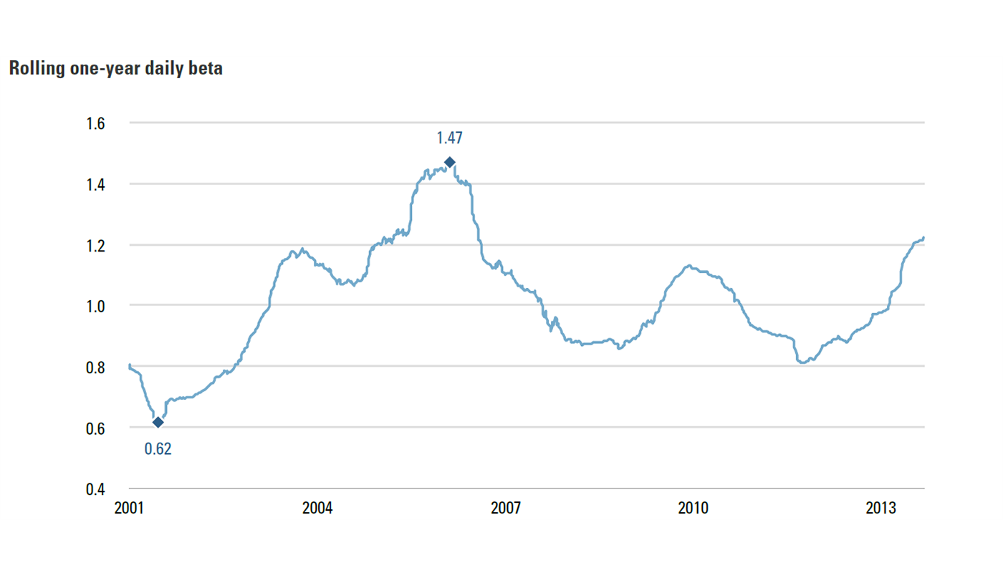
Simplistic portfolio construction methods may appeal in their transparency, but they also have drawbacks, one being that they may generate unintended risk exposures. For example, the simplest momentum definitions, based on raw price appreciation, have a tendency to acquire high betas when the market rallies, because the best-performing stocks are likely to be those with the greatest market gearing. Even the beta of MSCI’s U.S. Momentum Index, with its normalization for total volatility, has varied considerably, between roughly 0.6 and 1.4 since 2001.
Figure 1: Beta of MSCI U.S. Momentum Index vs. MSCI U.S. Index
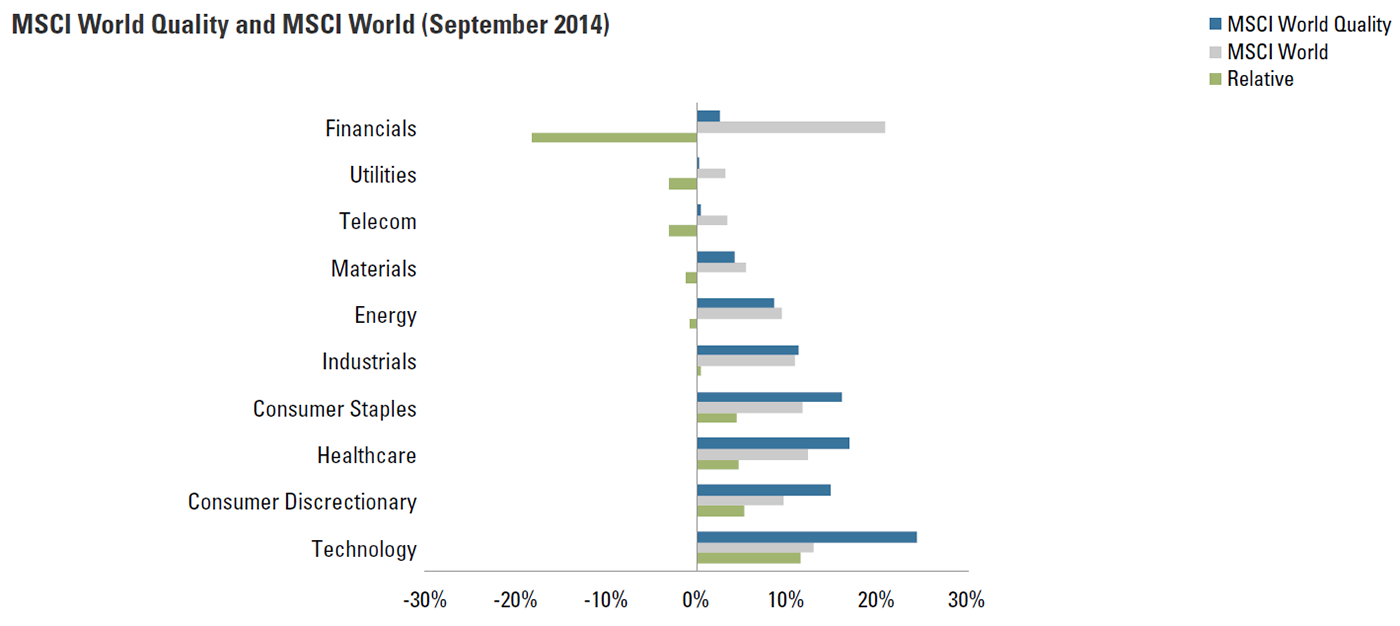
Simple construction methods may also create concentrations of risk in regions, industries, or other clusters of stocks. Figure 2 shows, for example, that the MSCI World Quality Index was more than 10% overweight IT, materially overweight consumer staples, consumer discretionary, and healthcare, and more than 15% underweight financials as of September 2014. Overly simplistic portfolio construction is not only risky, but wasteful. In many cases, diversifying away or otherwise limiting unwanted exposures is achievable at low cost in terms of desired factor exposures. For example, our empirical work suggests that the concentrated active industry exposures of the quality product noted above is avoidable, because quality is not inextricably intertwined with industry membership.
Implementation
To maintain transparency, many smart-beta indexes govern rebalancing according to mechanical rules and rigid schedules. Such practices are prone to execution risk as assets under management grow and particularly when implementation considerations are not explicitly incorporated into portfolio construction. The combination of mechanical rebalancing and implementation-unaware portfolio construction, both typical of smart beta, can lead to sudden large shifts in portfolio composition. Fundamental indexing offers a case in point.
Figure 2: Sector Weights
FTSE’s RAFI indexes are rebalanced annually, on the third Friday of March after the close (effective Monday).7 For RAFI 1000 Indexes, both U.S. and Developed Ex-U.S., the annual rebalance has generated average turnover in excess of 16%, multiples of what has been experienced by cap-weighted cousins.8 As another example, on November 27, 2013, the semi-annually rebalanced MSCI ACW Momentum index saw North America’s weight spike from 39% to 64%.9
When substantial assets are managed to an index, material reweightings may reduce returns if buying and selling is large enough to generate market impact. What’s more, sophisticated traders are likely to front-run pre-publicized impending changes, as we have seen for years in the context of a wide range of indexes and mechanically rebalanced active products.
Frictions associated with rebalances are not inherent to the factor exposures sought by smart beta investors, and it is illogical to blindly accept drag that is an artifact of portfolio construction and implementation. Quantitative active managers limit implementation risk through a variety of measures. For example, their trading programs generally are not public knowledge, and explicitly incorporating turnover considerations into the portfolio construction process helps to avoid sudden large changes in composition.
To facilitate scalability, many smart-beta products limit their investment universe to highly liquid stocks. Such a crude filter may head off some implementation frictions, but at a cost in terms of alpha degradation. Behavioral finance suggests that alpha and liquidity are coupled, because the size and persistence of a mispricing will be related to costs and limits on arbitrageurs’ ability to bid it away. Consistent with that intuition, historical returns associated with many well known asset-pricing anomalies indeed have been larger in less liquid stocks. For example, viewing size as a simple liquidity proxy, research suggests returns from value have been on the order of four to five times greater in small-cap stocks than in large caps.10 i
We would expect factor investing approaches that restrict themselves to the most liquid stocks to deliver the full risk but only a fraction of the alpha that is available in the full liquidity spectrum. Because of self-imposed liquidity constraints, this alpha is unavailable to strategies designed to mimic an index or for mass-market scale. In contrast, quantitative active managers devote considerable research to interactions between liquidity and alpha, transaction cost modeling, and execution analysis so that they can capture mispricings that “bulk beta” implementations would exclude from the opportunity set.
Conclusion
Smart-beta approaches fall somewhere between quantitative active approaches and cap-weighted broad market index replication. The simplicity that smart-beta purveyors tout as a key benefit of their singularly focused strategies can actually be viewed as restrictions on one or more phases of the quantitative active process: alpha modeling, portfolio construction, and implementation. Naive smart-beta strategies come at the cost of lost alpha, unintended exposures, and implementation frictions. Mitigating these risks would call for releasing investment process constraints, in effect, incrementally reinventing an unfettered quantitative active approach—such as the one that Acadian has been cultivating for over 25 years. We would not be surprised to see some smart-beta purveyors migrate in that direction. While smart-beta products may offer utility in specific situations, for example, to plug an exposure gap, in a transition, or as a strategy benchmark, we believe that quantitative active managers are well suited to provide more refined and better performing single-factor implementations. And in most investing contexts, we advocate the multi-factor quantitative active approach, because it provides a more efficient means to harvest alpha, fully leveraging potentially profitable factor interactions. Focusing on investment process can help to clarify evaluation of investment alternatives, smart beta, quantitative active, and otherwise. A commoditized investment product, with a static implementation requiring little sophistication to develop, should feature a low-priced and unremarkable performance potential. We believe managers that maintain a refined investment process and constantly innovate should produce better performance. Investors should not focus solely on upfront cost, but rather on net-of-fee performance. Often, you really do get what you pay for.
Endnotes
- Robert Novy-Marx, “Quality Investing”, Working Paper, 2013.
- Cap-weighted indexing has a theoretical foundation in the Capital Asset Pricing Model (CAPM). In a CAPM world, the only risk investors are paid for is beta to the market, and the only risky asset that they hold is the market portfolio.
- Green, Hand, and Zhang (2013) identify over 300 returns predictive signals described in the academic literature between 1970 and 2010. (Green, J., J. R. M. Hand and X. F. Zhang (2013), “The Supraview of Return Predictive Signals”, Review of Accounting Studies, Vol. 18, No. 3, pp. 692–730.)
- Source: MSCI Momentum Indexes Methodology, December 2013.
- E.g., Carhart (1997).
- E.g., Grinblatt and Han (2005)
- Source: Ground Rules for the FTSE RAFI Index Series, Version 2.5, November 2014.
- Inception through March 2013. Source: Ari Polychronopoulos, The FTSE RAFI® Index Series, Research Affiliates, September 2013.
- MSCI Momentum Indexes are rebalanced semi-annually, as of the close on the last day of May and November, with pro forma changes announced nine business days before the effective date. MSCI’s methodology also allows for ad hoc rebalances during periods of high volatility. Source: MSCI Momentum Indexes Methodology, December 2013.
- Source: Created using data from Kenneth French and CRSP. CRSP®, Center for Research in Security Prices. Graduate School of Business, The University of Chicago. Used with permission. All rights reserved. Crsp.uchicago.edu For illustrative purposes only. This is not intended to represent investment returns generated by an actual portfolio. They do not represent actual trading or an actual account. Results do not reflect transaction costs, other implementation costs or their potential impact. Historical returns used to create this example are not indicative of future results. Every investment program has the opportunity for loss as well as profit. See Endnote i for research methodology
i Ratio of average monthly returns of highest quintile B/M stocks - lowest quintile B/M stocks in smallest quintile market capitalization vs. highest quintile market capitalization from Jan, 1968 through Nov, 2014 is 0.96% / 0.18% = 5.25 for value-weighted portfolios (0.97% / 0.24% = 4.09 equally-weighted). Returns do not account for transaction or borrow costs, and do not represent a tradable strategy. B/M and market capitalization sorted portfolio returns are sourced from Prof. Kenneth French’s data library at Dartmouth. The B/M and size sorts are conducted independently, and 25 portfolios of varying B/M and size characteristics are formed based on their intersection. B/M breakpoints are based on NYSE quintiles, but the portfolios include NYSE, AMEX, and NASDAQ stocks.
Legal Disclaimer
These materials provided herein may contain material, non-public information within the meaning of the United States Federal Securities Laws with respect to Acadian Asset Management LLC, Acadian Asset Management Inc. and/or their respective subsidiaries and affiliated entities. The recipient of these materials agrees that it will not use any confidential information that may be contained herein to execute or recommend transactions in securities. The recipient further acknowledges that it is aware that United States Federal and State securities laws prohibit any person or entity who has material, non-public information about a publicly-traded company from purchasing or selling securities of such company, or from communicating such information to any other person or entity under circumstances in which it is reasonably foreseeable that such person or entity is likely to sell or purchase such securities.
Acadian provides this material as a general overview of the firm, our processes and our investment capabilities. It has been provided for informational purposes only. It does not constitute or form part of any offer to issue or sell, or any solicitation of any offer to subscribe or to purchase, shares, units or other interests in investments that may be referred to herein and must not be construed as investment or financial product advice. Acadian has not considered any reader's financial situation, objective or needs in providing the relevant information.
The value of investments may fall as well as rise and you may not get back your original investment. Past performance is not necessarily a guide to future performance or returns. Acadian has taken all reasonable care to ensure that the information contained in this material is accurate at the time of its distribution, no representation or warranty, express or implied, is made as to the accuracy, reliability or completeness of such information.
This material contains privileged and confidential information and is intended only for the recipient/s. Any distribution, reproduction or other use of this presentation by recipients is strictly prohibited. If you are not the intended recipient and this presentation has been sent or passed on to you in error, please contact us immediately. Confidentiality and privilege are not lost by this presentation having been sent or passed on to you in error.
Acadian’s quantitative investment process is supported by extensive proprietary computer code. Acadian’s researchers, software developers, and IT teams follow a structured design, development, testing, change control, and review processes during the development of its systems and the implementation within our investment process. These controls and their effectiveness are subject to regular internal reviews, at least annual independent review by our SOC1 auditor. However, despite these extensive controls it is possible that errors may occur in coding and within the investment process, as is the case with any complex software or data-driven model, and no guarantee or warranty can be provided that any quantitative investment model is completely free of errors. Any such errors could have a negative impact on investment results. We have in place control systems and processes which are intended to identify in a timely manner any such errors which would have a material impact on the investment process.
Acadian Asset Management LLC has wholly owned affiliates located in London, Singapore, and Sydney. Pursuant to the terms of service level agreements with each affiliate, employees of Acadian Asset Management LLC may provide certain services on behalf of each affiliate and employees of each affiliate may provide certain administrative services, including marketing and client service, on behalf of Acadian Asset Management LLC.
Acadian Asset Management LLC is registered as an investment adviser with the U.S. Securities and Exchange Commission. Registration of an investment adviser does not imply any level of skill or training.
Acadian Asset Management (Singapore) Pte Ltd, (Registration Number: 199902125D) is licensed by the Monetary Authority of Singapore. It is also registered as an investment adviser with the U.S. Securities and Exchange Commission.
Acadian Asset Management (Australia) Limited (ABN 41 114 200 127) is the holder of Australian financial services license number 291872 ("AFSL"). It is also registered as an investment adviser with the U.S. Securities and Exchange Commission. Under the terms of its AFSL, Acadian Asset Management (Australia) Limited is limited to providing the financial services under its license to wholesale clients only. This marketing material is not to be provided to retail clients.
Acadian Asset Management (UK) Limited is authorized and regulated by the Financial Conduct Authority ('the FCA') and is a limited liability company incorporated in England and Wales with company number 05644066. Acadian Asset Management (UK) Limited will only make this material available to Professional Clients and Eligible Counterparties as defined by the FCA under the Markets in Financial Instruments Directive, or to Qualified Investors in Switzerland as defined in the Collective Investment Schemes Act, as applicable.