
Factor Investing: Is Keeping It Simple Shortsighted?
Key Takeaways
- Through a momentum case study, we demonstrate that commoditized factor implementations forgo benefits of sophistication in investment intuition and factor construction.
- We discuss potential pitfalls associated with benchmarking sophisticated factor investing strategies to commoditized implementations.
- We highlight unintuitive complications that may arise in trying to purge commoditized factors from sophisticated systematic strategies.
16 min
Table of contents
Introduction
The rapid proliferation of systematic equity investing strategies has raised the profile and increased the accessibility of factor investing concepts that Acadian has been applying for more than three decades. But the plethora of available approaches raises important questions for investors. Are different implementations fungible, implying that fees alone should matter in selection? Do the most straightforward approaches deliver full value? Can proprietary refinements materially improve performance?
This note explores these questions, focusing on the restrictive systematic approaches sometimes labeled Alternative Risk Premia (ARP) or Smart Beta. The ARP marketing pitch hinges on a belief that transparent, formulaic, liquid, and cheap strategies can reliably capture the full benefits of investing in well-known factors, such as value, momentum, quality, and low risk. Using momentum as a case study, we argue that this notion is demonstrably false.
Our analysis demonstrates that ARP’s “simple and transparent” approach, self-imposed by a mass-market business model, comes at non-trivial cost. Commoditized factors forgo benefits of sophistication in both the underlying investment intuition and factor construction. In particular, we show that failure to control for undesired exposures may make ARP implementations vulnerable to drawdowns that would trigger involuntary unwinds.
We close with words of caution regarding the emergent practice of benchmarking sophisticated systematic strategies to commoditized formulations. We believe that the concept is being applied in contexts where it isn’t appropriate, and we demonstrate potential concerns through the momentum case study. Further, we argue that it would be generally inadvisable to mechanically adjust sophisticated implementations to try to isolate the value added above and beyond prospective commoditized factor benchmarks.
Figure 1
Momentum As A Case Study
We focus our analysis on momentum as a representative case study, but the discussion applies equally to other factors. There are a variety of explanations for momentum as a predictive factor. Prices may initially underreact to news because information diffuses slowly or as a result of psychological biases among investors, including a tendency to sell winners too quickly and hold losers for too long.1 Prices may eventually overreact to consistent streams of positive or negative information as a result of investor overextrapolation of fundamental trends, forecasting overconfidence, or herding.2
Many investment strategies generate returns from exposure to momentum. Discretionary equity long-short strategies tend to load up on it, often unwittingly, by investing in past, high beta, winners. Many systematic strategies, of course, employ momentum in their predictive return models.
For an investor seeking momentum exposure, whether to enhance performance or balance out other factor exposures in a portfolio, a first question is whether there is a single, “true” version of a momentum signal that best captures the effects. If not, then do different flavors of momentum signals reflect one generic behavioral phenomenon, making them largely interchangeable, or can nuanced instantiations of momentum focus more precisely on specific inefficiencies, leading to improved performance? As well, can more advanced momentum formulations minimize unintended exposures without materially eroding returns?
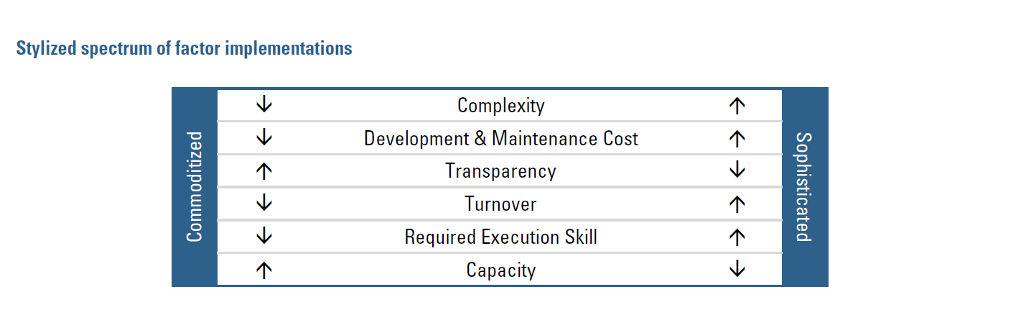
To bring structure to the discussion, Figure 1 highlights several key characteristics of factor implementations, including turnover, transparency, required execution skill, costs associated with development and maintenance of the signal, and capacity. In combination these characteristics define a spectrum, where one end represents simplistic approaches and the other highly sophisticated.
We compare three momentum implementations by way of this spectrum:
- Baseline Momentum: The most ubiquitous momentum proxy is simply a stock’s cumulative return between one year and one month ago. The most recent month is excluded to avoid short-term price reversion effects. This implementation belongs at the simpler end of the spectrum based on several attributes; it’s fairly easy to calculate, low cost to develop and maintain, and transparent. Baseline Momentum also generates lower turnover than some of the alternatives explored here, suggesting that it also may require less trading skill to execute and offer relatively high capacity.3
- Residual Momentum: A known problem with momentum signals derived from stocks’ total returns is that they incur unintended risks, including episodic exposures to market beta and other risk factors.4 As a result, such implementations may be prone to large return swings associated with inflection points in investor sentiment towards those secondary factors—likely an undesired side effect. Residual Momentum is constructed so as to reduce such time varying risk factor exposures.
This regression-based specification is more complex and less transparent than Baseline. Residual Momentum also requires material research effort, both up-front and ongoing, on the part of the manager to identify the relevant risk factors, devise a construction to limit them, and monitor exposures. As a result, it belongs on the more sophisticated end of the spectrum. - Peer Momentum: The first two momentum implementations are simultaneously limited and imprecise. The signals are myopic in that they focus narrowly on the past behavior of an individual stock’s returns. They are vague in that a given stock’s returns history may reflect muddled influences of several distinct aspects of sentiment. For example, it may confound sentiment towards the individual stock with sentiment toward relevant peer groups, and the two may behave very differently.
Peer Momentum, in contrast, attempts to infer more nuanced sentiment information by relating cross-asset momentum to individual stocks. Similar to Residual Momentum, we would expect Peer Momentum to be less susceptible to undesired exposures than commoditized momentum formulations, in part a natural result of its peer-group-aware construction.5
Peer Momentum appears at the high end of the sophistication spectrum. The peer identification process will likely be complex and opaque, and a manager needs to be well equipped to retain the intuition into the derived cross-asset groups. Peer Momentum also turns out to have higher turnover and, therefore, requires greater execution skill than the other factors, even at lower capacity. Peer Momentum’s novelty all but disqualifies it from broad uptake as a momentum ARP formulation, since established presence in academic literature, commonplace definition, and a liquid, transparent implementation tend to be marketing prerequisites.
Related But Not Fungible
To compare performance of the three momentum implementations, we construct hypothetical long-short factor portfolios from reasonably liquid stocks in developed markets ($100MM+ market capitalization, $0.5MM+ daily turnover). Figure 2 offers evidence that the factors are related; their returns are reasonably correlated, in a couple of cases, highly so. This is not unexpected, given the foundational similarities of the phenomena being captured.
But high correlation does not imply that the three momentum formulations are fungible “alpha” factors. Despite the correlated return streams, the implementations deliver markedly different investment outcomes, as is evident in Figures 3a and 3b.
Figure 2

Figure 3A
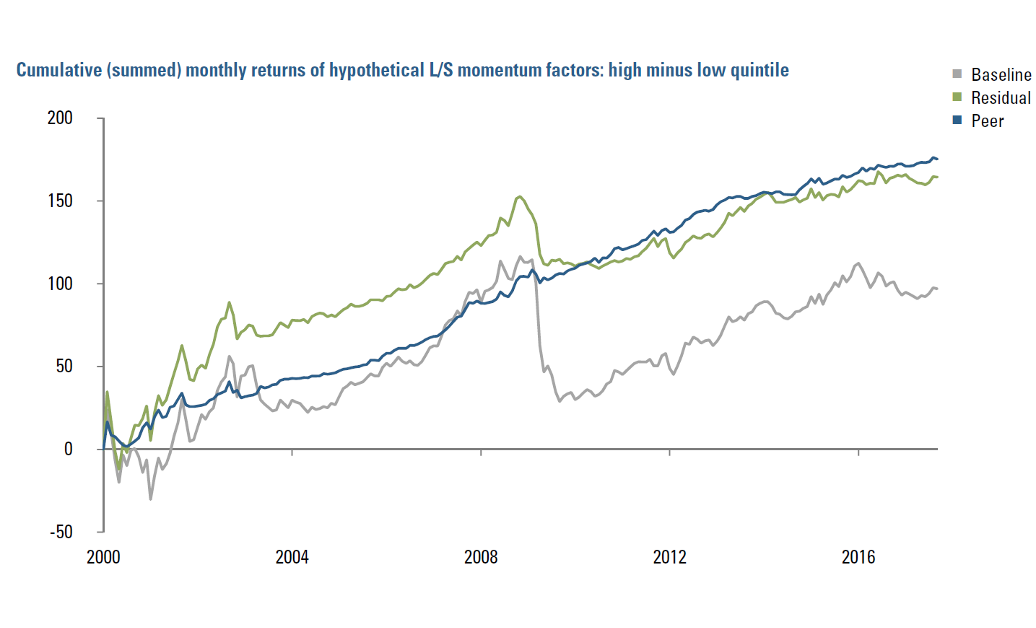
Figure 3B
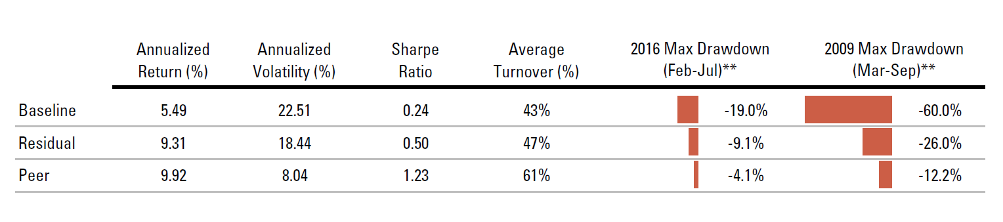
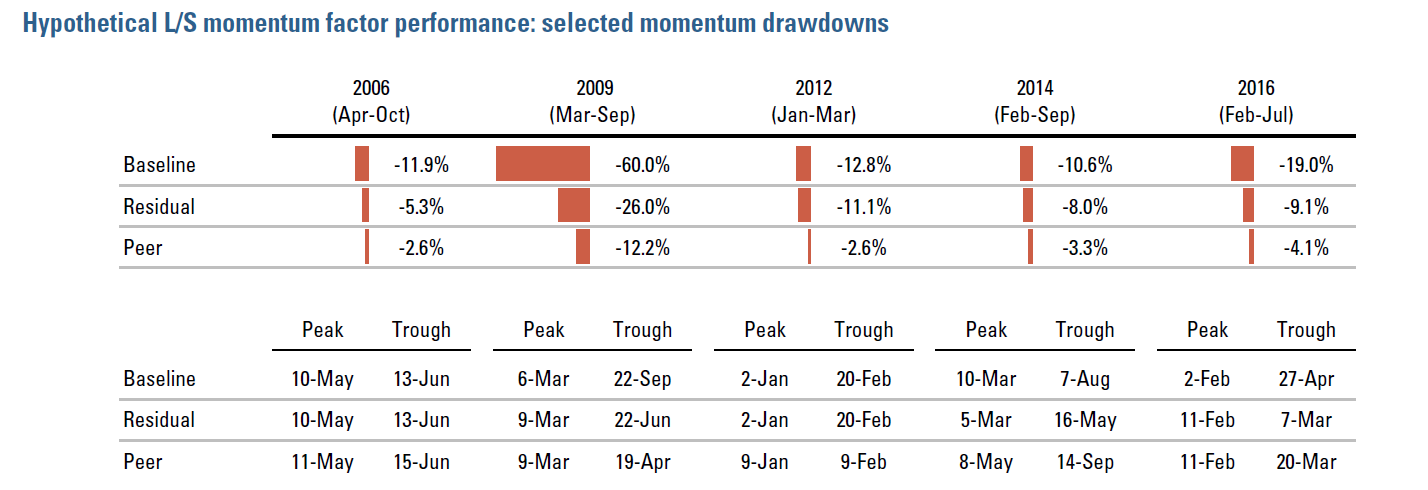
*Drawdowns approximated based on compounding daily equally-weighted returns of stocks held long minus stocks held short.
The appeal of even the simplest momentum implementation as an investment factor is evident in the hypothetical Baseline Momentum returns – averaging 5.49% (annualized). But there is also non-trivial risk. More striking than the 22.51% annualized volatility, the 60.0% drawdown in 2009 would likely have resulted in a margin call or a forced liquidation, perhaps preventing realization of the full period’s returns. In other words, the (hypothetical) historical performance may not have been realizable, a crucial point that is often overlooked in evaluating back-generated factor returns. Even if we were to discount the GFC as an aberration, unlikely to be repeated, the Baseline also performs poorly during the 2016 momentum drawdown from February through July, suffering a maximum loss of 19.0%. (The Appendix shows specific drawdown dates and compares factor performance in several recent momentum drawdowns.)
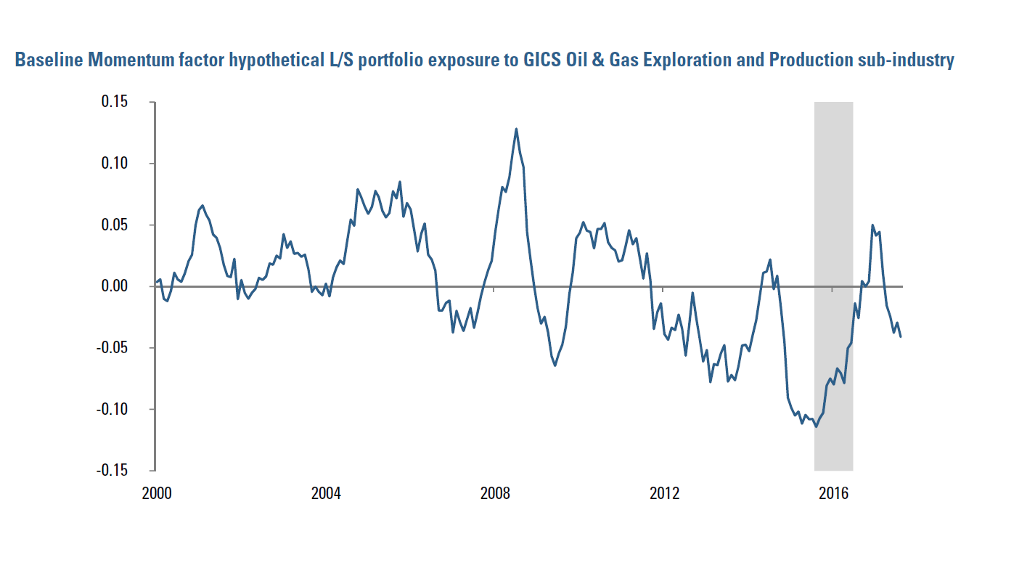
Looking more closely at the 2016 drawdown, we see evidence that failure to adequately control for at least two unintended risk exposures contributes to the poor performance of the Baseline Momentum implementation. First, with the decline in energy prices into 2015 and 2016, the short side of the hypothetical momentum portfolio becomes increasingly weighted in high-beta stocks (Figure 4). These stocks were declining the fastest (hence they became high beta), based on concerns about a global economic slowdown associated with softening energy prices. Second, the portfolio also develops materially negative exposure to Oil & Gas Exploration and Production. Both short positions are exposed during the subsequent relief rally, which results in a substantial portfolio drawdown.
Figure 4
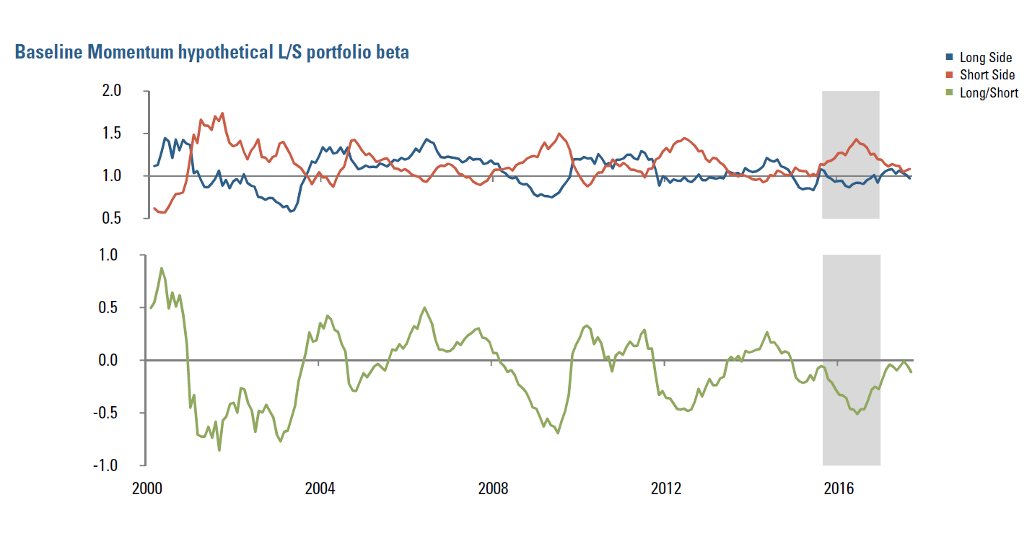
Figure 5
Can more sophisticated construction avoid such unintended exposures and thereby enhance performance? We believe so. Figure 3 shows that hypothetical Residual Momentum, which has been constructed to reduce time-varying exposure to the market and other risk factors, experiences a 2016 drawdown that is less than half that suffered by the Baseline formulation, -9.1% versus -19.0%. As well, Residual Momentum’s performance is far stronger during the 2009 drawdown, -26.0% versus -60.0%. Residual Momentum’s construction, which seeks to distinguish predictive sentiment patterns from time varying risk exposures, may benefit from limiting exposure to “incidental trades,” such as energy-related shorts in 2016. This may soften drawdowns associated with sudden reversals of sentiment around those themes and associated market squeezes.
Hypothetical Peer Momentum, the most nuanced and arguably robust implementation, in that it seeks to reduce incidental exposures and parse out more precise sentiment information from cross-asset return relationships, delivers the strongest performance. As Figure 3 shows, Peer Momentum has the highest annualized return, lowest volatility, and smallest drawdowns among the implementations. Peer Momentum’s Sharpe ratio of 1.23 is more than double that of the other factors. We see this as evidence that Peer Momentum’s more nuanced construction better captures patterns in information flows and investor behaviors that drive momentum performance and also avoids unintended exposures that leave commoditized formulations susceptible to sentiment reversals.
Overall, we see evidence that more sophisticated factors may offer material value. Returning to our initial three questions:
- Factor implementations are not necessarily fungible.
- Commoditized formulations are unlikely to deliver full value.
- Nuanced factor constructions may materially increase expected returns and reduce unintended risks.
Commoditized Factor Implementations As Benchmarks?
Even if sophisticated factors can deliver superior performance, might commoditized versions still offer value as benchmarks? We would advise caution. The emergent practice is not necessarily invalid but may involve at least two important pitfalls.
The drawdown behavior of the Baseline Momentum factor exposes the first vulnerability of the simple-factor-implementation-as-benchmark concept. As the case study suggests, commoditized factors may perform well over prolonged periods while along the way becoming crowded and prone to abrupt unwinds. Under “normal” market conditions, the relationship between a more sophisticated factor strategy and a proposed benchmark might seem intuitive, stable, and, importantly, substantial. In 2008, an investor evaluating a Peer Momentum strategy against Baseline Momentum on the basis of five years of historical data might not see value in choosing the more complex strategy. But in 2009 our hypothetical investor would have paid a dramatic cost for selecting the simpler version.
The point being that there is risk to choosing a simpler—and, almost by definition, more crowded—strategy based just on similarity of returns over an unrepresentative historical period (whether selected by chance or deliberately as part of the marketing pitch). This concern is particularly relevant in the current market context, given the historically low levels of volatility. And there is an important practical consideration attendant to this issue: if one is prepared to truly benchmark more complex implementations against simple versions, should we interpret the roughly 50% performance differential in 2009 as alpha? Would an investor be willing to pay a performance fee for that “added value?”
Based on our case study, we can demonstrate a second, subtler but equally important concern with the benchmarking concept that arises from over-interpretation of performance attribution analyses based on commoditized factors. As an example, we regress the returns from hypothetical Peer Momentum on returns from the commoditized hypothetical Baseline factor. The results, shown in Figure 6, indicate that Baseline Momentum accounts for about 29% of the variation in Peer’s returns, as reflected in the R2.
This result isn’t as informative as it is often described, in our experience. Specifically, it doesn’t tell us that Baseline generic factor explains roughly 30% of the more sophisticated factor’s overall performance. One factor’s ability to explain another’s variation tells us literally nothing about its ability to explain the average return.6
Figure 6
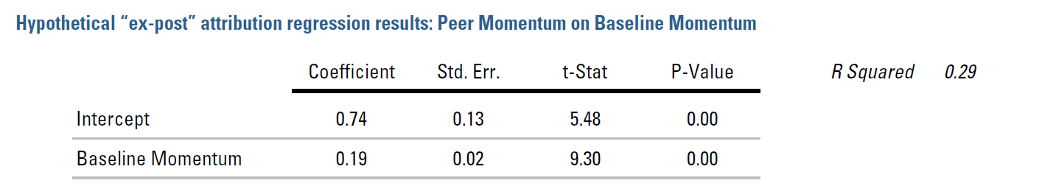
The regression intercept, i.e., an estimate of Peer’s alpha over and above Baseline, is 74bps versus Peer’s average monthly return of 83bps.7 This leaves only a modest 9bps explained by the commoditized formulation. However, combined with the perceived “high R2,” this benchmarking exercise may create temptation to engineer a “pure” strategy – Peer Momentum “purged” of the commoditized Baseline factor.
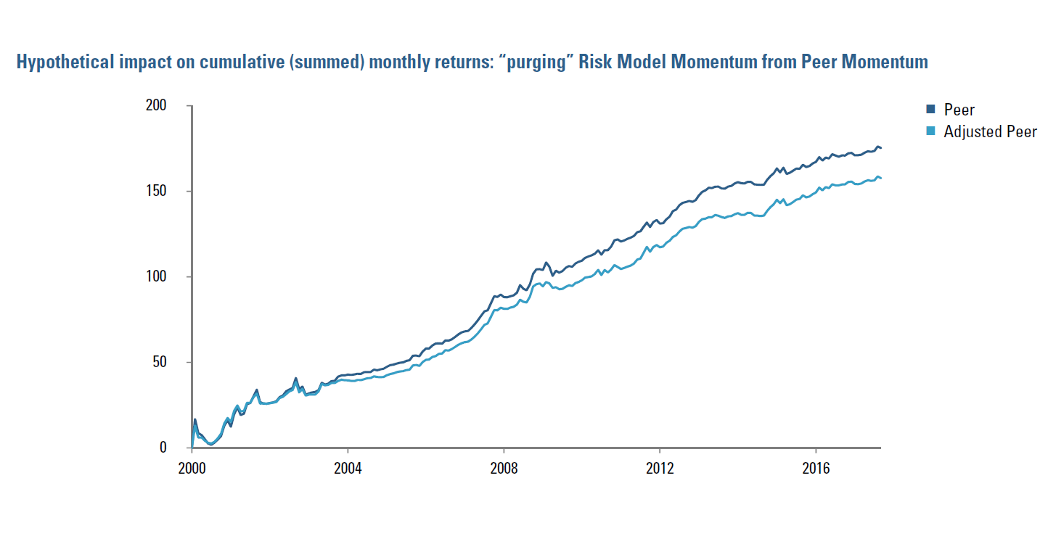
In general, we don’t think it would be prudent to do so. To demonstrate why, we consider one reasonable approach to adjusting Peer Momentum so as to purge it of Baseline’s influence. Specifically, on each reformation date, we form a modified Peer Momentum portfolio with approximately zero exposure to Baseline.8
While Figure 7 shows that the process results in a modest decrease in cumulative returns, as we might have guessed from the attribution results in Figure 6, it does not achieve a “Baseline-purified” version of Peer Momentum.9 The correlation between Adjusted Peer and Baseline ex-post returns is still 0.45, only modestly lower than the original Peer-Baseline correlation of 0.54 (shown in Figure 2).
Figure 7
What might we infer from this perhaps surprising persistence of correlation between the (ex-ante) “Baseline-free” version of Peer and Baseline? In general, we believe that purging a simple “core factor” from a more sophisticated one will be more difficult than ex-post attribution analysis suggests. Deeply rooted, shared investment intuition may still manifest ex-post, despite thoughtful attempts to excise it ex-ante. Differences in relevant fundamental, behavioral exposures may be highly non-linear and time-varying, and it may be difficult to correctly model the relationships between those exposures in order to cut the simple one out.
What’s more, trying to directly strip out a commoditized factor from a more sophisticated one may come at a cost that is far from trivial. At a minimum, there are costs in terms of complexity and reduced or obscured forecast intuition. Worse, the process might introduce into the portfolio exposures that are undesired and unknown, until they manifest themselves in performance, due to mis-modeling of the relationship between the simple and the complex factors.
In sum, we would caution against overinterpreting seemingly high R2s from ex-post attribution regressions involving sophisticated and simple versions of factors that share some common investment intuition. In fact, we would advise expecting R2s in the range of 30% for even the most sophisticated implementations and their commoditized counterparts. (Recall too that the R2 does not provide information regarding relative alphas.) We do not believe that it is prudent, in general, to attempt to create “purified” factors or multifactor strategies in response to such results. We would advise, however, more flexibly applying analysis of commoditized factors’ deficiencies to inform risk control and other aspects of factor and portfolio construction.
Conclusion
The analysis in this note demonstrates our belief that more sophisticated factor implementations offer good value, potentially delivering higher returns and less risk than commoditized versions. The defining characteristics of low-fee ARP strategies, including simplicity, transparency, unrestricted liquidity, and capacity, are made possible by imposing significant constraints on the investment process, and those restrictions have material trade-offs.
Over time, we expect that some ARP providers will gradually adopt more sophisticated approaches, revisiting lessons learned years ago by fully unconstrained systematic managers. This likely will entail a reduction in transparency and require greater research investment, risk management focus, and attentiveness in execution. Fees will likely increase as a result, and the meaning of terms like “ARP” and “smart beta” will further blur.
For investors trying to compare different factor investing approaches, we stress the need to focus on process. Understanding where a given approach falls within the spectrum of factor implementations discussed in this note is a valuable first step in framing expectations regarding return generation potential, hidden risks, and appropriate fees. Further, a deeper understanding of process will help to avoid inappropriate applications of commoditized factors as benchmarks and illuminate prudent ways to enhance sophisticated systematic strategies based on the deficiencies of simplistic versions.
Appendix: Drawdown Performance
Endnotes
- See, for example, Grinblatt, Mark and Bing Han (2005), “Prospect Theory, Mental Accounting, and Momentum,” Journal of Financial Economics, vol. 78, pp. 311-339; Odean, Terrence (1998), “Are Investors Reluctant to Realize their Losses?”, Journal of Finance, vol. 53, p. 1775-1798; Shapira, Zur, and Itzhak Venezia, 2001, “Patterns of Behavior of Professionally Managed and Independent Investors,” Journal of Banking and Finance, vol. 25, p. 1573- 1587; Shefrin, Hersh, and Meir Statman (1985), “The Disposition to Sell Winners too Early and Ride Losers too Long: Theory and Evidence,” Journal of Finance, vol. 40, p. 770-790.
- Barberis, Nicholas, Shleifer, Andrei and Robert Vishny (1998), “A Model of Investor Sentiment,” Journal of Financial Economics, vol. 49, pp. 307-343; Daniel, Kent, Hirsheifer, David and Avanidhar Subrahmanyam (1998), ”Investor Psychology and Security Market Under- and Overreactions,” The Journal of Finance, vol 53, no. 6., pp. 1839-1885; De Long, J. Bradford, Shleifer, Andrei, Summers, Lawrence and Robert Waldmann (1990), “Noise Trader Risk in Financial Markets,” The Journal of Political Economy, vol. 98, no. 4, pp. 703-738.
- In this simple formulation, we have deliberately done little to clean or otherwise refine the input data, for example adjusting for outliers. In the more sophisticated implementations, we have taken greater care in data curation.
- They may also be prone to structural biases associated with market capitalization or even seasonal effects. See David Blitz, Huij, Joop, and Martens, Martin (2011), ”Residual Momentum,” Journal of Empirical Finance, Vol. 18, pp. 506-521.
- One conception of Peer Momentum is discussed in Hoberg, Gerard and Gordon Phillips, “Text-Based Industry Momentum,” Working Paper, 2017. The implementation used in this paper is grounded in similar principles, but represents a distinct Acadian proprietary formulation.
- This is a matter of calculation mechanics not interpretation. If we were to add a constant level of alpha to the sophisticated factor’s returns, the R2 wouldn’t change.
- Peer’s 83bp monthly return is 1/12th of the annual return of 9.92% shown in Figure 3b.
- We regress stocks’ Peer Momentum exposures on their Baseline exposures (in the cross section) and use the residuals as the inputs to portfolio formation. This is a close equivalent to imposing a linear constraint of zero exposure to Baseline in portfolio construction.
- Average annual returns drop from 8.04% to 6.82%.
Hypothetical Legal Disclaimer
Acadian is providing hypothetical performance information for your review as we believe you have access to resources to independently analyze this information and have the financial expertise to understand the risks and limitations of the presentation of hypothetical performance. Please immediately advise if that is not the case.
Hypothetical performance results have many inherent limitations, some of which are described below. No representation is being made that any account will or is likely to achieve profits or losses similar to those shown. In fact, there are frequently sharp differences between hypothetical performance results and the actual performance results subsequently achieved by any particular trading program.
One of the limitations of hypothetical performance results is that they are generally prepared with the benefit of hindsight. In addition, hypothetical trading does not involve financial risk, and no hypothetical trading record can completely account for the impact of financial risk in actual trading. For example, the ability to withstand losses or to adhere to a particular trading program in spite of trading losses are material points which can also adversely affect actual trading results. There are numerous other factors related to the markets in general or to the implementation of any specific trading program which cannot be fully accounted for in the preparation of hypothetical performance results and all of which can adversely affect actual trading results.
Legal Disclaimer
These materials provided herein may contain material, non-public information within the meaning of the United States Federal Securities Laws with respect to Acadian Asset Management LLC, Acadian Asset Management Inc. and/or their respective subsidiaries and affiliated entities. The recipient of these materials agrees that it will not use any confidential information that may be contained herein to execute or recommend transactions in securities. The recipient further acknowledges that it is aware that United States Federal and State securities laws prohibit any person or entity who has material, non-public information about a publicly-traded company from purchasing or selling securities of such company, or from communicating such information to any other person or entity under circumstances in which it is reasonably foreseeable that such person or entity is likely to sell or purchase such securities.
Acadian provides this material as a general overview of the firm, our processes and our investment capabilities. It has been provided for informational purposes only. It does not constitute or form part of any offer to issue or sell, or any solicitation of any offer to subscribe or to purchase, shares, units or other interests in investments that may be referred to herein and must not be construed as investment or financial product advice. Acadian has not considered any reader's financial situation, objective or needs in providing the relevant information.
The value of investments may fall as well as rise and you may not get back your original investment. Past performance is not necessarily a guide to future performance or returns. Acadian has taken all reasonable care to ensure that the information contained in this material is accurate at the time of its distribution, no representation or warranty, express or implied, is made as to the accuracy, reliability or completeness of such information.
This material contains privileged and confidential information and is intended only for the recipient/s. Any distribution, reproduction or other use of this presentation by recipients is strictly prohibited. If you are not the intended recipient and this presentation has been sent or passed on to you in error, please contact us immediately. Confidentiality and privilege are not lost by this presentation having been sent or passed on to you in error.
Acadian’s quantitative investment process is supported by extensive proprietary computer code. Acadian’s researchers, software developers, and IT teams follow a structured design, development, testing, change control, and review processes during the development of its systems and the implementation within our investment process. These controls and their effectiveness are subject to regular internal reviews, at least annual independent review by our SOC1 auditor. However, despite these extensive controls it is possible that errors may occur in coding and within the investment process, as is the case with any complex software or data-driven model, and no guarantee or warranty can be provided that any quantitative investment model is completely free of errors. Any such errors could have a negative impact on investment results. We have in place control systems and processes which are intended to identify in a timely manner any such errors which would have a material impact on the investment process.
Acadian Asset Management LLC has wholly owned affiliates located in London, Singapore, and Sydney. Pursuant to the terms of service level agreements with each affiliate, employees of Acadian Asset Management LLC may provide certain services on behalf of each affiliate and employees of each affiliate may provide certain administrative services, including marketing and client service, on behalf of Acadian Asset Management LLC.
Acadian Asset Management LLC is registered as an investment adviser with the U.S. Securities and Exchange Commission. Registration of an investment adviser does not imply any level of skill or training.
Acadian Asset Management (Singapore) Pte Ltd, (Registration Number: 199902125D) is licensed by the Monetary Authority of Singapore. It is also registered as an investment adviser with the U.S. Securities and Exchange Commission.
Acadian Asset Management (Australia) Limited (ABN 41 114 200 127) is the holder of Australian financial services license number 291872 ("AFSL"). It is also registered as an investment adviser with the U.S. Securities and Exchange Commission. Under the terms of its AFSL, Acadian Asset Management (Australia) Limited is limited to providing the financial services under its license to wholesale clients only. This marketing material is not to be provided to retail clients.
Acadian Asset Management (UK) Limited is authorized and regulated by the Financial Conduct Authority ('the FCA') and is a limited liability company incorporated in England and Wales with company number 05644066. Acadian Asset Management (UK) Limited will only make this material available to Professional Clients and Eligible Counterparties as defined by the FCA under the Markets in Financial Instruments Directive, or to Qualified Investors in Switzerland as defined in the Collective Investment Schemes Act, as applicable.