Current Opportunities in Public Credit Markets
Key Takeaways
- Credit has an evergreen appeal, and current conditions make this an attractive time to invest.
- Systematic active credit strategies are relatively new and offer a compelling way of allocating to the asset class. These strategies offer advantages over ostensibly passive vehicles, and they complement traditional discretionary approaches.
- Systematic security selection applies concepts similar to those used in the equity world, but differences between the two markets call for specialized skillsets and infrastructure.
Table of contents
In the U.S., outstanding public corporate debt has more than tripled from before the Global Financial Crisis to $9 trillion, roughly one-fifth the size of the U.S. equity market.1 The range of participants has also expanded, not just through broadened issuance but also through developments like the expansion of direct lending and bank loans. The rapid growth of electronic trading and increased availability of data have improved market liquidity and transparency.
The corporate credit market’s evolution has brought new attention to this distinct asset class along with new opportunity for investors. In this note, we make a case that, beyond the evergreen appeal of exposure to the credit risk premium, corporate credit allocations look attractive in the current market and economic environment. We discuss advantages of systematic active credit strategies as a method of allocation and demonstrate their complementarity to traditional discretionary credit portfolios. We also touch on key similarities and differences relative to systematic equity, which highlight the need for specialized skillsets and infrastructure.
Corporate Credit Allocations: Current Appeal
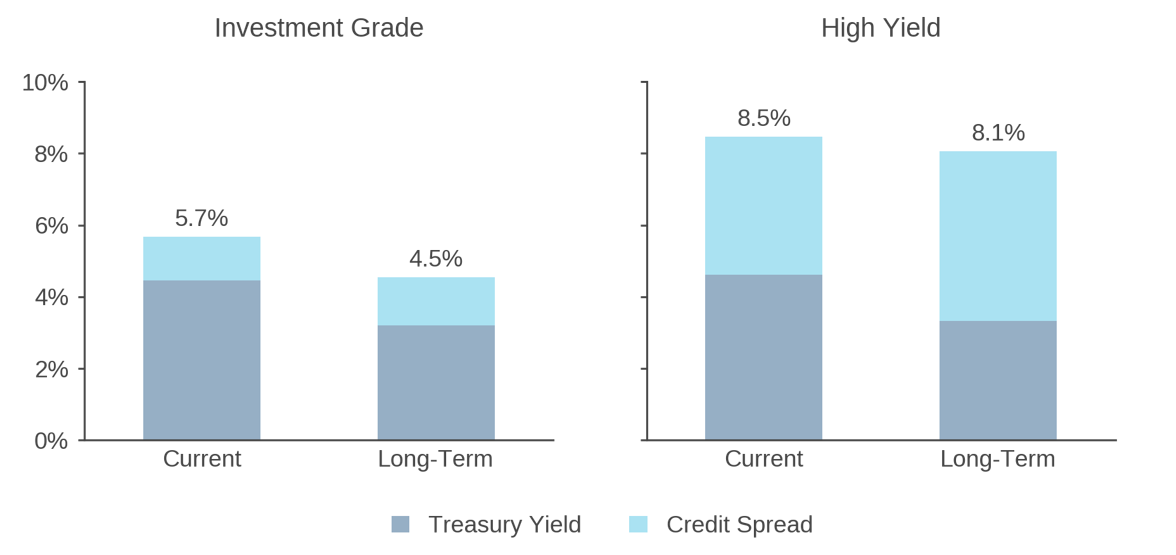
In the current environment, investment grade and high-yield markets offer attractive compensation for bearing credit risk. The spread above Treasuries in investment grade is in line with the long-term median (122bps versus 134bps). In high yield, spreads are close to 400bps but have tightened year-to-date to below the long-term median of 473bps. As Figure 1 shows, adding this credit spread onto risk-free Treasuries results in all-in yields of 5.7% in investment grade and 8.5% in high yield, both of which are above the long-term median and high enough to meaningfully help many asset owners meet performance targets.
Figure 1: U.S. Corporate Credit: Current Yields in Long-Term Context
Yield to Worst
We view current spreads as especially favorable given the strength of corporate balance sheets. Interest coverage ratios for both universes are at or above multi-decade highs, and the net-debt-to-EBITDA ratio for the median high-yield-rated company is at a 10-year low.2 These conditions are a byproduct of the low interest rate environment from late 2020 to early 2022, which incentivized companies to issue debt and lock in favorable financing costs. In contrast, floating rate debt in the private credit and bank loan markets have led to higher interest expenses, which could increase the number of defaults and restructurings.
Exposure to the Credit Risk Premium: An Evergreen Case
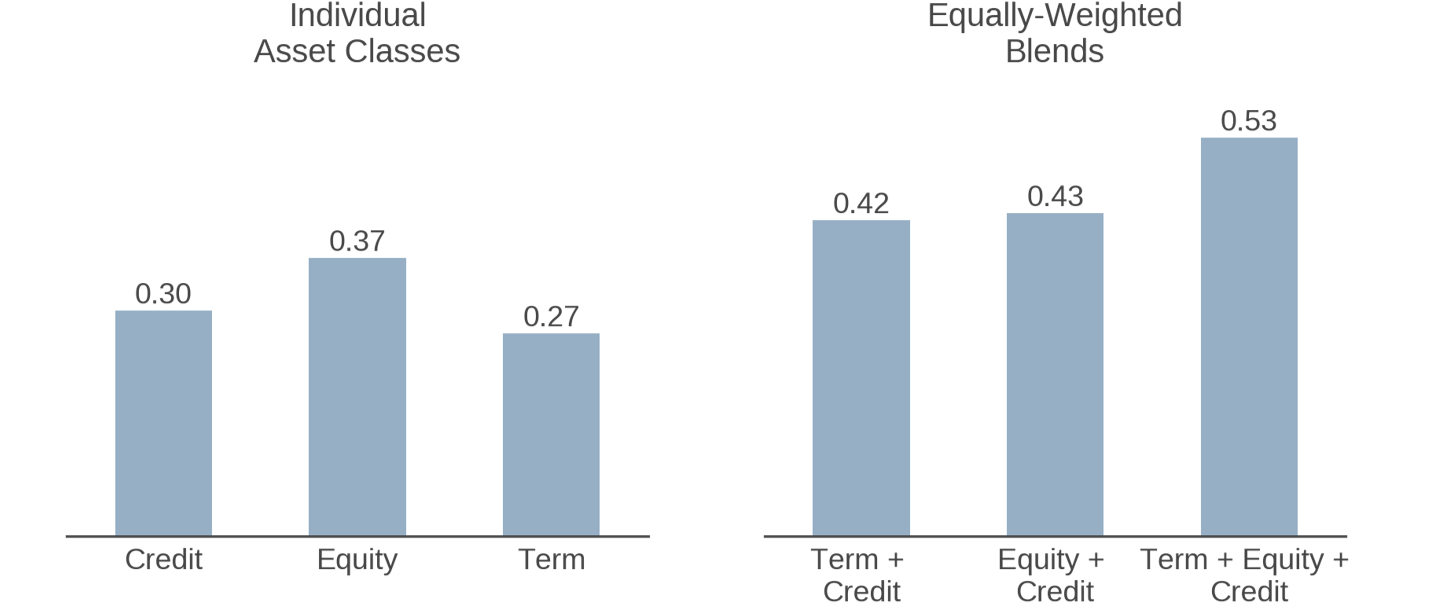
The credit risk premium, which provides compensation for bearing the risk of degrading credit worthiness and default, is observable across geographies, rating categories, industries, and maturities, in both cash and derivative markets.3 In the U.S., investment grade (IG) and high yield (HY) credit excess returns over Treasuries have averaged 0.8% and 2.7%, respectively, during the past 25 years.4 The left panel of Figure 2 shows that risk-adjusted returns (i.e., Sharpe Ratios) from IG credit look reasonably comparable to those generated by equities and intermediate Treasuries over the past 50 years.
The credit premium is distinct from both the equity premium and the term premium. Intuitively this makes sense, because they arise from different economic drivers (and are priced in different markets). The term premium reflects risk that interest rates may change, and it has a de minimis correlation with both credit and equity. Credit and equity premia derive from different aspects of and sensitivities to company fundamentals,5 and their returns have only a modest correlation with one another (0.36).
The diversification benefit from adding a credit allocation that these low correlations imply is shown directly in the right panel of Figure 2. Adding an equally weighted credit allocation to equities or bonds generates substantial increases in Sharpe Ratios, and an equally weighted portfolio of all three performs even better.
While the analysis in Figure 2 is based on IG credit, which offers the longest available history of data, HY has also offered strong returns and diversification benefits relative to equities, although more modest than IG. Since 1989, HY has realized a Sharpe Ratio of 0.29 and an equity correlation of 0.59 (versus 0.44 for equities and IG over this more limited period).
Figure 2: Long-Term Sharpe Ratios
New Opportunity: Systematic Active Credit
Systematic active credit strategies represent a relatively new and attractive method of investing in corporate bonds, either on a standalone basis or as a natural complement to traditional discretionary credit allocations.
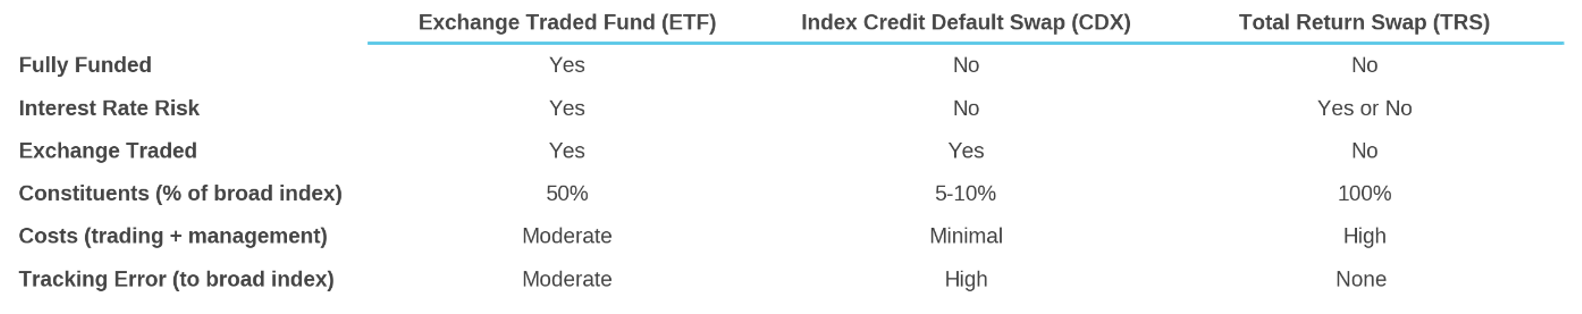
The institutional credit market is overwhelmingly an active, rather than a passive, space. Though a variety of passive credit vehicles exists, they all fall short in one way or another of replicating a broad corporate bond index (see Figure 3). As a result, even asset owners who primarily seek to access the credit risk premium rather than incremental returns from security selection, generally do so via expressly active strategies.6
Figure 3: Characteristics of Passive Approaches in the U.S. Credit Market
Within this active sphere, discretionary strategies still dominate. Application of systematic investing concepts to corporate bonds wasn’t even formally studied until the early 2010s. Their late adoption is attributable to a lack of publicly available data for corporate bond transactions, complexities in modeling finite-life securities with different terms and seniority, and a historically manual trading environment. But times have changed. The market is awash in data, infrastructure to support its analysis is more accessible than ever, and electronic execution is now commonplace. As a result, systematic active management is now feasible and growing.
In systematic credit, broad themes motivating security selection tend to resemble those that drive systematic equity, i.e., capturing mispricings that derive from behavioral biases, informational inefficiencies, market-structure effects, and dislocations. Signals tend to differ, however, because many attributes and events that predict stock returns have little efficacy in credit or even produce contrary effects. For example, stock buybacks and special dividends are typically good news for equity holders but bad news for creditors because, all things equal, they leave less cash on-hand to pay existing debt. As such, successful systematic credit investing requires specialized skillsets and different infrastructure than systematic equity.
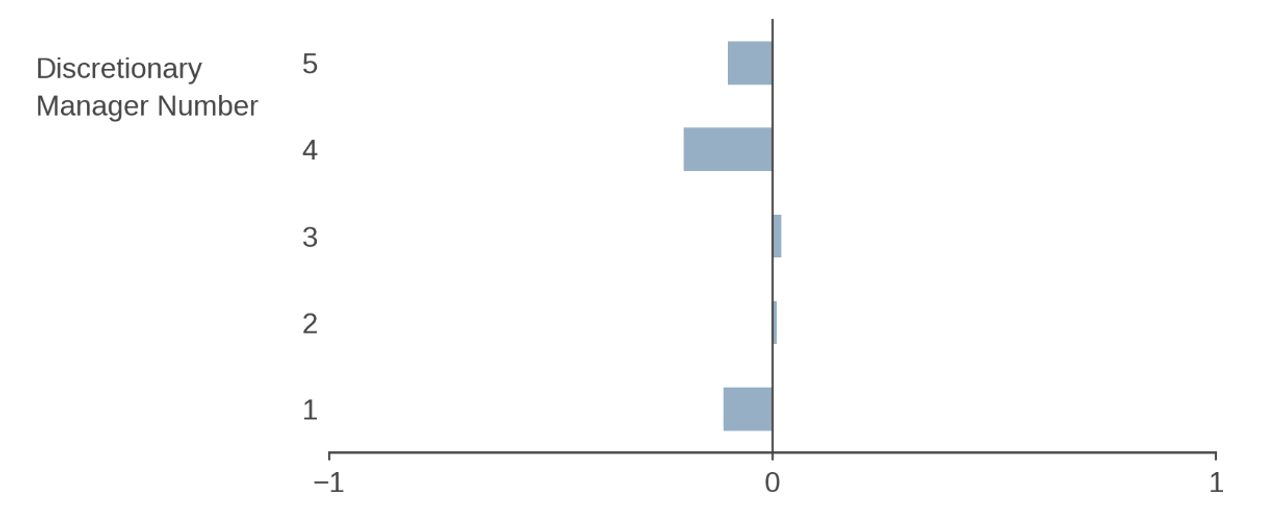
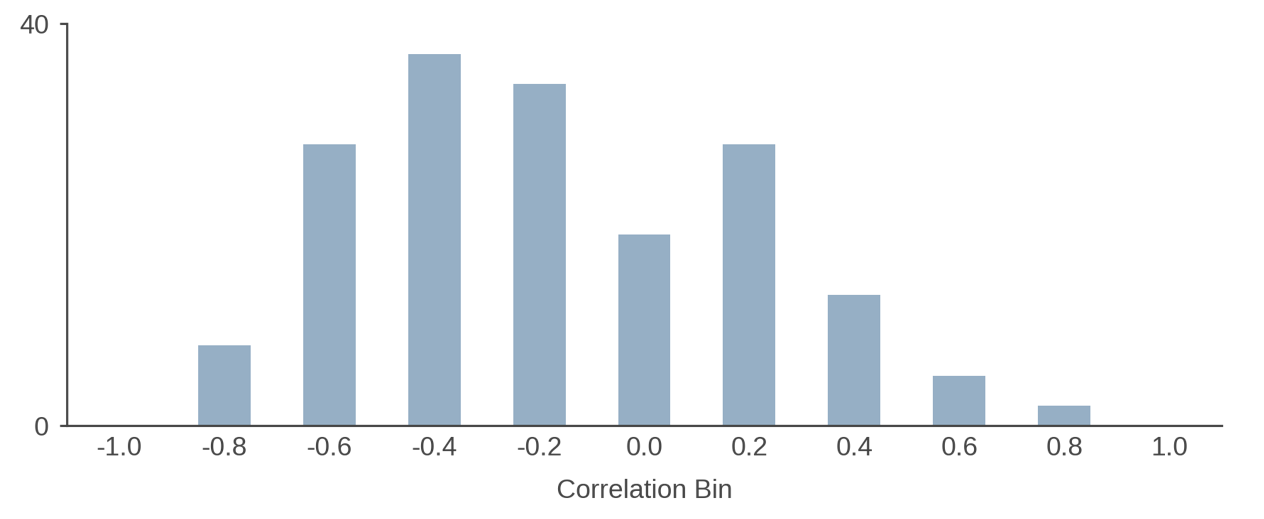
Systematic credit is also demonstrably additive to discretionary credit allocations. Figure 4 shows that the aggregate holdings of large discretionary managers score poorly with respect to attributes that systematic managers tend to seek, with flat to negative exposures to a composite of value, momentum, carry, and quality characteristics. Much as in equities, top discretionary credit portfolios, which are also larger in AUM than available systematic offerings, are likely selecting bonds based on different criteria, e.g., taking sector or ratings bets or market timing. Even in cases where the investment approaches of discretionary credit managers are philosophically aligned with systematic concepts, e.g., seeking bonds with attractive spreads from high-quality issuers, they likely employ different metrics of relevant characteristics, including measures of default risk. For these reasons, systematic and discretionary allocations can sit naturally with one another in a portfolio.
Figure 4: Top Discretionary Managers’ Exposures to a Systematic Credit Approach
Moreover, advantages of systematic risk modeling, portfolio construction, and implementation are also evident in the data. Figure 5 shows that (largely discretionary) high-yield strategies deliver imprecise and, on average, low credit exposure relative to their benchmarks. This under-realization of beta is likely a function of higher cash reserves, overly conservative bond selection (e.g., avoiding headline risk of holding defaulted bonds), and an aversion to topping-up risk via derivatives. Regardless of the motivation, the systematic investing framework is designed to help managers monitor key exposures and target them with precision.
Figure 5: Correlation of Excess Returns versus High Yield Credit Risk Premium
Conclusion
There is an evergreen case for corporate credit allocations, but in the current environment we find them particularly appealing because 1) all-in yields have returned to levels that meaningfully help investors reach overall performance targets, and 2) current credit spreads offer attractive compensation for risk. In implementing credit allocations, we would encourage investors to explore systematic active strategies. Now feasible and growing, systematic active credit offers numerous advantages relative to ostensibly passive vehicles and is additive relative to traditional discretionary credit offerings.
Endnotes
- As of August 31, 2023. Pre-GFC data is from December 31, 2006. Public corporate debt assets proxied by the sum of the ICE BofA U.S. Corporate Index and the ICE BofA U.S. High Yield Index.
- Goldman Sachs. August 3, 2023. Global Credit Trader.
- Asvanunt, A and Richardson, S A (2017) Credit risk premium. Journal of Fixed Income, 26 (3). pp. 6-24. ISSN 1059-8596.
- Annualized, based on ICE BofA U.S. Corporate and High Yield Indexes from 1997-2022.
- Equity holders share in the upside of a company’s growth, while debt holders are more senior in the capital structure but have capped upside based on the contractual terms of the bond. Aggregating to the index level, compositional differences drive an additional wedge between the behavior of major equity and credit benchmarks like the S&P 500 Index versus the ICE BoA U.S. Corporate Index. They generally differ in terms of their sectoral makeup and specific companies represented, in part because some firms only issue public debt and not equity, and vice-versa.
- eVestment assets in active U.S. investment grade and high yield categories are over ten times larger than their respective passive categories (as of December 31, 2022).
Don't miss the next Acadian Insight
Get our latest thought leadership delivered to your inbox
Legal Disclaimer
These materials provided herein may contain material, non-public information within the meaning of the United States Federal Securities Laws with respect to Acadian Asset Management LLC, Acadian Asset Management Inc. and/or their respective subsidiaries and affiliated entities. The recipient of these materials agrees that it will not use any confidential information that may be contained herein to execute or recommend transactions in securities. The recipient further acknowledges that it is aware that United States Federal and State securities laws prohibit any person or entity who has material, non-public information about a publicly-traded company from purchasing or selling securities of such company, or from communicating such information to any other person or entity under circumstances in which it is reasonably foreseeable that such person or entity is likely to sell or purchase such securities.
Acadian provides this material as a general overview of the firm, our processes and our investment capabilities. It has been provided for informational purposes only. It does not constitute or form part of any offer to issue or sell, or any solicitation of any offer to subscribe or to purchase, shares, units or other interests in investments that may be referred to herein and must not be construed as investment or financial product advice. Acadian has not considered any reader's financial situation, objective or needs in providing the relevant information.
The value of investments may fall as well as rise and you may not get back your original investment. Past performance is not necessarily a guide to future performance or returns. Acadian has taken all reasonable care to ensure that the information contained in this material is accurate at the time of its distribution, no representation or warranty, express or implied, is made as to the accuracy, reliability or completeness of such information.
This material contains privileged and confidential information and is intended only for the recipient/s. Any distribution, reproduction or other use of this presentation by recipients is strictly prohibited. If you are not the intended recipient and this presentation has been sent or passed on to you in error, please contact us immediately. Confidentiality and privilege are not lost by this presentation having been sent or passed on to you in error.
Acadian’s quantitative investment process is supported by extensive proprietary computer code. Acadian’s researchers, software developers, and IT teams follow a structured design, development, testing, change control, and review processes during the development of its systems and the implementation within our investment process. These controls and their effectiveness are subject to regular internal reviews, at least annual independent review by our SOC1 auditor. However, despite these extensive controls it is possible that errors may occur in coding and within the investment process, as is the case with any complex software or data-driven model, and no guarantee or warranty can be provided that any quantitative investment model is completely free of errors. Any such errors could have a negative impact on investment results. We have in place control systems and processes which are intended to identify in a timely manner any such errors which would have a material impact on the investment process.
Acadian Asset Management LLC has wholly owned affiliates located in London, Singapore, and Sydney. Pursuant to the terms of service level agreements with each affiliate, employees of Acadian Asset Management LLC may provide certain services on behalf of each affiliate and employees of each affiliate may provide certain administrative services, including marketing and client service, on behalf of Acadian Asset Management LLC.
Acadian Asset Management LLC is registered as an investment adviser with the U.S. Securities and Exchange Commission. Registration of an investment adviser does not imply any level of skill or training.
Acadian Asset Management (Singapore) Pte Ltd, (Registration Number: 199902125D) is licensed by the Monetary Authority of Singapore. It is also registered as an investment adviser with the U.S. Securities and Exchange Commission.
Acadian Asset Management (Australia) Limited (ABN 41 114 200 127) is the holder of Australian financial services license number 291872 ("AFSL"). It is also registered as an investment adviser with the U.S. Securities and Exchange Commission. Under the terms of its AFSL, Acadian Asset Management (Australia) Limited is limited to providing the financial services under its license to wholesale clients only. This marketing material is not to be provided to retail clients.
Acadian Asset Management (UK) Limited is authorized and regulated by the Financial Conduct Authority ('the FCA') and is a limited liability company incorporated in England and Wales with company number 05644066. Acadian Asset Management (UK) Limited will only make this material available to Professional Clients and Eligible Counterparties as defined by the FCA under the Markets in Financial Instruments Directive, or to Qualified Investors in Switzerland as defined in the Collective Investment Schemes Act, as applicable.