
Volatility Investing: Characteristics of a Well-Conceived Approach
Key Takeaways
- The COVID crisis has provided painful reminders of a handful of avoidable mistakes that managers have repeatedly made in volatility investing.
- Yet dismissing the viability of volatility investing would be an inappropriate inference; well-conceived approaches provide meaningful opportunities to source both returns premia and protection.
- Volatility investing should be informed by nuanced understanding of how volatility is priced in the option market. It calls for refinement throughout the investment process and ongoing market engagement.
Table of contents
Market crises have a knack for shining a spotlight on what during quieter times is often regarded as a specialized investing niche – options. The COVID crisis has been no exception. As shown below, blowups of several volatility trading funds and strategies have made headlines, as have high-profile debates about the benefits and costs of option-based tail hedging strategies. In this note, we consider key takeaways related to this crisis regarding the prudent incorporation of volatility investments into a portfolio, many of which echo lessons that ought to have been learned from prior episodes of market stress.

We start by examining mistakes that managers have repeatedly made in volatility investing. We then shed light on the unique structure of the option market, which makes volatility investing an especially inappropriate venue for simplistic and static smart beta-oriented strategies. We close by outlining defining characteristics of better-conceived approaches, including the combination of returns-seeking and protective elements informed by domain knowledge, adaptiveness to evolving market conditions and structure, and risk management that is tail-sensitive and forward-looking.
Common Mistakes
A handful of recurring and avoidable errors have led to many high-profile blow ups and other frustrating outcomes in volatility investing. Most prominent is the failure to risk-manage explosive payoffs. To begin with, volatility itself can be enormously volatile.1 During March 2020, S&P 500 realized volatility exceeded 95% on an annualized basis, implying 6%+ daily moves, more than 8 times higher than in January (11.5% annualized) and the highest levels observed since the crash of 1929. Sellers of volatility that over-relied on volatility’s recent behavior in setting their risk budgets or in sizing positions faced the prospect of potentially catastrophic losses or being stopped out.
Moreover, certain volatility-selling instruments have non-linear exposure to volatility, which magnifies tail risk in the event of sudden market turbulence. An important example is the variance swap, a well-conceived and established OTC instrument whose development in the late 1990s paved the way for the mainstreaming of volatility trading.2 Variance swaps represent the canonical means to harvest the Volatility Risk Premium (VRP), i.e., the tendency for index option implied volatilities to trade above an underlying’s prevailing realized volatility. (Please see the sidebar on page 3 for an explanation of the VRP.) The payoff of a variance swap, as the name suggests, is based on the square of volatility rather than volatility itself. Because many would-be volatility sellers are uncomfortable with the instrument’s inherently convex exposure to volatility, option dealers developed capped variance swaps, which – for a price – embed a limit on potential losses, conventionally set at two and a half times the prevailing level of volatility. During the COVID crisis, an asset owner that effectively underwrote such caps, presumably reflecting a view that a catastrophic volatility spike was extraordinarily unlikely, suffered a multi-billion-dollar loss, as reported in the financial media.
Many volatility investing strategies involve both buying and selling options, such as expressing a view on short-term versus long-term volatility, and doing so presents additional complexity. For example, an option portfolio’s exposure to an underlying’s volatility may flip from long to short (or vice versa) or vary dramatically as the underlying trades up or down, time passes, or volatility rises or falls. Moreover, risk dynamics may be counterintuitive in nature, with exposures sometimes becoming more variable and more pronounced when conditions are calm.
Mark-to-market exposure is another important facet of risk in many volatility strategies. The problem is well illustrated by way of a historical example: the 1998 implosion of Long-Term Capital Management (LTCM). The hedge fund wagered that supply-demand imbalances in the option market had pushed long-dated (3-5 year) implied volatilities to levels that the underlying indexes were highly unlikely to realize over long periods. But a violent options short squeeze triggered by the Ruble Crisis generated devastating mark-to-market losses as implied volatilities spiked, one of the main reasons why the fund was forced to liquidate.3
An insidious problem for investors who are relatively new to volatility is a failure to understand the P&L drivers of a particular strategy. For example, VRP harvesting approaches vary in terms of their equity exposure, owing to design choices in their implementations. Moreover, as volatility trading instruments and vehicles have proliferated, including VIX futures, options, and ETNs, so has the risk of confusion over the nature of their payoffs. Despite their enormous popularity, VIX-based products do not allow the expression of either of the two types of views on volatility that are of the greatest natural interest among investors: they neither provide exposure to the VRP nor do they provide exposure to fluctuations in the VIX Index itself.4 Instead, VIX futures allow investors to express a more esoteric view that upon the contract’s expiration, the VIX will be higher or lower than the current futures price. Moreover, P&L from VIX futures, and derivative products based on them, displays more complex behavior than many investors appreciate, reflective of the shape and dynamics of the VIX futures curve as well as roll and settlement behaviors. Furthermore, the VIX ETN complex has at times grown so large that it has influenced the behavior of the VIX itself, i.e., “the tail has wagged the dog.”
While the mistakes discussed above have special relevance for volatility strategies, the domain is also afflicted by errors that are prevalent in other spheres of investing. In risk-reducing applications of volatility, for example, misestimation of basis risk often leads to disappointing outcomes. Common causes include breakdowns in historical relationships between market returns and implied volatilities and some options-based hedging strategies’ dependence on the specific path that the underlying market has traveled rather than just on its total return.
Origins of the Volatility Risk Premium
Returns premia associated with volatility investing derive from the option market. When a dealer trades an option with a buyer or a seller, it takes on long or short exposure to the underlying. The dealer can roughly neutralize that exposure through an offsetting position in futures, ETFs, or stock, but the size of the hedge is only correct momentarily. The dealer must adjust its position constantly as the underlying rises or falls, a process known as “delta hedging.” While delta hedging keeps the combined options-plus-hedge position roughly neutral with respect to its long/short exposure to the underlying, the specific nature of the trading activity generates exposure to the underlying’s realized volatility. In pricing options, therefore, expectations of the underlying’s expected volatility are a crucial input, so much so that option prices often are expressed in terms of that volatility input, which is known as an implied volatility.
If an underlying’s realized volatility were knowable in advance and dealers could adjust their hedge positions costlessly, then classical pricing theory suggests that option prices, i.e., implied volatilities, would trade in-line with the prevailing realized volatility of the underlying. Those assumptions are unrealistic, however, and two major risks influence dealers’ pricing, as a result. The more straightforward one is that the underlying’s volatility may rise or fall over the life of the option, generating gains or losses for dealers largely depending on whether they are net long or short options. Specifically, dealers that are net short options tend to lose money as volatility rises and make money as it falls (and vice versa for dealers that are net long). The second more subtle, but equally important, risk is that when dealers are net short options, they also may be vulnerable to substantial losses if the underlying “gaps” sharply up or down before they can adjust their hedges.
Despite these risks, we might still not expect a risk premium in volatility if supply and demand among investors who use options to express directional views were roughly balanced, cancelling each other out and leaving no need for intermediaries to carry volatility positions. In the index option market, however, that has generally not been the case. Dealers have traditionally been net sellers of options to meet demand, e.g., for portfolio hedges. To compensate dealers and other intermediaries for warehousing risks inherent in being net suppliers of volatility, index option prices have typically embedded a premium, meaning that index option implied volatilities have tended to trade above prevailing levels of realized volatility. This persistent pattern, displayed in Figure 1 for the S&P 500, is known as the Volatility Risk Premium (VRP).* The chart shows that over the past 25 years, short-term “near-the-money” options indeed have tended to trade at implied volatilities above what the market has subsequently realized, even taking the March 2020 volatility explosion into account. In recent years, increased awareness of the VRP and the imprimatur of academic research on the topic have generated interest in index volatility selling, and in volatility investing and trading, more generally.
Figure 1: The S&P 500 Volatility Risk Premium
1m, 50-delta implied volatility and subsequent realized volatility
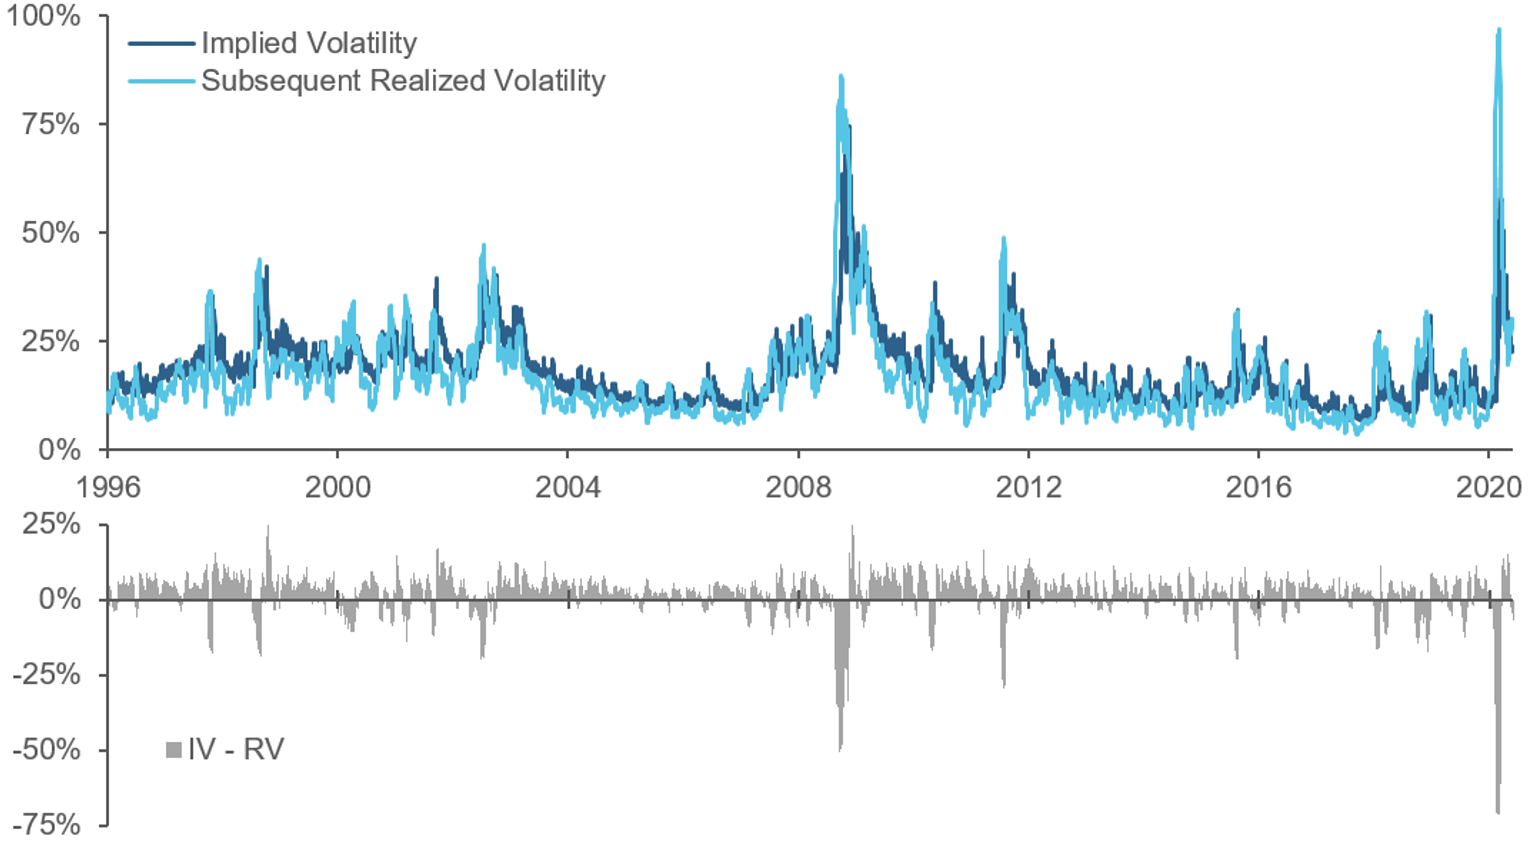
* More precisely, the Variance Risk Premium.
The Option Market’s Singular Structure
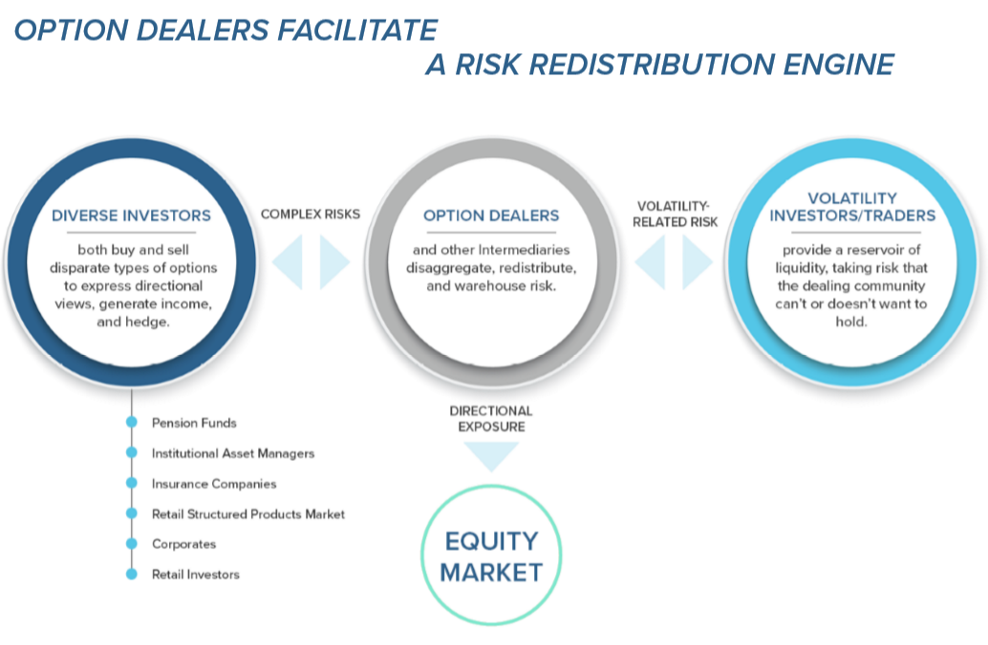
To avoid disappointing outcomes, volatility investing should be informed by knowledge of the option market’s unique characteristics. The key to understanding how the option market functions is to recognize that it is not a matching engine. That is, it does not simply connect investors who are looking to express opposite sides of the same precise view. Instead, investors execute with intermediaries, including investment banks and other professional market makers and traders, who in facilitating investors’ transactions, take on multifaceted and complex risks. These include exposures to volatility, events, market gaps, dividends, cross-sectional stock correlations, and more. Intermediaries can straightforwardly offload some of these exposures into the market and reduce others through offsetting flows, as illustrated in graphic below, but they have traditionally warehoused a considerable amount of risk, more of certain types than others; they do not tend to go home flat at the end of the day.
The customers that intermediaries trade with use options to express directional views, to generate income, and to hedge. This diverse array of customers includes pension plans, insurance companies, corporates, hedge funds, institutional asset managers, and retail investors. These investors have varied motivations to use options and products that contain embedded optionality, and they tend to inhabit different segments of the market as a result. For example, some almost exclusively trade longer-dated index options while others focus on short-term single-stock options. The mix of participants, and hence the balance of supply and demand for volatility, varies across underlyings, option strikes, and option maturities.
Not only is the option market heterogenous, but its structure constantly evolves, influenced by changing macroeconomic conditions, regulatory pressures on both dealers and end-users, and expansion of the available product set. As a historical example, the option mispricing that LTCM tried to capitalize on was born out of an imbalance between supply and demand that was rooted in innovation in structured products as well as the economic conditions of the mid-1990s.5
Of greater contemporary relevance, during the post- GFC environment, the balance of supply and demand for volatility has been influenced by countervailing trends. On the one hand, regulation has limited global banks’ appetite to sell volatility and warehouse tail risk. On the other, volatility trading vehicles have proliferated, lowering barriers for investors to step in and provide liquidity. Notable product development has included the listed VIX futures-options-ETN complex and myriad swap-based systematic short volatility risk premia strategies offered by investment banks and alternative risk premia purveyors (ARPs). In the listed option market, the popularization of weekly options, which permit greater precision in expressing short-term views, may be cultivating new sources of option activity and/or siphoning it away from traditional monthly expiries that have long been a vehicle of choice for many systematic option-selling strategies. (See Figure 2.)
Figure 2: The option market continues to evolve
Growth in daily VIX futures volume (left) and fraction of S&P 500 options volume involving contracts with 7 or fewer days to expiry (right)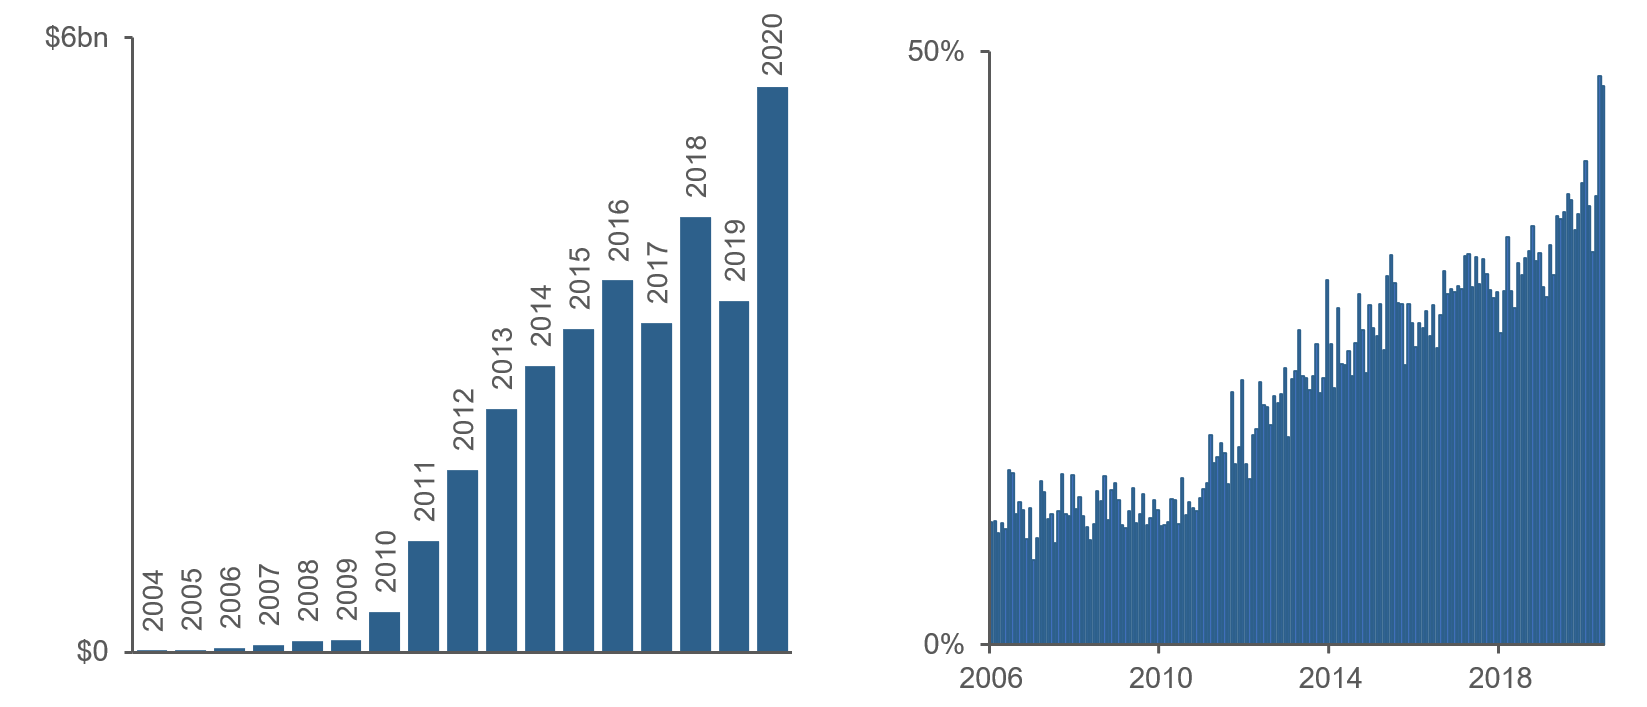
Priorities in Volatility Investing
The option market’s complex and constantly evolving structure make it a particularly inappropriate domain for the application of smart beta approaches, which are based on the premise of immutable and stable returns premia that are safely harvestable via simple and static implementations. The question then becomes: what are the hallmarks of better-conceived volatility investing approaches?
We would highlight three key characteristics. The first is the combination of both returns-seeking and protective elements, each informed by deep domain knowledge. Pricing varies across different types of options, due to heterogeneity in both the balance of supply and demand and risks associated with providing liquidity for options with different characteristics. Understanding this variation allows for the harvesting of volatility-related risk premia in market segments where it is attractive while elsewhere sourcing effective defensive volatility positions at reasonable cost (up-front premium + carry). Knowledge of market structure also informs implementation, including how best to engineer returns-seeking payoff profiles to optimally trade off tail exposure against available premium as well as estimates of trading costs and liquidity under different market conditions.
A second defining characteristic is adaptivity to market conditions and structure. Over the longer arc of the history of volatility trading, conventional wisdom has at times oscillated between short and long predispositions. The subdued post-GFC volatility environment encouraged the growth of volatility selling, with traders pouncing on flare-ups. In our view, net positioning should not be dogmatic. It should embed signals that respond to the pricing environment, whether driven by short-term changes in investor risk aversion and liquidity conditions or longer-term trends in regulation and product development. Crucially, positioning should also reflect dynamism in risk forecasts as well as constraints that dampen the asymmetric risk-reward profiles of short- or long-volatility profiles in especially quiet or turbulent environments.
A third defining characteristic is tail-sensitive and forward-looking risk management. For volatility strategies, we advocate long-term risk budgeting and tactical position sizing on the basis of their contribution to portfolio tail risk, owing to the variability of volatility and the non-linear payoffs of some volatility trading instruments. In assessing risk contributions, managers should take special care not to net out long and short volatility positions where their behaviors may diverge, for example across maturities, strikes, or underlyings, even if under what would seem historically unlikely circumstances. More broadly, tail risk analysis should reflect a wide range of potential market scenarios, not limited by (recent) historical experience. The 2018 implosion of the XIV ETN exposed the limitations of a purely backward-looking risk management approach. While the XIV’s 92% one-day loss on February 5th was foreseeable to sophisticated investors who knew how the product was constructed and hedged, the loss was almost inconceivable, a 24-sigma event, based solely on the instrument’s historical returns. In risk-managing volatility investments, catastrophic losses are often attributable to failures of market awareness and imagination.
Conclusion
While the COVID crisis has provided painful reminders of common mistakes in volatility investing, well-conceived approaches have merit. The central challenge in implementing return-seeking elements is to retain sufficient premium while controlling complex and potentially explosive risk, and in implementing defensive elements it is to balance available protection against cost. Neither task is easy: a volatility risk premium exists for good reason, and meaningful reductions in downside equity exposure ought to be expensive.
To source opportunity from volatility investing, therefore, requires nuanced understanding of how volatility behaves and is priced, adaptiveness to changing conditions and evolving market structure, as well as creativity in envisioning potential risks. The domain is especially inappropriate for the application of simple and static investing approaches; it calls for refinement throughout the investment process and continuous market engagement.
Endnotes
- In industry jargon, “vol of vol” can be extremely high.
- The breakthrough that led to the variance swap’s success was the development of an options hedge that delivered a “flat gamma profile,” i.e., stable delta hedging P&L sensitivity with respect to the underlying’s price level and time to maturity. Please contact us for further details.
- Mark-to-market issues arise not only in returns-seeking volatility investing but also in hedging with options. To help mitigate the cost of buying puts, investors often also sell options as well, either puts or calls (i.e., buying a put spread or collaring an equity position), which lowers the up-front cost at the expense of foregone protection against the most severe losses or reduced upside exposure to the underlying’s appreciation. But the mark-to-market behavior of multi-leg option positions may not resemble the “hockey stick” diagrams of option payoffs at expiry. In particular, they may not provide anticipated offsets to the underlying’s losses, leaving investors with uncomfortable questions to answer about performance and decisions to make as to how to manage the hedge until expiry.
- The former can be accomplished by delta hedging options or trading variance swaps, while the latter turns out to be impossible, because the VIX is calculated from a constantly evolving portfolio of options.
- Specifically, high interest rates and low volatility created attractive pricing for principal protected structured notes that offered equity upside. The notes contained embedded multi-year call options that investment banks were happy to write when markets were calm. As volatility picked up in the Asian Financial Crisis, however, the banks started to suffer losses on the risk that they assumed from those trades. Cover was difficult to find, though, because there are few natural sellers of long-dated options. Eventually, LTCM stepped into the gap, seeing an opportunity to supply liquidity. The fund took on a considerable fraction of the dealers’ exposure at prices that seemed highly attractive to a generation of options traders – at least until financial turmoil became acute in the summer of 1998. The episode lays bare the relevance of understanding the interplay between specific sources of option supply and demand in gauging both opportunity and risk.
Legal Disclaimer
These materials provided herein may contain material, non-public information within the meaning of the United States Federal Securities Laws with respect to Acadian Asset Management LLC, Acadian Asset Management Inc. and/or their respective subsidiaries and affiliated entities. The recipient of these materials agrees that it will not use any confidential information that may be contained herein to execute or recommend transactions in securities. The recipient further acknowledges that it is aware that United States Federal and State securities laws prohibit any person or entity who has material, non-public information about a publicly-traded company from purchasing or selling securities of such company, or from communicating such information to any other person or entity under circumstances in which it is reasonably foreseeable that such person or entity is likely to sell or purchase such securities.
Acadian provides this material as a general overview of the firm, our processes and our investment capabilities. It has been provided for informational purposes only. It does not constitute or form part of any offer to issue or sell, or any solicitation of any offer to subscribe or to purchase, shares, units or other interests in investments that may be referred to herein and must not be construed as investment or financial product advice. Acadian has not considered any reader's financial situation, objective or needs in providing the relevant information.
The value of investments may fall as well as rise and you may not get back your original investment. Past performance is not necessarily a guide to future performance or returns. Acadian has taken all reasonable care to ensure that the information contained in this material is accurate at the time of its distribution, no representation or warranty, express or implied, is made as to the accuracy, reliability or completeness of such information.
This material contains privileged and confidential information and is intended only for the recipient/s. Any distribution, reproduction or other use of this presentation by recipients is strictly prohibited. If you are not the intended recipient and this presentation has been sent or passed on to you in error, please contact us immediately. Confidentiality and privilege are not lost by this presentation having been sent or passed on to you in error.
Acadian’s quantitative investment process is supported by extensive proprietary computer code. Acadian’s researchers, software developers, and IT teams follow a structured design, development, testing, change control, and review processes during the development of its systems and the implementation within our investment process. These controls and their effectiveness are subject to regular internal reviews, at least annual independent review by our SOC1 auditor. However, despite these extensive controls it is possible that errors may occur in coding and within the investment process, as is the case with any complex software or data-driven model, and no guarantee or warranty can be provided that any quantitative investment model is completely free of errors. Any such errors could have a negative impact on investment results. We have in place control systems and processes which are intended to identify in a timely manner any such errors which would have a material impact on the investment process.
Acadian Asset Management LLC has wholly owned affiliates located in London, Singapore, and Sydney. Pursuant to the terms of service level agreements with each affiliate, employees of Acadian Asset Management LLC may provide certain services on behalf of each affiliate and employees of each affiliate may provide certain administrative services, including marketing and client service, on behalf of Acadian Asset Management LLC.
Acadian Asset Management LLC is registered as an investment adviser with the U.S. Securities and Exchange Commission. Registration of an investment adviser does not imply any level of skill or training.
Acadian Asset Management (Singapore) Pte Ltd, (Registration Number: 199902125D) is licensed by the Monetary Authority of Singapore. It is also registered as an investment adviser with the U.S. Securities and Exchange Commission.
Acadian Asset Management (Australia) Limited (ABN 41 114 200 127) is the holder of Australian financial services license number 291872 ("AFSL"). It is also registered as an investment adviser with the U.S. Securities and Exchange Commission. Under the terms of its AFSL, Acadian Asset Management (Australia) Limited is limited to providing the financial services under its license to wholesale clients only. This marketing material is not to be provided to retail clients.
Acadian Asset Management (UK) Limited is authorized and regulated by the Financial Conduct Authority ('the FCA') and is a limited liability company incorporated in England and Wales with company number 05644066. Acadian Asset Management (UK) Limited will only make this material available to Professional Clients and Eligible Counterparties as defined by the FCA under the Markets in Financial Instruments Directive, or to Qualified Investors in Switzerland as defined in the Collective Investment Schemes Act, as applicable.