Reflections on the Ukraine Crisis: Watershed for EM Investing?
Reflecting on the implications of the Ukraine crisis for EM investing, we conclude that:
-
Latent energy risk in the highest-profile EM benchmark should be viewed as a flaw in an active strategy.
-
Broad evidence suggests that the war is unlikely to trigger a significant reversal of globalization; i.e., reglobalization is more likely than deglobalization.
-
The invasion was a reminder of the ubiquity of geopolitical event risk in EM and the value of advance preparation in its management.
Table of contents
Russia’s invasion of Ukraine ranks as one of the most significant and complex geopolitical events since World War II. As the war began, many emerging markets (EM) investors naturally were preoccupied with its immediate impact on their portfolios. But with the initial shock having long-ago receded, even as the crisis continues to unfold, relevant questions for EM investors have shifted to the war’s longer-term implications.
In this note we reflect on three such themes. First, we examine latent energy risk in the conventional EM benchmark and consider whether allocators should view it as a feature of a passive portfolio or as a flaw of an inherently active strategy that should inform benchmark selection or customization. Second, we explore whether the war might prompt deglobalization, a question that has drawn significant media interest. We suggest that reglobalization, in other words, a shift in globalization patterns, is a more likely outcome, and we consider what that might imply for EM investments. Finally, we consider the ubiquity of geopolitical risk in emerging markets and recall lessons from past research about managing shock events.*
Theme 1: Latent Energy Risk in the EM Benchmark—Feature or Flaw?
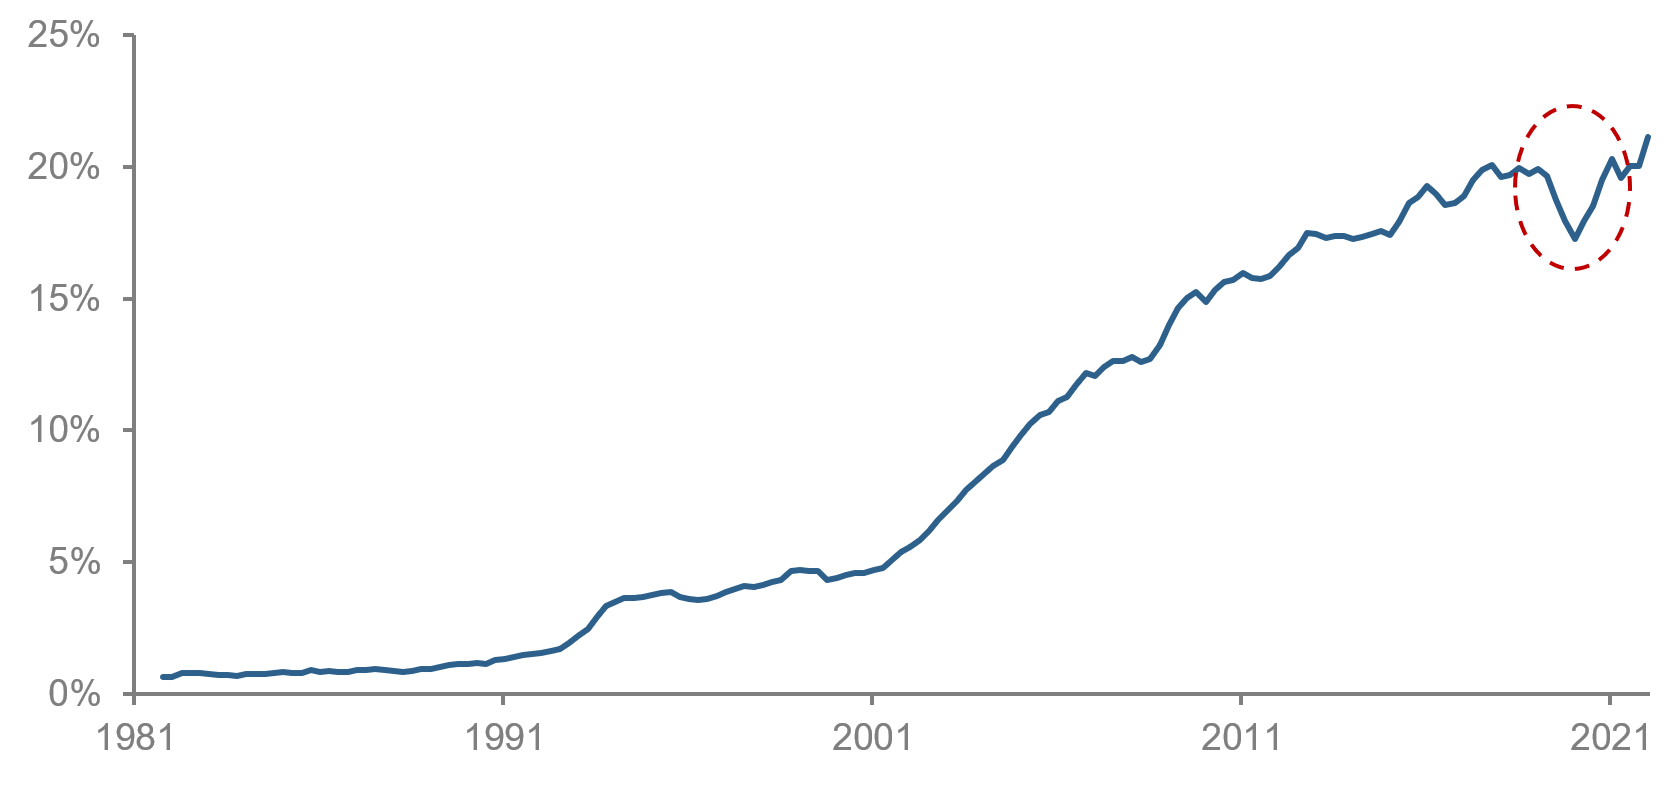
One striking aspect of the Ukraine crisis, from a markets perspective, is the contrast between the world’s financial exposure to Russia’s actions and the country’s small pre-crisis weight in benchmark equity indexes. Prior to the invasion, Russia’s weight in MSCI’s EM index was less than 4%, having fallen steadily for a decade. Figure 1 shows that Russia’s declining equity weight closely tracked the shrinkage of the energy sector. In other words, Russia essentially had become a proxy for a global energy bet.1
Figure 1: Weights in MSCI Emerging Markets Index: Russia and Energy
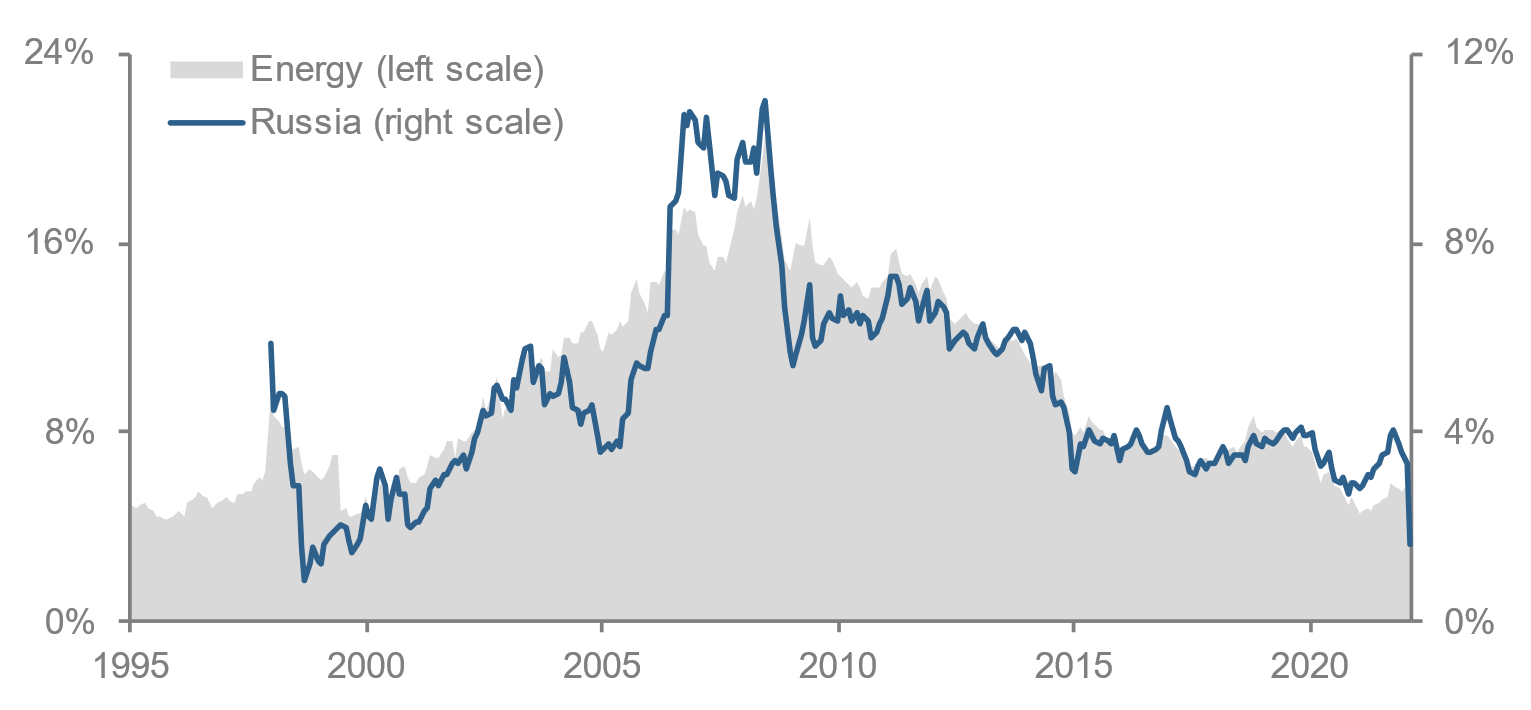
The energy sector’s diminished weight in the EM index (and elsewhere) resulted from several factors: new energy supply—the emergence of shale and resulting pressure on energy prices and CAPEX; dampened energy demand— subdued global growth even before COVID; and the post-Global Financial Crisis surge in technology-related growth stocks, which cannibalized weight from other sectors, including energy. For years prior to the war, the index’s growth-oriented flavor appealed to many EM investors.2
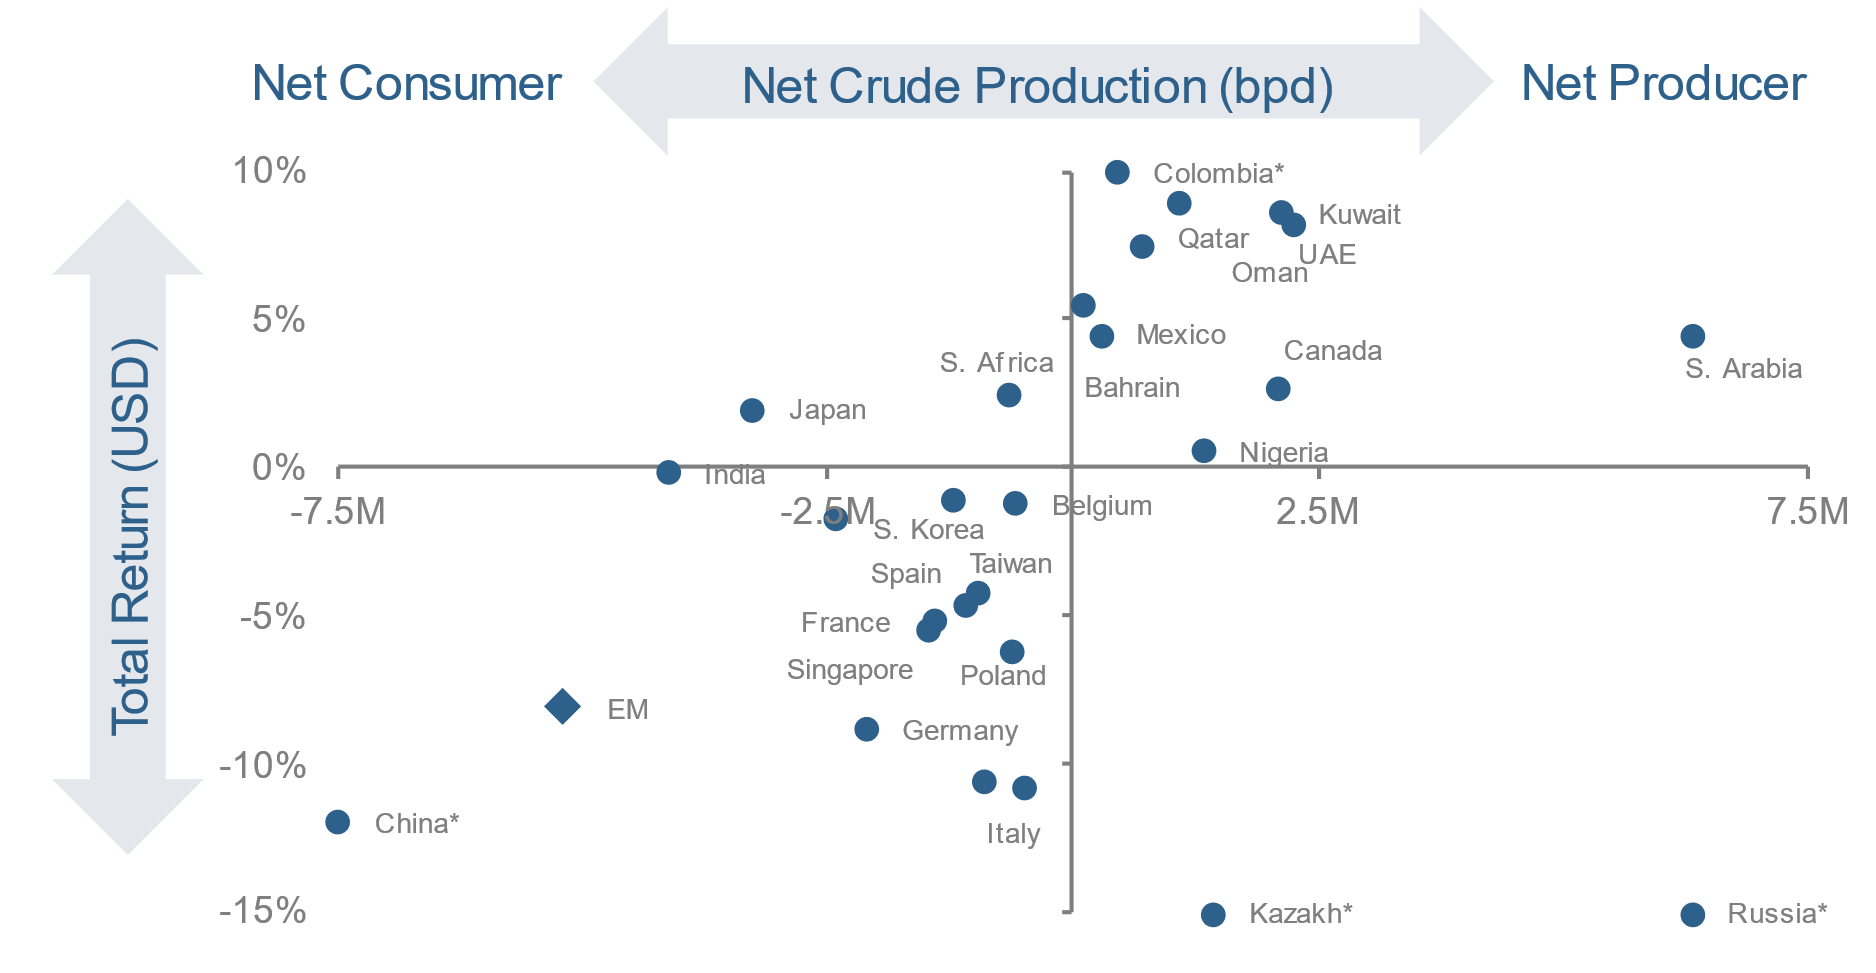
As a result, heading into the invasion, the EM index was vulnerable to an energy shock. Figure 2 shows that oil exposure largely sorted out initial winners and losers from the invasion. From mid-February to late-March, oil consumers suffered material losses, while producers enjoyed significant gains, in some cases approaching +/- 10%. Although the EM index includes some of the world’s largest net exporters of energy, including Saudi Arabia, UAE, Kuwait, and Mexico, their benchmark weights are small. The index is dominated by four large net-importers, China, South Korea, Taiwan, and India, which together accounted for 73% of the benchmark in January 2022. This imbalance contributed materially to the benchmark’s loss.
Figure 2: Post-Invasion Equity Market Performance—Selected Energy Producers and Consumers
16-Feb – 23-Mar-22
While the war exposed latent energy risk in the MSCI EM Index, did the diminished weight of the energy sector represent a flaw? In the abstract world of portfolio theory, the answer would be “no.” The weight of energy (or any other sector) in the canonical market portfolio wouldn’t be inappropriate, no matter how small. The market portfolio is on the efficient frontier, and it offers the highest risk-adjusted return available to long-only unlevered investors. The underlying exposures of that portfolio “are what they are.”
But in messy reality, the question isn’t so straightforward. Assumptions from theory don’t reflect how investors actually make decisions (e.g., they’re not pure mean-variance optimizers). Moreover, the EM benchmark hardly resembles the truly passive market portfolio. Instead, it represents the provider’s determination as to which countries and stocks warrant inclusion, with adjustments to the share base for accessibility, liquidity, and other considerations. These decisions are material, judgment-driven, and influenced by the interests of the provider’s licensees.
The wedge between theory and reality highlights that EM benchmark selection is a subjective call that reflects how well an index’s attributes map to those sought by an investor. From this perspective, the latent oil exposure in the benchmark can, indeed, be viewed as a flaw.
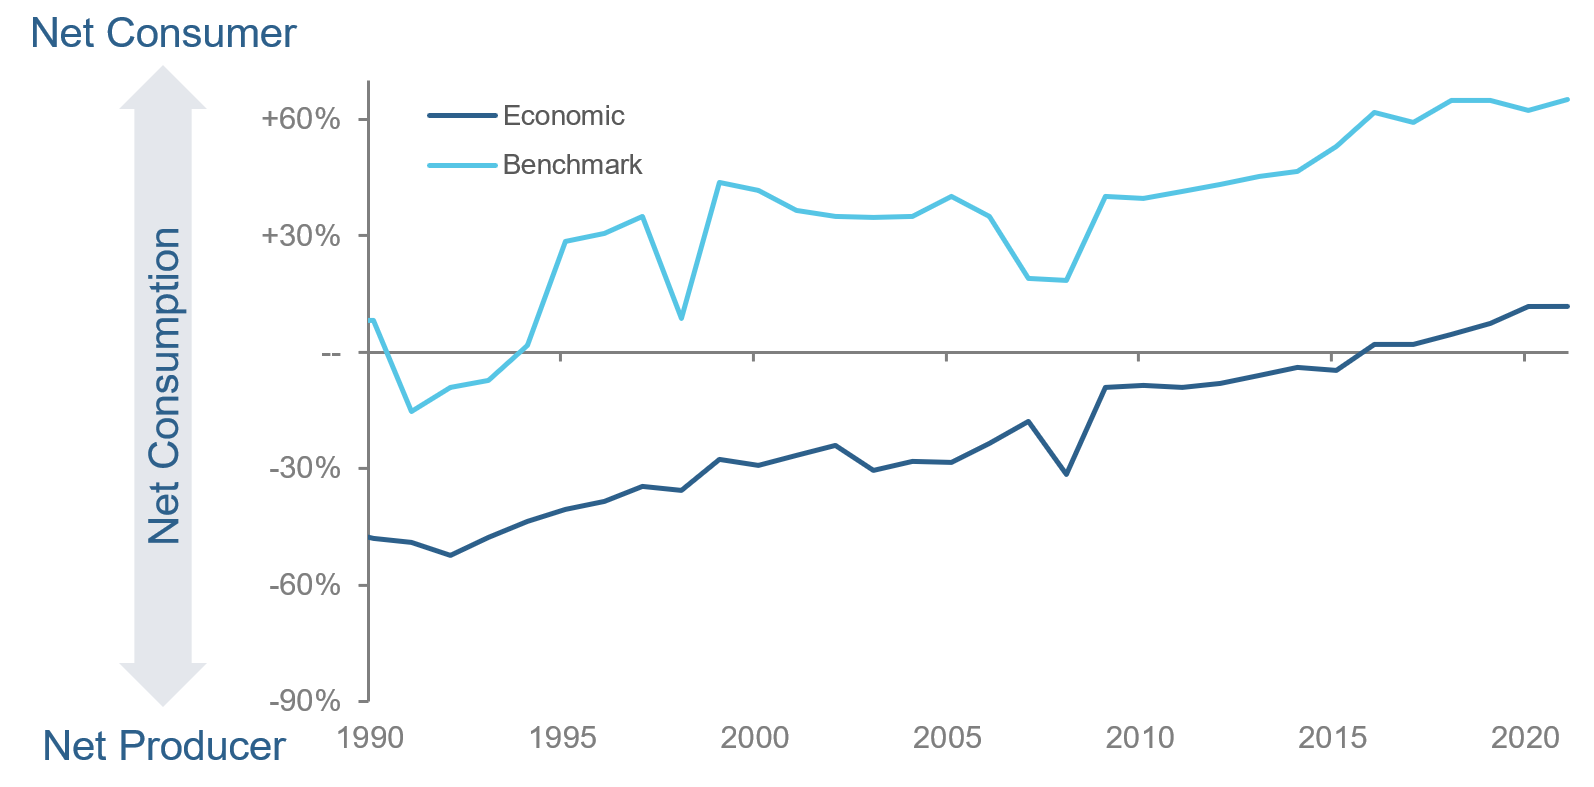
For example, the conventional benchmark was (and is), arguably, inappropriate for an investor seeking an index that reflects EM countries’ aggregate economic exposures. Figure 3 shows that the MSCI EM Index has exhibited a material oil consumption bias, in part because the eligible share bases of available publicly traded entities underrepresent national production.
Figure 3: EM’s Net Oil Production/Consumption—Cap-Weighted Index vs. Economic Perspectives
Moreover, the conventional index hasn’t consistently mapped well to the needs of investors who simply sought a well-diversified benchmark. Heading into 2022, the cap-weighted index was, in our view, manifestly distorted by market mis-valuation. As we discussed in prior research, a global one-factor bet on growth, fueled in part by overextrapolation of fundamentals and speculative excess in the post-COVID rebound, left the EM benchmark unusually concentrated in terms of sectors, countries, and even individual stocks.3 The index was also vulnerable to a reversal of those prior trends, including a rebound of the energy sector.
These reflections on post-invasion market behavior have several implications for EM investors. First, allocators should evaluate prospective benchmarks as active strategies, in and of themselves. No candidate EM benchmark should be adopted without scrutiny.
Second, relative to a potentially flawed benchmark, a fundamentally oriented active strategy may offer a more natural starting point for an allocation. Viewed through a systematic lens, for example, an alpha model with a valuation component can be viewed as providing guardrails against market-wide behavioral mistakes that a conventional benchmark might blindly inherit or even exacerbate, through ill-timed inclusion/exclusion decisions. In portfolio construction, an active strategy can also incorporate explicit constraints on energy or other exposures.
Third, if an active strategy managed around a traditional benchmark doesn’t provide sufficient flexibility to address latent risks, then a custom benchmark may provide a better starting point. Doing so might involve revisiting specific decisions made by the benchmark purveyor. It could also involve engineering baseline exposures to countries, sectors, or risk factors from scratch. While for many asset owners, customizing a benchmark is infeasible, going through the exercise of sketching out the ideal may nonetheless be instructive in understanding risk and interpreting performance of the conventional proxy.
Theme 2: Deglobalization or Reglobalization?
The outbreak of war brought speculation that Russia’s invasion might herald a phase of “deglobalization” with sanctions disrupting trade, supply chains in chaos, and democracies and autocracies splitting into blocs. Talk about deglobalization had been growing for years prior to the war, fueled by populist fervor, U.S. policy shifts, and worries over supply-chain vulnerabilities exacerbated by COVID. But what does the evidence suggest about the outlook for globalization in the post-invasion world?
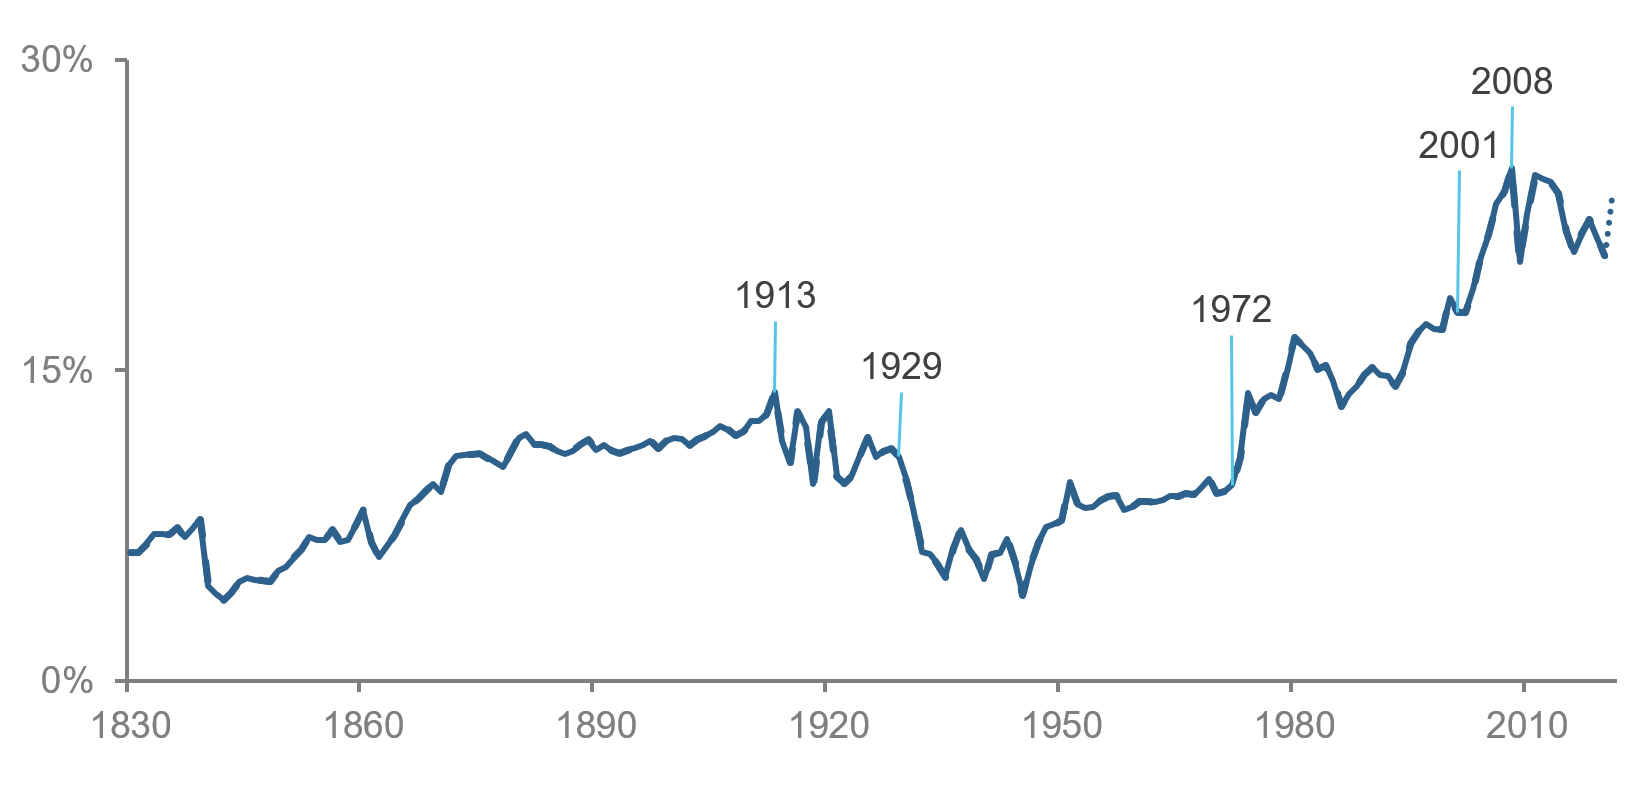
To begin with, long-term historical context offers valuable perspective. Figure 4 shows one standard measure of interconnectedness, global exports as a fraction of worldwide GDP, dating back to 1830. The chart documents a substantial increase in trade interconnectedness over time. It grew steadily for much of the 19th and 20th centuries, suggesting a natural tendency to globalize. Nevertheless, exports have never exceeded 25% of GDP, highlighting that economic activity remains domestically focused, in aggregate, and suggesting that both hopes and fears regarding the progress of globalism are often “greatly exaggerated.” In addition, the chart reveals a sharp and long-lasting reversal of globalization triggered by the Great Depression, amid waves of protectionism and other policy responses to the intense crisis.4
Figure 4: Global Trade Interconnectedness—Long-Term Context
Viewed in this longer-term context, the pre-invasion ebbing of globalization looks modest, especially relative to the tenor of anti-globalist rhetoric and predictions. Globalization’s robustness is a testament to its real economic benefits, and there are recent examples of how difficult it can be for stakeholders to retreat from it, even when motivated (or at least accompanied) by geostrategic concerns. The brief and modest impact of the Trump administration’s 2019 tariffs on China offers a case in point. Figure 5 shows that after only a minor retracement, U.S. imports from China rebounded rapidly, driven by the exigencies of COVID, the various policy responses to the pandemic, and the economic rebound from it.
Figure 5: U.S. Imports from China
Disposition of Russia’s oil in the first few months after the invasion offers additional clues regarding the longer-term outlook for globalization. By May, as some Western governments banned imports of Russian oil and many refiners voluntarily stopped buying it, Russian crude was trading $25-$35 below Brent. That discount drew buying interest from China and India, however, stabilizing relative prices.5 As a result, (most) Russian oil continues to flow somewhere, suggesting that the first order effect may be a supply rearrangement rather than a disruption.
Informed by that background, we see it as more likely that the invasion will alter globalization’s patterns than seriously damage it, i.e., reglobalization is more likely than deglobalization. That’s in part because the conflict is geostrategic in nature. Unlike the Cold War, it does not represent a direct ideological challenge to an economic system that has fostered trade interconnectedness. Moreover, while Russia might well become a client state of China, supplying it with energy and food and accentuating geostrategic polarity, China itself has become a major stakeholder in economic globalization. Through a 30-year program of investment and reforms, it has become a larger trade partner than the U.S. for more than three-fourths of the world’s countries.
Changes in globalization might well include intensification of trade within geostrategic blocs, motivated in part by security concerns. Even that isn’t a sure thing, however. In the years prior to COVID, the Trump administration’s rhetorical rejection of globalization spurred predictions that regionalization would fill the vacuum as the U.S. abandoned global economic leadership.6 Yet the data does not show a trend towards regionalization emerging prior to COVID.7 Moreover, while corporate interest in nearshoring supply chains spiked upon the outbreak of the pandemic, it quickly diminished.8 While there are challenges to globalization in respects other than trade, including threats to free information flows and human migration, we suspect that it would take catastrophic circumstances, such as a shooting war over Taiwan or a depression, to severely damage it.
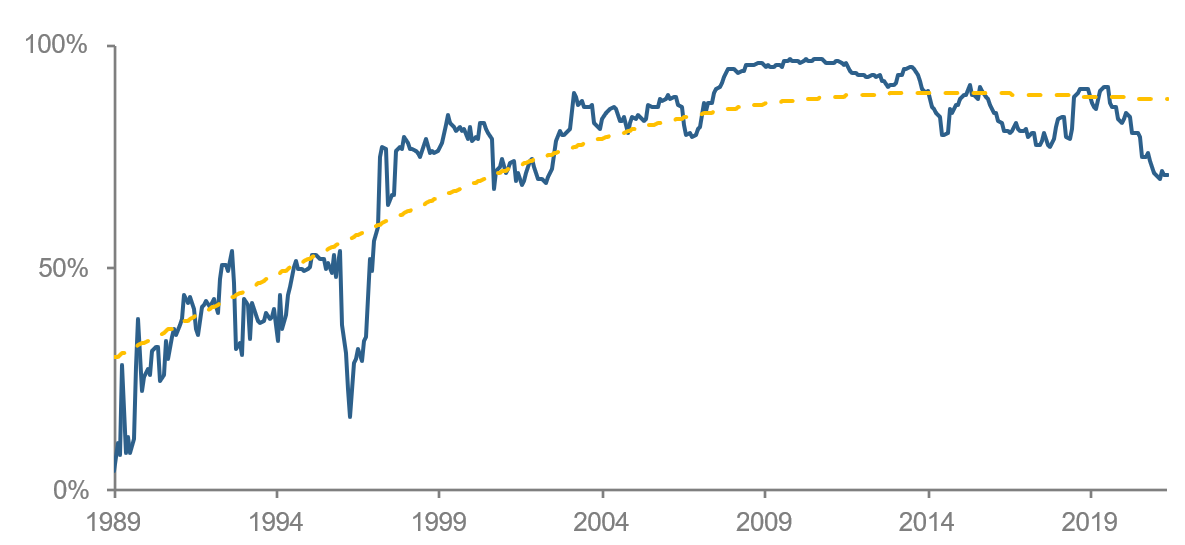
What are the implications for EM investors? As we pointed out in recent research, emerging market equities have, in aggregate, become highly integrated with global developed markets.9 (Figure 6) Given our view that economic globalization isn’t likely to break down, we don’t expect the war to herald a major decoupling of emerging equity markets. If so, then pursuing distinctiveness in EM allocations should remain a priority. That would suggest prioritizing onshore China as well as active EM strategies that are oriented towards extracting alpha from “local” EM stocks and avoiding strategies that focus on highly integrated EM market segments that would merely echo developed market investments.
Figure 6: Emerging Equity Markets—Integrated with DM
Adjusted R-Squareds from rolling 36M regressions of MSCI EM Index returns on 15 major DM country indexes
Although it’s impossible to forecast how reglobalization might play out, it might also further reshape the contours of EM. For example, one possibility would be that rising energy prices and interest in diversifying sources of supply could provide a path for the migration of some frontier energy producers to EM.
Theme 3: Managing Geopolitical Risk
Following the invasion, op-eds popped up in the financial media arguing that investors should have divested Russian stocks well prior to the invasion given what have been described as ESG-related concerns associated with the country.10 For EM investors, however, geopolitical risk is a fact of life, a common characteristic shared by an otherwise heterogeneous collection of countries. There is material risk of war associated with the four largest constituents of MSCI’s EM Index, China, Taiwan, South Korea, and India, which collectively comprise roughly 75% of the benchmark. Nine out of 24 countries rank in the bottom half of the entire world in terms of corruption (Figure 7). Even more of the countries rank poorly by various metrics of political stability and human rights.
Figure 7: Corruption in EM
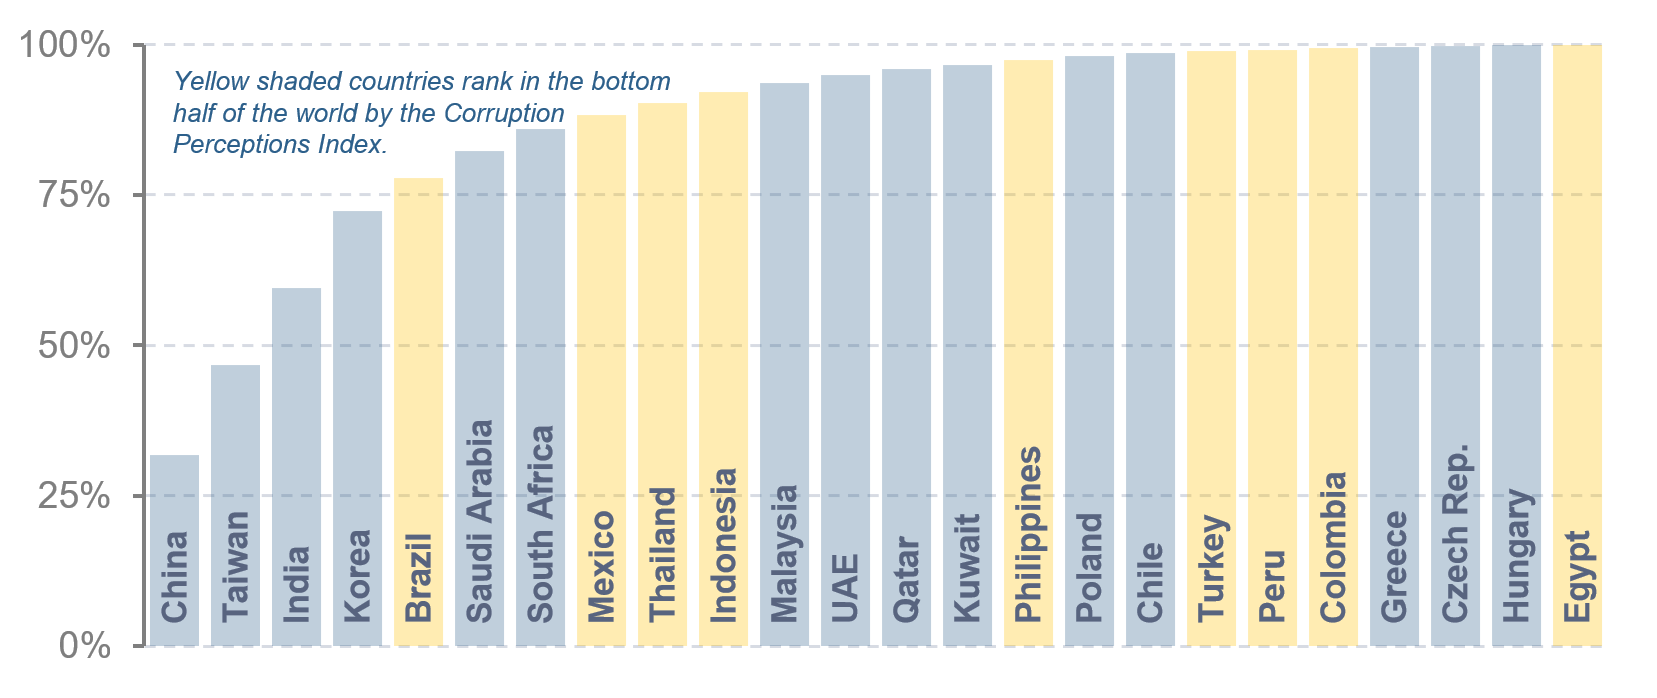
But the ubiquity of geopolitical risk in emerging countries does not detract from EM investing; in a real sense, it is central to the investment thesis. Geopolitical risk helps to explain why emerging economies are still emerging and may offer outsized opportunity for investors through broad allocations and/or stock selection. Yet the prevalence of geopolitical risk in EM puts a premium on its prudent management.
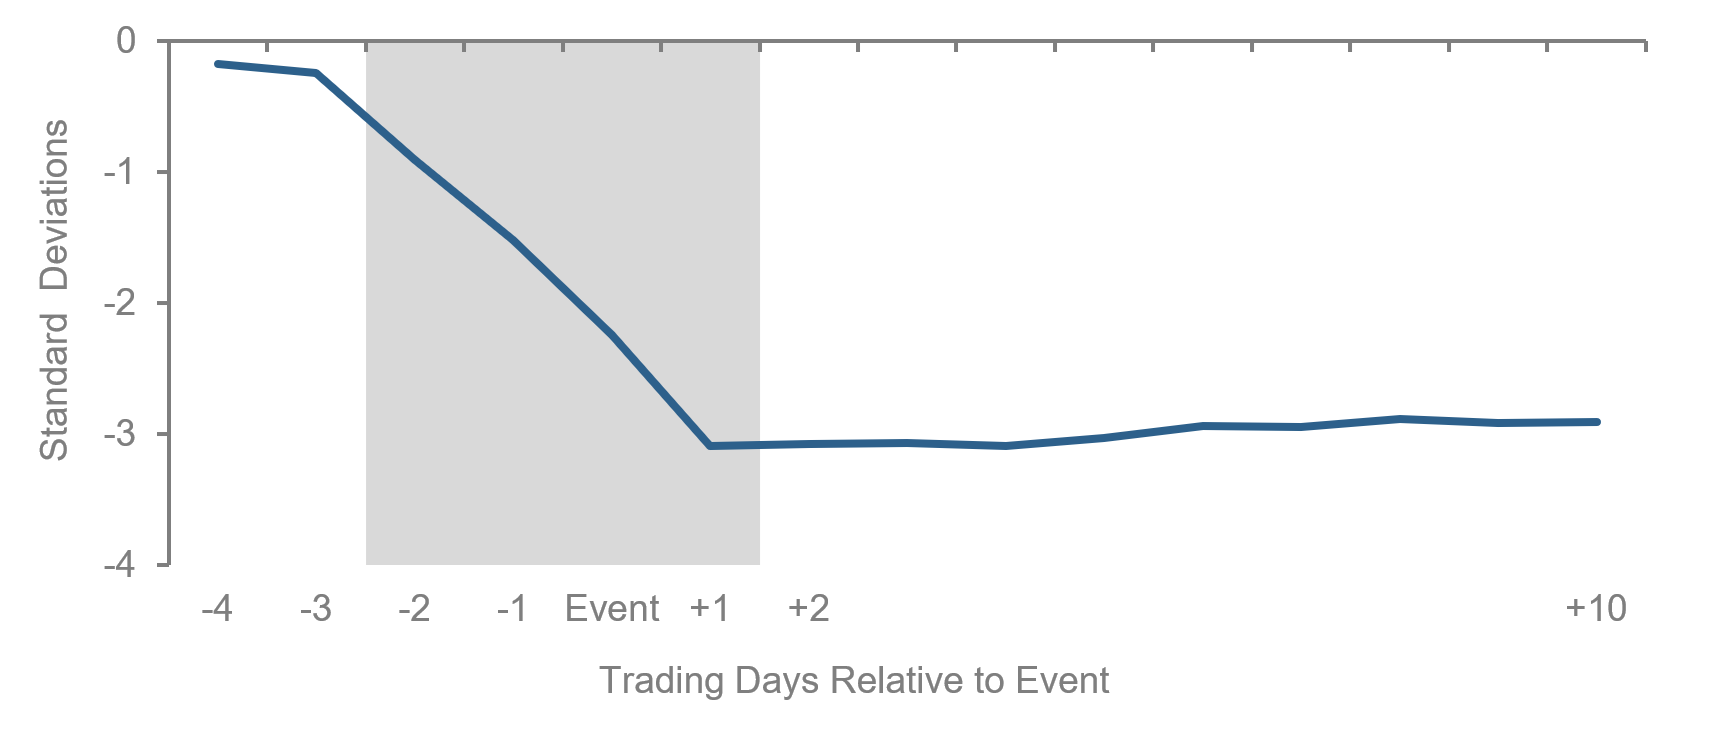
When shocks do occur, we believe that investors should neither panic nor reflexively double-down. Our prior research suggests that, on average, once a surprise event has hit the headlines, markets don’t drift lower, and there is only modest evidence of outsized risk-adjusted returns.11 (Figure 8) Without specific knowledge of the event, therefore, the best course of action may be to stay the course.
Figure 8: Local Market Reactions to “High Severity” Geopolitical Shocks
Cumulative Abnormal Excess Returns for Selected Geopolitical Events, 1931-2015
Instead of focusing on event response, therefore, we emphasize advance preparation. One evergreen best practice is diversification. Many instances of geopolitical risk are country-specific, such as China’s 2021 regulatory crackdown on high-profile platform companies, suggesting that they should be diversified away.12 Single-country investments and other narrow EM strategies can quickly cause buyer’s remorse in the event of a localized shock.
Another best practice is the incorporation of geopolitical risk directly into the alpha model. For example, geopolitical risk indicators may help to distinguish stocks or countries that are cheap for a reason from true mispricings.
A third best practice is to avoid relying solely on backwards-looking risk management tools. The unprecedented short squeeze in the nickel market that was triggered by the invasion is a reminder that geopolitical shocks have the potential to produce historically large market moves and unusual covariations.13 A risk management system driven solely by historically estimated relationships cannot instantly recalibrate to account for sudden and large shifts in the environment. Explicit limits on exposures to individual companies, countries, and sectors can help to protect against unanticipated shocks. In contexts where timing of an event is known in advance, scenario analysis that includes outcomes beyond those that have been observed in the past can lend robustness to preparation.
Conclusion
While it would be exceedingly difficult to predict how the Ukraine crisis will unfold, in this note we’ve highlighted what we see as three broad and lasting themes relevant to EM investors: 1) The active nature of EM benchmarks, as underscored by the latent energy risk in the highest-profile EM index; 2) the likelihood that economic globalization will persist, despite speculation that the war might trigger its reversal; and 3) the value of advance preparation in managing geopolitical event risk, given its ubiquity in EM. Analysis of the crisis’s implications is an ongoing exercise, however, and we’ll continue to monitor developments as conditions evolve.
* The authors thank Chappell Lawson of MIT’s political science department for informative conversations regarding the geostrategic context of the war and globalization.
Endnotes
- All the way back in 2014, John McCain famously described Russia as a “gas station masquerading as a country.”
- The recent Acadian Quick Take, “Navigating the EM Value Rotation,” June 2022, highlights the disparity in EM growth and value strategy flows.
- See “Polarizing Views: China’s Impact on EM Investing,” Acadian, December 2021.
- For interesting discussion of the evolution of protectionism in the Depression, see Barry Eichengreen and Douglas A. Irwin, “The Slide to Protectionism in the Great Depression: Who Succumbed and Why?”, NBER Working Paper 15142, July 2009.
- ”China and India buy more Russian oil, blunting Western sanctions: Both countries take advantage of discounts as buyers disappear,” Nikkei Asia, 8-Jun-22.
- See, for example, “From Globalization to Regionalization—Analysis,” YaleGlobal Online, Eurasia Review, 31-Oct-18.
- Steven A. Altman and Caroline R. Bastian, “DHL Global Connectedness Index 2021 Update: Globalization Shock and Recovery in the COVID-19 Crisis,” DHL in Partnership with NYU Stern School of Business.
- Ibid.
- See “Polarizing Views: China’s Impact on EM Investing,” Acadian, December 2021.
- See, for example, “ESG Investors Accused of ‘Failing’ over Russia,” Financial Times, 11-Mar-22.
- See "Geopolitical Shocks: What to Expect from the Unexpected," Acadian, 2017. The empirical results discussed here are not derived from wars, but rather from a broad selection of other types of shocks, including assassinations, coups, civil disruptions, industrial disasters, natural disasters, and epidemics.
- This argument assumes that price setters are globally diversified. In contexts where that is not the case, local geopolitical risk may be associated with a material returns premium. Please contact us to discuss further.
- Nickel futures prices surged 250% on the London Metals Exchange when hedgers who were short the contracts were not permitted to use their holdings of relatively impure nickel to settle their obligations, triggering an unprecedented short squeeze as they sought to cover their positions. LME nickel prices rose after the invasion amid concerns that Russian supplies of high purity nickel would be disrupted. See “Quick Take—Chaos in Nickel: Geopolitics Meets Market Microstructure,” Acadian, March 2022.
Legal Disclaimer
These materials provided herein may contain material, non-public information within the meaning of the United States Federal Securities Laws with respect to Acadian Asset Management LLC, Acadian Asset Management Inc. and/or their respective subsidiaries and affiliated entities. The recipient of these materials agrees that it will not use any confidential information that may be contained herein to execute or recommend transactions in securities. The recipient further acknowledges that it is aware that United States Federal and State securities laws prohibit any person or entity who has material, non-public information about a publicly-traded company from purchasing or selling securities of such company, or from communicating such information to any other person or entity under circumstances in which it is reasonably foreseeable that such person or entity is likely to sell or purchase such securities.
Acadian provides this material as a general overview of the firm, our processes and our investment capabilities. It has been provided for informational purposes only. It does not constitute or form part of any offer to issue or sell, or any solicitation of any offer to subscribe or to purchase, shares, units or other interests in investments that may be referred to herein and must not be construed as investment or financial product advice. Acadian has not considered any reader's financial situation, objective or needs in providing the relevant information.
The value of investments may fall as well as rise and you may not get back your original investment. Past performance is not necessarily a guide to future performance or returns. Acadian has taken all reasonable care to ensure that the information contained in this material is accurate at the time of its distribution, no representation or warranty, express or implied, is made as to the accuracy, reliability or completeness of such information.
This material contains privileged and confidential information and is intended only for the recipient/s. Any distribution, reproduction or other use of this presentation by recipients is strictly prohibited. If you are not the intended recipient and this presentation has been sent or passed on to you in error, please contact us immediately. Confidentiality and privilege are not lost by this presentation having been sent or passed on to you in error.
Acadian’s quantitative investment process is supported by extensive proprietary computer code. Acadian’s researchers, software developers, and IT teams follow a structured design, development, testing, change control, and review processes during the development of its systems and the implementation within our investment process. These controls and their effectiveness are subject to regular internal reviews, at least annual independent review by our SOC1 auditor. However, despite these extensive controls it is possible that errors may occur in coding and within the investment process, as is the case with any complex software or data-driven model, and no guarantee or warranty can be provided that any quantitative investment model is completely free of errors. Any such errors could have a negative impact on investment results. We have in place control systems and processes which are intended to identify in a timely manner any such errors which would have a material impact on the investment process.
Acadian Asset Management LLC has wholly owned affiliates located in London, Singapore, and Sydney. Pursuant to the terms of service level agreements with each affiliate, employees of Acadian Asset Management LLC may provide certain services on behalf of each affiliate and employees of each affiliate may provide certain administrative services, including marketing and client service, on behalf of Acadian Asset Management LLC.
Acadian Asset Management LLC is registered as an investment adviser with the U.S. Securities and Exchange Commission. Registration of an investment adviser does not imply any level of skill or training.
Acadian Asset Management (Singapore) Pte Ltd, (Registration Number: 199902125D) is licensed by the Monetary Authority of Singapore. It is also registered as an investment adviser with the U.S. Securities and Exchange Commission.
Acadian Asset Management (Australia) Limited (ABN 41 114 200 127) is the holder of Australian financial services license number 291872 ("AFSL"). It is also registered as an investment adviser with the U.S. Securities and Exchange Commission. Under the terms of its AFSL, Acadian Asset Management (Australia) Limited is limited to providing the financial services under its license to wholesale clients only. This marketing material is not to be provided to retail clients.
Acadian Asset Management (UK) Limited is authorized and regulated by the Financial Conduct Authority ('the FCA') and is a limited liability company incorporated in England and Wales with company number 05644066. Acadian Asset Management (UK) Limited will only make this material available to Professional Clients and Eligible Counterparties as defined by the FCA under the Markets in Financial Instruments Directive, or to Qualified Investors in Switzerland as defined in the Collective Investment Schemes Act, as applicable.
About the Authors