
Decarbonizing Equity Portfolios: A “Net Zero Glidepath” Solution
Key Takeaways
- We expect 2022 to be a year of intensifying calls for portfolio decarbonization from both asset owners and regulators. In this note, we consider how best to achieve such a goal.
- We show how decarbonization targets prescribed by the latest climate science can be translated into a dynamic constraint on total portfolio carbon exposure, i.e., a “Net Zero Glidepath.”
- We demonstrate how a systematic Net Zero Glidepath-based approach can meet material emissions-reduction targets while minimizing the impact on risk-reward characteristics.
Table of contents
Last year’s COP26 conference harnessed political and media attention towards the topic of climate change; unfortunately, it was not a catalyst for a great leap forward. While various governments pledged to eliminate net carbon emissions by 2050, phase out coal-fueled power plants, and reverse deforestation, there was also disappointment that the agreement’s language was watered down. Even if nations honor their pledges—not something in which we are confident—the International Energy Agency (IEA) anticipates that global warming would only be held to 1.8°C above pre-industrial levels. Clearly, there is still a long way to go if the planet is to avoid the worst effects of climate change. Individuals, governments, and companies must all act to ensure deep and rapid emissions reductions, and so must the global investment community.
In this note, therefore, we examine how asset managers can help investors promote the fight against climate change by decarbonizing their portfolios. Specifically, we propose a dynamic “Glidepath” for reducing portfolio carbon emissions exposure that is both aligned with Net Zero goals and designed to minimize the impact on financial performance. We compare this approach to 1) a Base Case active equity strategy that incorporates climate and other ESG-based signals but has no explicit controls on carbon exposure, and 2) divestment, a more prevalent but cruder method of decarbonization. We close by linking the Net Zero Glidepath with our approach to Engagement.
What is Net Zero?
In the run-up to COP26, the Intergovernmental Panel on Climate Change (IPCC) published its Sixth Assessment Report, a 4,000-page, comprehensive review of the latest climate science. The IPCC report warns that the global surface temperature has already risen by 1.1°C compared to the pre-industrial era and suggests a remaining carbon budget of 420 GtCO2 (gigatonnes of carbon dioxide) for a two-thirds chance of limiting warming to 1.5°C. To put this into context, global emissions from burning fossil fuels, industrial processes, and land-use change have continued to grow, for years exceeding 40 GtCO2 per annum (Figure 1). According to the report, halting the rise in global average temperatures requires a transition to Net Zero, which will require a dramatic reduction of emissions from human activity as well as the removal of emissions from the atmosphere.1 A stark conclusion from the IPCC’s report is that global carbon emissions must be cut by 50% between 2020 and 2030.
Figure 1: The Urgency of Emissions Reductions
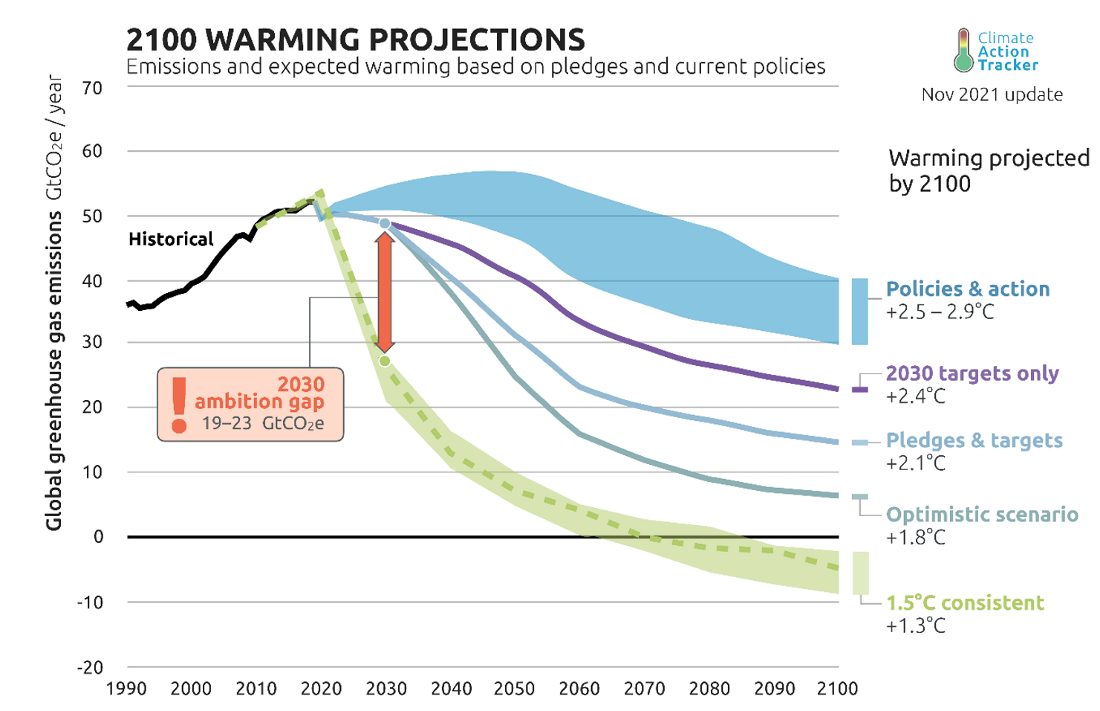
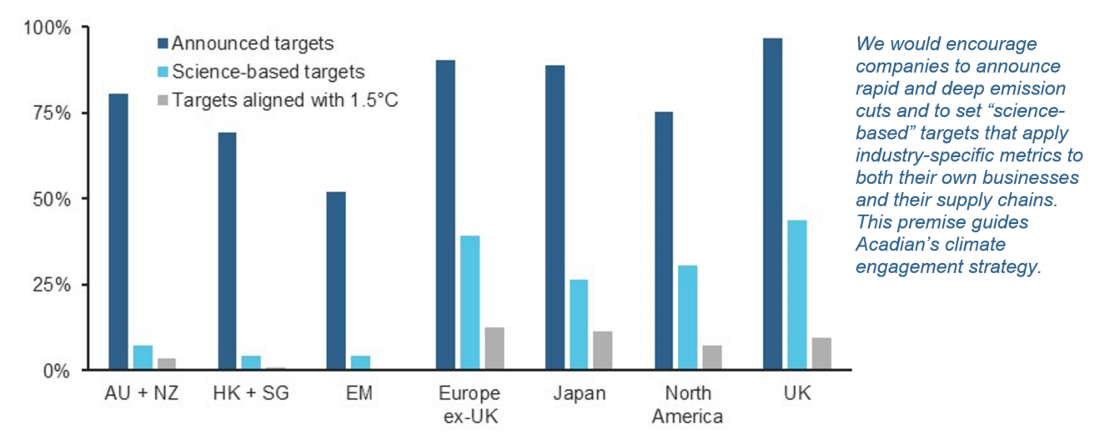
Figure 1 presents a sobering perspective on the task ahead. The emissions trajectory consistent with the 1.5°C temperature rise—the Net Zero path in Green—would require an immediate and drastic cut. The current set of government pledges and targets would be far from sufficient, even if we make the questionable assumption that governments will live up to their rhetoric. We see a similarly daunting picture at the company level. While Figure 2 shows that a large proportion of companies have announced decarbonization plans, only a few are actually aligned with a +1.5°C pathway. In North America, for instance, while 75% of companies by market-cap weight have emissions targets (dark blue bar), the Science-Based Targets Initiative (SBTi) views only 30% of them as credible and accurate (light blue bar).2 MSCI produces an even more skeptical assessment, putting the fraction consistent with a +1.5°C warming trajectory at roughly 7% (grey bar).
Figure 2: Percentage of Companies that Have Pledged to Reduce their Carbon Footprints
Comparing Decarbonization Approaches: A Case Study
So how can investors decarbonize their portfolios? There are several available approaches, but they vary in the extent and robustness of their emissions reductions as well as in their impact on portfolio financial characteristics. To help investors understand key points of differentiation, we present a case study involving a developed markets equity portfolio benchmarked to MSCI World.
As a Base Case, we consider a hypothetical active strategy that maximizes risk-adjusted returns using Acadian’s proprietary bottom-up and top-down forecasting signals and portfolio construction methods. It does not incorporate any fossil fuel exclusions or decarbonization tilts. Although Acadian’s core alpha model directly integrates company-level carbon transition risk into its stock return forecasts, we expect that the Base Case portfolio will, at times, have climate characteristics that are less appealing than the benchmark’s. That’s because its active positioning will also reflect myriad purely financial, social, and governance signals contained in the return forecasting model, as well as risk management considerations and projected implementation costs.
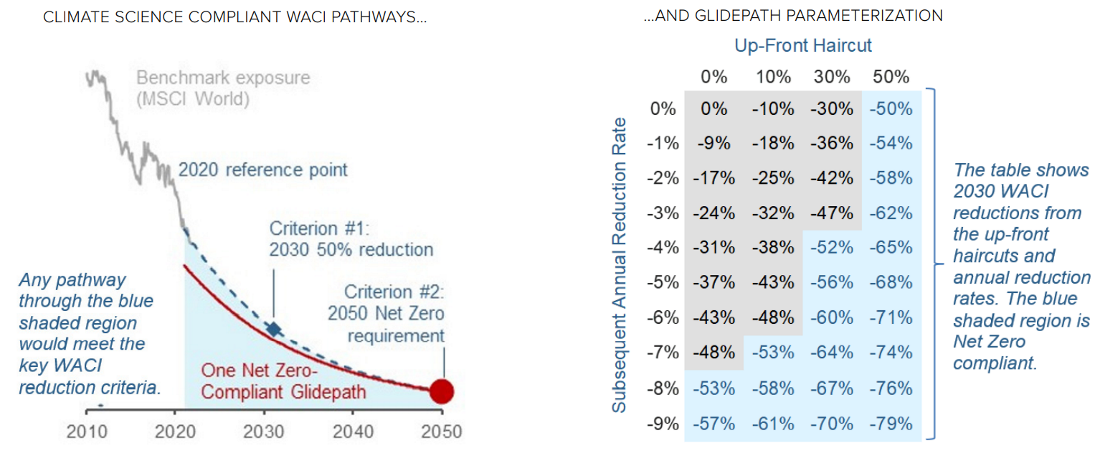
So, in order to align this hypothetical active strategy with climate science recommendations, we implement a “Net Zero Glidepath” solution. Specifically, we target reducing the portfolio’s carbon intensity dynamically over time to meet two key criteria: 1) a 50% decrease in 2030 portfolio carbon exposure relative to 2020 benchmark levels, and 2) further reductions to levels that by 2050 would be aligned with Net Zero. While we have chosen Weighted Average Carbon Intensity (WACI)—scope 1 + 2 emissions divided by sales3 — as the basis for this illustrative case study, our recent implementations for clients have extended to other candidate carbon metrics, including weighted total emissions and the carbon footprint, which normalizes emissions using Enterprise Value Including Cash (EVIC).
These two criteria noted above still do not fully specify any WACI glidepath, however. In fact, in the chart in Figure 3, any pathway through the blue shaded region would be compliant. To complete the glidepath specification, therefore, we set two parameters: 1) an up-front WACI haircut, i.e., an immediate reduction in portfolio WACI relative the benchmark’s 2020 level, and 2) a percentage decarbonization rate that over subsequent years defines a smooth upper bound for WACI. The blue shaded area of the table in Figure 3 shows Net Zero-compliant combinations of these two parameters, illustrating that there are many ways to achieve the required result. The red trace in the chart illustrates one of them.
Figure 3: Specifying a Net-Zero Glidepath
The balance between the size of the up-front haircut and speed of subsequent declines is up to investors. It should depend on their sense of urgency regarding their desire for aggressive climate action and their tolerance for its potential impact on portfolio positioning and financial performance. That said, we believe that material up-front haircuts can send valuable signals to the rest of the investing community, companies, consumers, and governments regarding the importance of material and rapid cuts towards Net Zero. Moreover, while the WACI of the Developed Markets (DM) benchmark decreased considerably from 2010 until quite recently (as is evident in Figure 3), the decline was materially attributable to the index’s changing composition. The weight of high-polluting sectors, including energy and materials, shrank as lower carbon technology-oriented companies outperformed. In our view, both the observed trajectory of aggregate corporate emissions and the dearth of science-based, credible emissions reduction pledges provide strong evidence that aggressive investor action is warranted.
To complete the Glidepath specification, we add an additional control to regulate how the portfolio-level target is achieved. We impose the portfolio-level WACI constraint on each of the three most carbon-intensive sectors: energy, materials, and utilities. Doing so enforces some balance in terms of how the portfolio construction mechanism sources portfolio WACI reductions with the aim of selecting more carbon-efficient companies from within these sectors. We see this control as consistent with most investors’ decarbonization objectives, and it reduces “concentration risk” in generating portfolio emissions reductions.
While the Glidepath has appealing intuition, simpler exclusionary approaches to decarbonization are far more common. Therefore, we compare the Net Zero Glidepath to an implementation of divestment that excludes from the Base Case portfolio companies that are either unable or unwilling to transition to a low-carbon economy. While divestment is simple in form, for this case study we apply rich criteria to identify climate laggards, including revenue thresholds for fossil fuel activities as well as forward-looking assessments of companies’ commitments to decarbonization.4 This refined implementation—”Selective Divestment”—allows for maintaining positions in high-emitting companies that are making strides to change their climate profiles.5 Doing so would provide a manager the opportunity to remain engaged with companies that have shown a reasonable propensity to transition, including high emitters that also operate renewable energy businesses.
One potential advantage of Selective Divestment relative to the Glidepath is that the former can ensure the exclusion of specific companies that are significant emitters, regardless of their other virtues. The Glidepath solution may include such firms, for example, if their expected return or risk characteristics are sufficiently attractive, as long as the portfolio-level carbon constraint is met. However, for investors who cannot tolerate holding certain companies, we can augment the portfolio Glidepath solution with an exclusion list.6
Results
To better understand the Net Zero Glidepath solution, we examine the impact of imposing portfolio-level WACI constraints on the hypothetical Base Case strategy from 2010 through October 2021. Specifically, we apply restrictions that range between capping the active strategy’s WACI at the benchmark’s then-current level and enforcing quite significant relative reductions of up to -70%. Comparing results as we tighten the constraint provides insight into the potential impact of 1) choosing a more aggressive decarbonization Glidepath (e.g., a large initial haircut) and 2) adhering to a pre-set Glidepath if benchmark emissions do not fall or perhaps even rise going forward.
Carbon Reduction
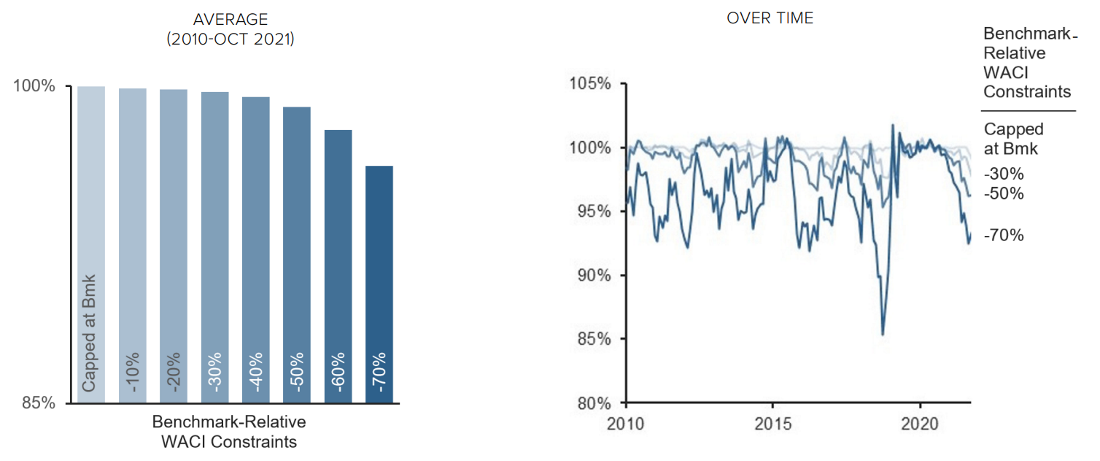
We first examine efficacy with respect to decarbonization. The left panel of Figure 4 shows that on average over the sample period, even the Base Case Acadian active strategy’s WACI is 15% below that of the benchmark. This reduction partly reflects the integration of climate transition risk into our stock selection model, which is designed to reduce the appeal of high emitters.
Figure 4: Hypothetical Impact on WACI—Selected Decarbonization Approaches
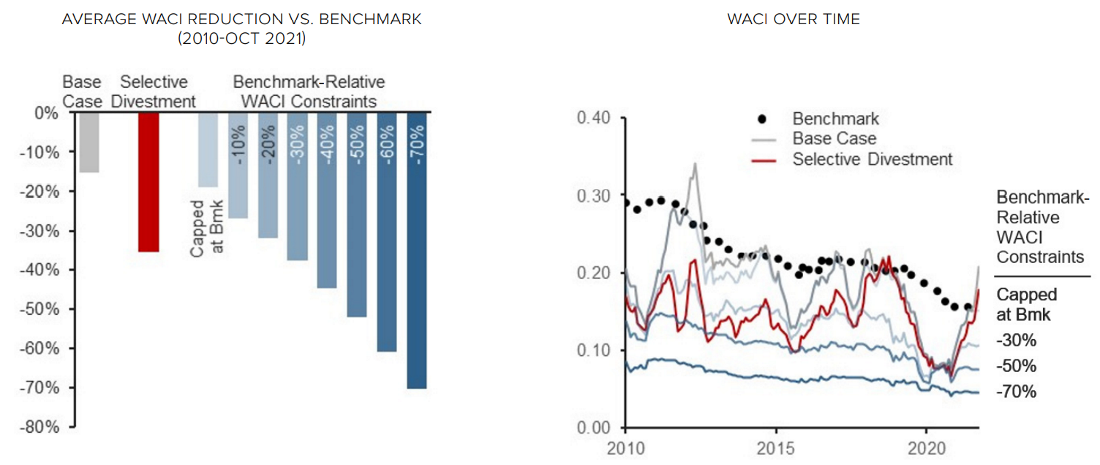
But the right panel shows that the Base Case WACI is quite erratic. There are even a few intervals during which it rises above the benchmark (one of them in 2021). Such periods occur when bottom-up or top-down signals that have nothing to do with climate change—including other aspects of ESG—indicate that carbon-intensive companies are financially attractive enough to warrant an overweight. The presence of such episodes highlights the importance of taking deliberate action to reduce portfolio carbon exposure.
With that in mind, the left chart in Figure 4 shows that Selective Divestment would have produced a significantly larger average reduction in WACI over the sample period, 36%. Like the Base Case, however, the right chart shows that the reduction is unreliable; it sometimes entirely disappears. This highlights the shortcomings of controlling total portfolio emissions entirely via a bottom-up, company-level approach. Even with the intention of reducing future emissions, firms operating within carbon-intensive but harder-to-transition industries such as aviation or heavy industry (e.g., steel and cement production) will largely rely on technology that is yet to be developed at scale. Exposure to these companies will continue to contribute to a portfolio’s carbon exposure, at least in the short term.
In contrast to both the Base Case and Selective Divestment, the Net Zero Glidepath reliably delivers sought-after reductions in benchmark-relative carbon exposure, regardless of their aggressiveness. When the required decreases are modest, e.g., -30% or less, the constrained portfolios deliver average reductions that exceed the targets (left chart). The explanation is that there are several periods in which the loose restrictions are not “binding”—they do not come into play because the alpha model naturally drives the (unconstrained) strategy into sufficiently low-emitting stocks. Nevertheless, consistently achieving even the modest reductions requires the explicit constraint.
Moreover, as we tighten the WACI constraint to -50% or -70%, the delivered reductions on average meet but no longer exceed the targets (left chart), and they also become much more stable over time (right chart). This shows that the more aggressive WACI constraints bind—in other words, they are necessary—throughout the entire sample period. This further highlights: 1) the need for deliberate and aggressive action to deliver the carbon reductions called for by climate science, and 2) the importance of portfolio-level restrictions on carbon exposure, like those embedded in the Glidepath solution, in achieving such goals.
Financial Impact
Not only does the Net Zero Glidepath do a better job of ensuring the requisite carbon reduction, but under most conditions it does so with little impact on average ex-ante active return over the sample period.7 This is shown in the left panel of Figure 5. Until the Glidepath requires a benchmark-relative cut of -30%, the reduction in ex-ante alpha is de minimis, and even at the -50% level called for by the 2030 climate science target, the average loss is only 1%.
Figure 5: Hypothetical Ex-Ante Alpha as Pct. of Base Case—Benchmark-Relative WACI Constraints
But the average loss of alpha would grow more material if an investor were to select, or if rising levels of corporate emissions were to require, an even more aggressive benchmark-relative control on WACI, e.g., -70%. Moreover, the right panel shows that there are times during the sample period where the impact on alpha is more material, 5% or more. In a future period, if more intense emitters look appealing from a financial perspective, the potential impact of decarbonization could be greater. Those results highlight the value of applying sophisticated portfolio construction and a broad investment universe to deliberately manage the potential financial impact of carbon restrictions that reliably achieve climate science recommendations.
To see why, we compare how the different hypothetical strategies achieve carbon reductions. Looking first at the Base Case point of departure, the left panel of Figure 6 reveals that most of its benchmark-relative carbon reduction derives from a reallocation across sectors. It turns out that this positioning largely results from an underweight in utilities, which reflects what amounts to a top-down call on the sector’s relative appeal. In comparison, Selective Divestment achieves a somewhat larger fraction of its carbon reduction (in both relative and absolute terms) from stock selection, which highlights the benefits of the refinements that we employ to identify carbon-efficient companies within sectors.
Nevertheless, the Glidepath specification derives even larger WACI reductions from stock selection. In fact, the proportional contribution from stock selection initially grows as we tighten the constraint. A particularly impressive example of carbon reductions achieved through stock selection comes from the materials sector. The right panel shows that as the constraint is tightened to -50%, the Glidepath-aligned strategy sometimes exceeds the targeted WACI reduction from materials even as the sector is assigned an overweight relative to the benchmark. Nevertheless, while the Glidepath makes efficient use of stock selection to meet carbon reduction goals, returning to the left panel of Figure 6, we see that as the desired/required carbon reductions grow more aggressive, -50% or more, the process starts to lean harder on sector reallocation.
Figure 6: Hypothetical Sources of WACI Reductions–Sector Allocation Versus Stock Selection
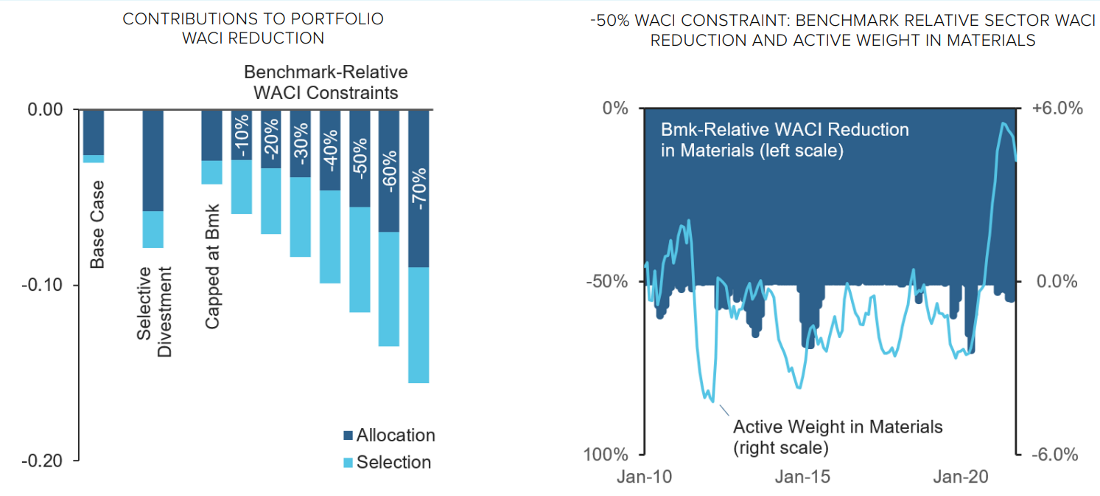
In summary, this analysis shows that the Net Zero Glidepath solution allows the sophisticated portfolio construction process to better exploit all avenues for decarbonization—both within and across sectors, consistent with both bottom-up and top-down return forecasts—than approaches that rely on either sectoral reallocations or stock-specific exclusions. This should provide for more attractive and robust outcomes with respect to both climate and financial objectives.
Impact and Engagement
From an impact perspective, we believe that investors can send a valuable signal to emitters, other investors, consumers, and governments by decarbonizing their portfolios. Yet we do not think that aligning portfolios with Net Zero targets would, in and of itself, prompt emissions reductions sufficient to limit the rise in global temperatures. That recognition helps to motivate our corporate engagement strategy, which is aimed at directly promoting material change by the companies in which we invest.
When it comes to engagement, systematic investing lends itself to a unique paradigm that leverages the breadth of our 40,000-stock global investment universe and our expertise in alternative data. Specifically, we have created an AI-based ESG data analysis platform (ENGAGER) to guide our engagement activities. The system processes a broad range of quantitative information, including data related to CO2 emissions, and it employs natural language processing tools to gauge confidence in company disclosures on ESG-related topics. Doing so provides a disciplined and high-breadth process to distinguish reality from rhetoric. This process informs how we prioritize our engagement activities and, therefore, helps us maximize our contribution to the campaign for global decarbonization. We embrace the obligation to act as a responsible and proactive steward of the assets that we manage, and this innovative system represents one aspect of our commitment to doing so.
Conclusion
The latest climate science underscores the urgent need for aggressive action to reduce global emissions. For concerned asset owners, the dynamic Glidepath strategy discussed in this note offers a disciplined approach to meeting Net Zero emissions exposure criteria while minimizing the impact on financial performance. The historical analysis provided highlights the value of the explicit and aggressive portfolio-level carbon intensity constraint in achieving the necessary reductions. It also highlights the flexibility that the Glidepath approach affords to extract emissions reductions from stock selection instead of relying more heavily on sector-level reallocations, as conventional exclusionary approaches tend to do. While the case study explores the benefits of a Glidepath approach based on WACI and in the context of a DM-benchmarked portfolio, we can apply it to other carbon metrics and contexts as well.
Nevertheless, while portfolio decarbonization offers investors a valuable way to signal to emitters that they care about fighting climate change, prompting the actual company-level reductions called for by contemporary climate science will require ongoing monitoring and engagement. Systematic investing approaches have a unique role to play in aiding that campaign, and we would welcome discussions with investors eager to learn more about it.
| |
Endnotes
- Removing greenhouse gases can be achieved through natural solutions such as reforestation and land management changes that increase the amount of carbon sequestered into soil. Negative emissions technologies include Direct Air Capture and Bioenergy with Carbon Capture and Storage. Such technologies have not yet been proven at scale, however. Moreover, they may be expensive and energy-intensive, and they may produce undesirable side effects. The reality is that there is no silver bullet to reach Net Zero.
- SBTi is an organization that examines published emissions targets on a company-by-company basis and assesses their practical significance in relation to a Net Zero path.
- This definition is advocated by the Task Force on Climate-Related Financial Disclosures (TCFD) framework.
- We apply revenue thresholds to thermal coal mining, artic drilling, as well as less conventional oil & gas operations. We source assessments of carbon reduction commitments from the Transition Pathway Initiative (TPI), which is a global asset-owner led initiative that assesses companies’ preparedness for transition to a low carbon economy. The resulting exclusions would, as of September 2021, eliminate 33 companies that represent 1.1% of MSCI World by weight.
- Among the advantages, this implementation recognizes that high carbon emitters often also operate renewable energy businesses.
- Please contact us to discuss in further detail.
- Given the risk-controlled nature of our portfolio construction process, we see even less impact of the increasing carbon constraints on the portfolios’ active risk exposure.
Hypothetical Legal Disclaimer
The hypothetical examples provided in this presentation are provided as illustrative examples only. Hypothetical performance results have many inherent limitations, some of which are described below. No representation is being made that any account will or is likely to achieve profits or losses similar to those shown. In fact, there are frequently sharp differences between hypothetical performance results and the actual performance results subsequently achieved by any particular trading program.
One of the limitations of hypothetical performance results is that they are generally prepared with the benefit of hindsight. In addition, hypothetical trading does not involve financial risk, and no hypothetical trading record can completely account for the impact of financial risk in actual trading. For example, the ability to withstand losses or to adhere to a particular trading program in spite of trading losses are material points which can also adversely affect actual trading results. There are numerous other factors related to the markets in general or to the implementation of any specific trading program which cannot be fully accounted for in the preparation of hypothetical performance results and all of which can adversely affect actual trading results.
General Disclaimer
These materials provided herein may contain material, non-public information within the meaning of the United States Federal Securities Laws with respect to Acadian Asset Management LLC, BrightSphere Investment Group Inc. and/or their respective subsidiaries and affiliated entities. The recipient of these materials agrees that it will not use any confidential information that may be contained herein to execute or recommend transactions in securities. The recipient further acknowledges that it is aware that United States Federal and State securities laws prohibit any person or entity who has material, non-public information about a publicly-traded company from purchasing or selling securities of such company, or from communicating such information to any other person or entity under circumstances in which it is reasonably foreseeable that such person or entity is likely to sell or purchase such securities.
Acadian provides this material as a general overview of the firm, our processes and our investment capabilities. It has been provided for informational purposes only. It does not constitute or form part of any offer to issue or sell, or any solicitation of any offer to subscribe or to purchase, shares, units or other interests in investments that may be referred to herein and must not be construed as investment or financial product advice. Acadian has not considered any reader's financial situation, objective or needs in providing the relevant information.
The value of investments may fall as well as rise and you may not get back your original investment. Past performance is not necessarily a guide to future performance or returns. Acadian has taken all reasonable care to ensure that the information contained in this material is accurate at the time of its distribution, no representation or warranty, express or implied, is made as to the accuracy, reliability or completeness of such information.
This material contains privileged and confidential information and is intended only for the recipient/s. Any distribution, reproduction or other use of this presentation by recipients is strictly prohibited. If you are not the intended recipient and this presentation has been sent or passed on to you in error, please contact us immediately. Confidentiality and privilege are not lost by this presentation having been sent or passed on to you in error.
Acadian’s quantitative investment process is supported by extensive proprietary computer code. Acadian’s researchers, software developers, and IT teams follow a structured design, development, testing, change control, and review processes during the development of its systems and the implementation within our investment process. These controls and their effectiveness are subject to regular internal reviews, at least annual independent review by our SOC1 auditor. However, despite these extensive controls it is possible that errors may occur in coding and within the investment process, as is the case with any complex software or data-driven model, and no guarantee or warranty can be provided that any quantitative investment model is completely free of errors. Any such errors could have a negative impact on investment results. We have in place control systems and processes which are intended to identify in a timely manner any such errors which would have a material impact on the investment process.
Acadian Asset Management LLC has wholly owned affiliates located in London, Singapore, and Sydney. Pursuant to the terms of service level agreements with each affiliate, employees of Acadian Asset Management LLC may provide certain services on behalf of each affiliate and employees of each affiliate may provide certain administrative services, including marketing and client service, on behalf of Acadian Asset Management LLC.
Acadian Asset Management LLC is registered as an investment adviser with the U.S. Securities and Exchange Commission. Registration of an investment adviser does not imply any level of skill or training.
Acadian Asset Management (Singapore) Pte Ltd, (Registration Number: 199902125D) is licensed by the Monetary Authority of Singapore. It is also registered as an investment adviser with the U.S. Securities and Exchange Commission.
Acadian Asset Management (Australia) Limited (ABN 41 114 200 127) is the holder of Australian financial services license number 291872 ("AFSL"). It is also registered as an investment adviser with the U.S. Securities and Exchange Commission. Under the terms of its AFSL, Acadian Asset Management (Australia) Limited is limited to providing the financial services under its license to wholesale clients only. This marketing material is not to be provided to retail clients.
Acadian Asset Management (UK) Limited is authorized and regulated by the Financial Conduct Authority ('the FCA') and is a limited liability company incorporated in England and Wales with company number 05644066. Acadian Asset Management (UK) Limited will only make this material available to Professional Clients and Eligible Counterparties as defined by the FCA under the Markets in Financial Instruments Directive, or to Qualified Investors in Switzerland as defined in the Collective Investment Schemes Act, as applicable.