
The Evolution of Value
-
“Value” is a term that encompasses multiple economic concepts; it is implemented through a variety of formulations that may induce meaningfully different exposures and, in turn, heterogeneity in performance.
-
Discussions of value’s performance would benefit from greater clarity regarding how value is being defined.
-
Value signals shouldn’t be thought of as immutable; they should evolve with changes in industry structures, management practices, and financial reporting.
Introduction
Value performance has been a recurrent topic of discussion in the financial media, with some stories even questioning the relevance of value as an investment approach. Many accounts implicitly treat value as a one-dimensional concept that is easily measured by ratios straightforwardly derived from balance sheet and income statement information. In our view, this represents a meaningful oversimplification that muddles discussion and confuses perceptions about value performance.
To start with, widely used value metrics reflect multiple economic concepts. For example, a high book-to-price ratio, in isolation, might reflect a relative underpricing attributable to overextrapolation of a growth stock’s fundamentals or indicate a company in distress. Sensibly, numerous value factor constructions have been developed in hopes of distinguishing companies with desirable characteristics and avoiding so-called “value traps.” These varying constructions can translate into materially different risk and return profiles. Figure 1 illustrates this point by depicting the post-GFC dispersion in performance between four different MSCI value benchmarks. There is typically a 5% differential in best-versus-worst returns among even just these four indexes.
Figure 1: MSCI Value Return Spreads
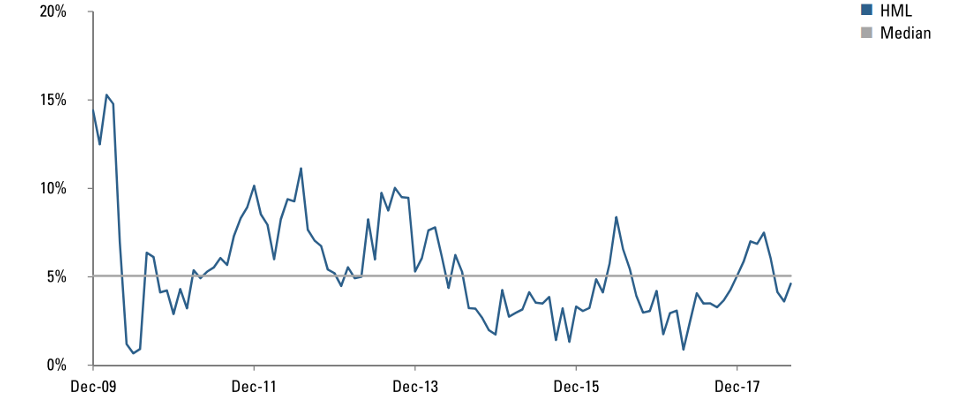
Return differentials between the best and worst performing of four MSCI value indices using rolling 12-month returns. Median shown in gray. Indices used are MSCI World Value, MSCI World Value-weighted, MSCI World Enhanced Value and MSCI Prime Value. It is not possible to invest directly in any index. Every investment program has an opportunity for loss as well as profit. Source: MSCI. Copyright MSCI 2018. All Rights Reserved. Unpublished. PROPRIETARY TO MSCI.
But while some variation between value approaches reflects deliberate attempts to capture different aspects of fundamentals, substantial variation also arises from shortcomings in the construction of simplistic implementations. First, many commonplace value formulations incur exposures to uncompensated risk factors that materially affect their performance and its interpretation. For example, common investible value products generally don’t distinguish between peer-relative valuation and sector- or country-level valuation even though empirical studies suggest that the bulk of value’s return premium is derived from stock selection rather than allocation (e.g., Golubov and Konstantinidi 2016). Allocation effects can introduce significant variation into performance. Figure 2, for example, displays sector attribution for the MSCI World Value index compared to the MSCI World index from 2017 through mid-2018. Of the 8% underperformance over the period, more than 5% (nearly two-thirds) was due to allocation effects.
Simplistic value formulations suffer from a second, related drawback that induces variation in performance and muddles interpretation: they don’t adjust for differences in the economics that underlie financial statement data. One such issue relates to industries marked by high levels of intangible assets, an issue that has even drawn media attention.1 Technology companies, as an example, often exhibit deflated book values due to large amounts of intangible assets developed in-house, the cost of which is expensed and charged against firm equity per GAAP accounting principles. As a result, P/B-based factors that aren’t industry (and perhaps geography) aware will tend to underweight companies characterized by intangibles, potentially forgoing attractive investment opportunities. Figure 3 provides a sense of the materiality of the phenomenon by illustrating the difference between P/B and R&D expense as a percent of sales for FAANG stocks versus the broader U.S. equity market.2
We deal with such complications in several ways. One is via peer-relative valuation metrics as inputs into stock selection. Doing so helps to avoid uncompensated allocation exposures. It also adjusts for structural and episodic variations in financial statement data across industries and geographies that confound comparisons across stocks and obscure mispricings.
Figure 2: MSCI World Value Index Attribution (Allocation vs. Selection)
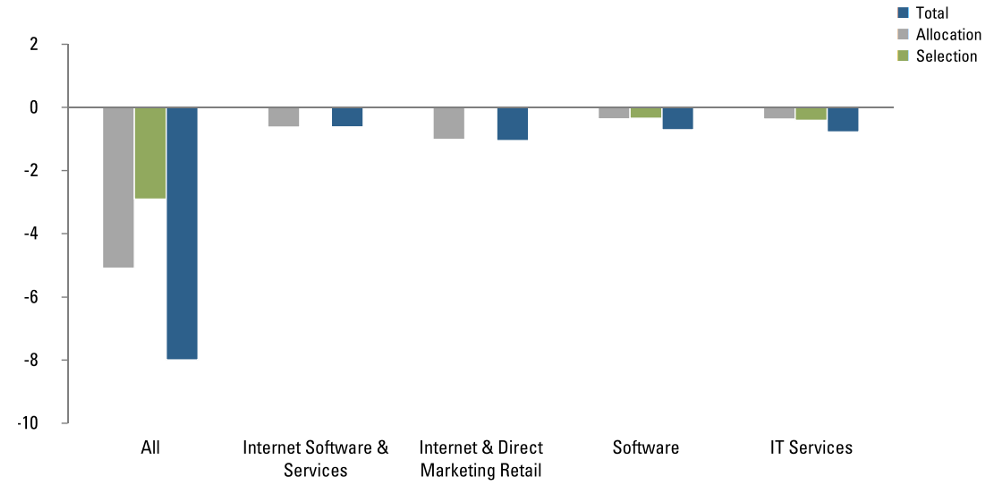 Performance attribution of MSCI World Value relative to MSCI World for selected industries for the period Jan 1, 2017 – June 30, 2018. It is not possible to invest directly in any index. Every investment program has an opportunity for loss as well as profit. For illustrative purposes only.
Source: Acadian, MSCI. Copyright MSCI 2018. All Rights Reserved. Unpublished. PROPRIETARY TO MSCI.
Figure 3: Price/Book and R&D Expense/Sales
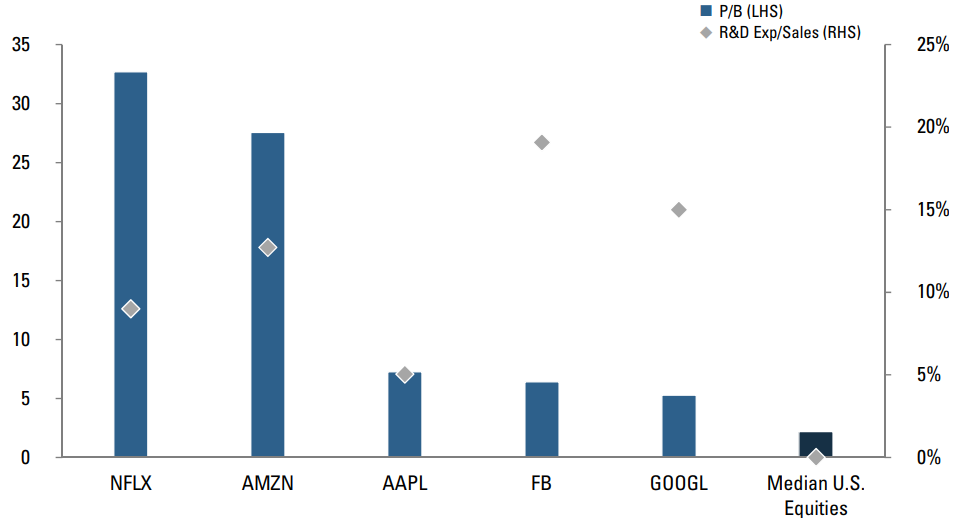 Price-to-book for FAANG stocks and median U.S. equities with market cap over $100mm as of Dec 29, 2017. Total research and development expense for FAANG stocks during the 5-year period 2012-2017; median for the U.S. is 0 for the same period. Every investment program has an opportunity for loss as well as profit. For illustrative purposes only. This should not be considered a recommendation to buy or sell any specific security.
Source: Capital IQ.
Peer-relative isn’t a panacea, though. In the context of our multifactor approach, we address certain complications in the interpretation of valuation metrics through other classes of signals. One example involves accounting for companies with significant contributed capital. Recent academic literature has found that contributed capital has little to no predictive value as compared to retained earnings, even though both are included in a firm’s equity.3 Another example would be brand value, which financial statements don’t accurately or consistently capture.
Beyond peer-relative signals and a multifactor approach, an important focus of our research agenda is further increasing the precision of our valuation signals themselves. This includes additional adjustments for intangibles, to ensure that the valuation-based elements of our alpha forecasts keep pace with changes in industry structures, management practices, and financial reporting. In addition to forecasting benefits, developing cleaner value factors will help us to better parse out and articulate how different aspects of value are behaving.
The utility of such refinements highlights a recurring theme in quantitative investing, which is that underlying economics evolve and so does the relevance of particular accounting measures. We shouldn’t think of factors as crude and immutable archetypes immune to the dynamism of markets. Rather, we should expect that systematic signals require careful formulation and ongoing refinement if they are to maintain effective in identifying mispricings. We can only have meaningful discussions about the performance of value (and other factors) if we have clarity regarding underlying definitions and constructions.