
State-Owned Enterprises—Buyer Beware?
Key Takeaways
- The number of state-owned enterprises (SOEs) has been increasing as a percentage of the world’s largest companies; SOEs are most dominant in emerging markets, including China.
- Despite their early success, Chinese SOEs have underperformed their peers in recent years.
- As China seeks to reform SOEs, better investment performance may be realized by focusing on SOEs with superior value, analyst sentiment and industry trend characteristics.
Table of contents
April 2018
Introduction
Most global investors have exposure to state-owned enterprises (SOEs)—and many may not even know it. Well-known companies such as NTT in Japan and Deutsche Post/DHL in Germany are examples of such enterprises. Even in the United States, organizations such as the Federal National Mortgage Association are effectively government owned.1 The common theme across SOEs is that they were created by local or central governments for a specific purpose and these governments retain a significant ownership stake. For the purposes of this paper, we define companies as SOEs if state ownership exceeds 20%. This threshold suggests that the government has significant influence over company operations, board membership, and policy.
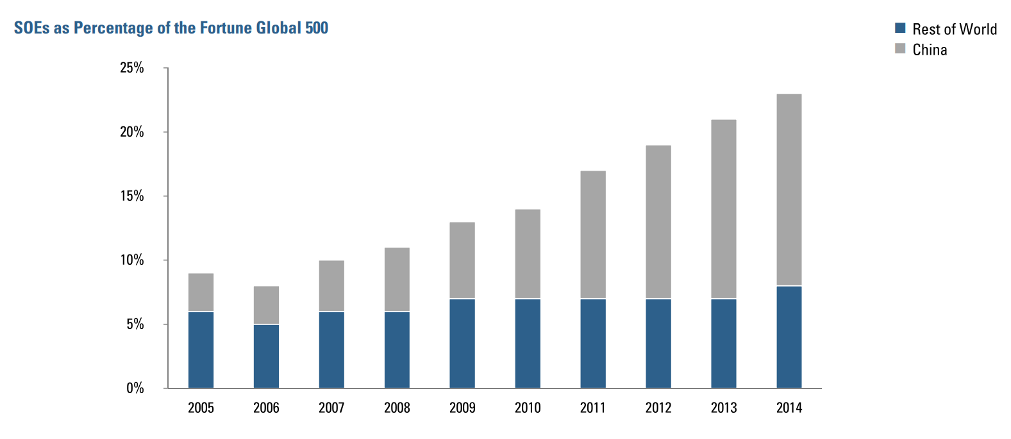
While SOEs may sound like a throwback to an era when government participation and economic control were in vogue, such enterprises are increasing in number on the global scene, not decreasing. The percentage of SOEs in the Fortune Global 500 has increased from 9% in 2005 to 23% in 2014, largely driven by the rise of Chinese companies, as shown in Figure 1.
Figure 1
SOEs and Emerging Markets
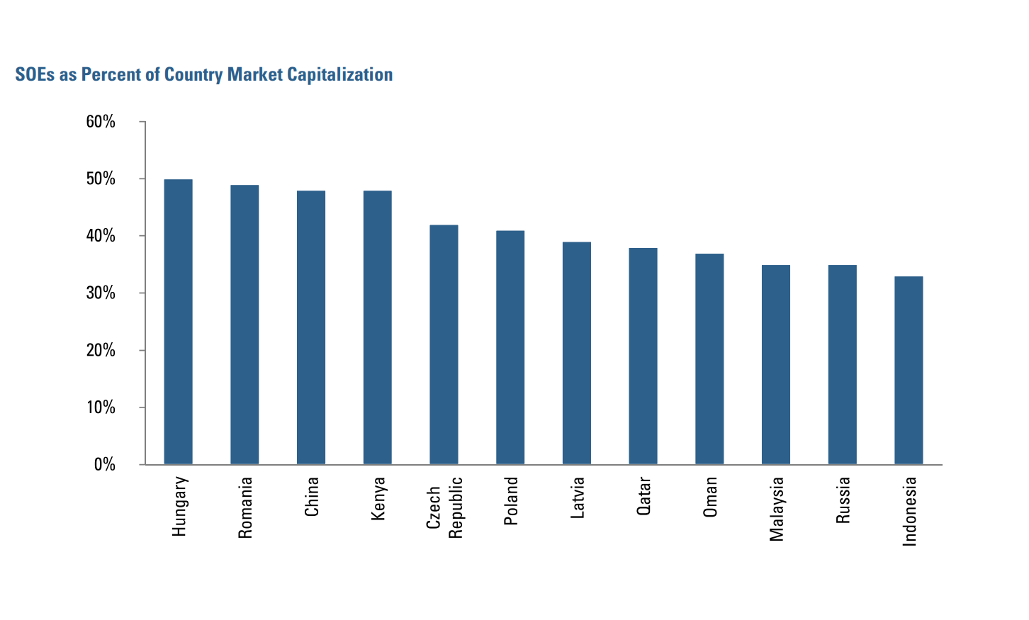
Although SOEs still exist in many developed markets, it is in emerging markets where these companies are most economically relevant. As shown in Figure 2, Russia and former Soviet countries in Eastern Europe dominate the list with the greatest proportion of SOEs by market capitalization, but most of these equity markets are relatively small. The exception is China, the world’s second largest market. With nearly 50% of its companies under government control, Chinese SOEs translate to nearly a 2% weight in the MSCI All-Country World Index and 15% in the MSCI Emerging Markets Index.2
Given the size and growing importance of the Chinese equity market, the remainder of this discussion will focus on the impact and prospects for SOEs in this country.
Figure 2
SOEs and China
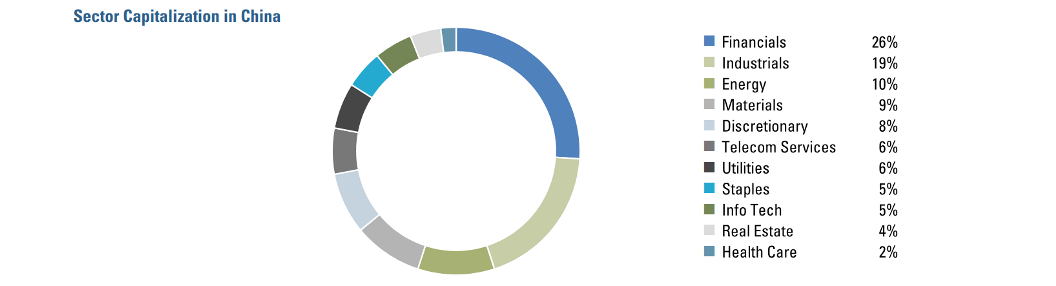
Within China, most of the largest companies are SOEs. Five of the largest enterprises as measured by revenue are SOEs, including State Grid (the second largest employer in the world after Walmart), Sinopec, and Industrial and Commercial Bank of China.3 Though SOEs dominate energy and financials, they are present within all sectors in China, including healthcare and technology (see Figure 3).4
Figure 3
Performance of SOEs
Given the dominance of SOEs in the Chinese economy and equity market, one may wonder how well these stocks have performed. The answer is dependent on the timeframe, as there have been two distinct periods of relative performance: pre- and post-2008, as shown in Figure 4.
Figure 4
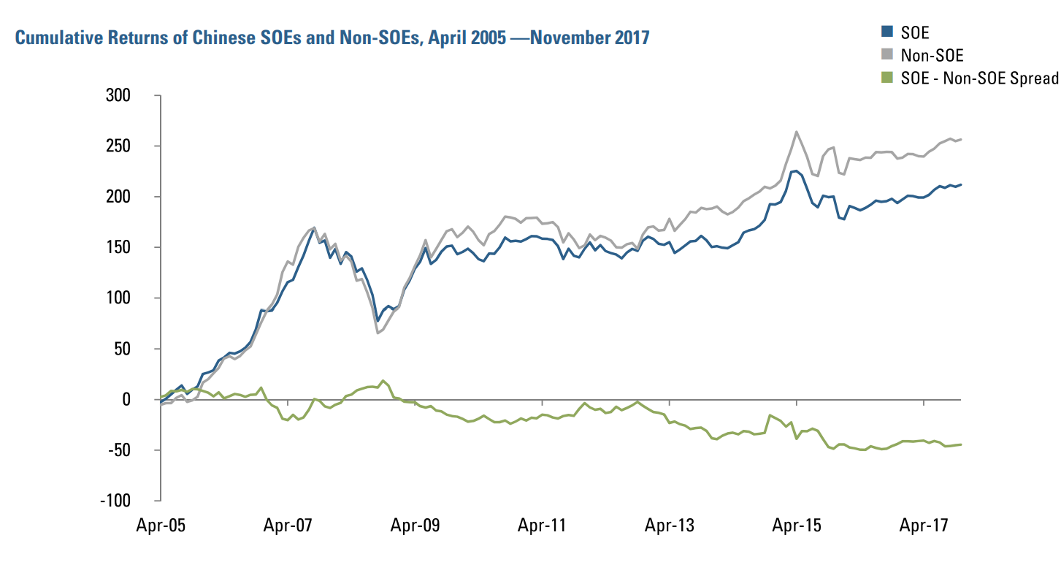
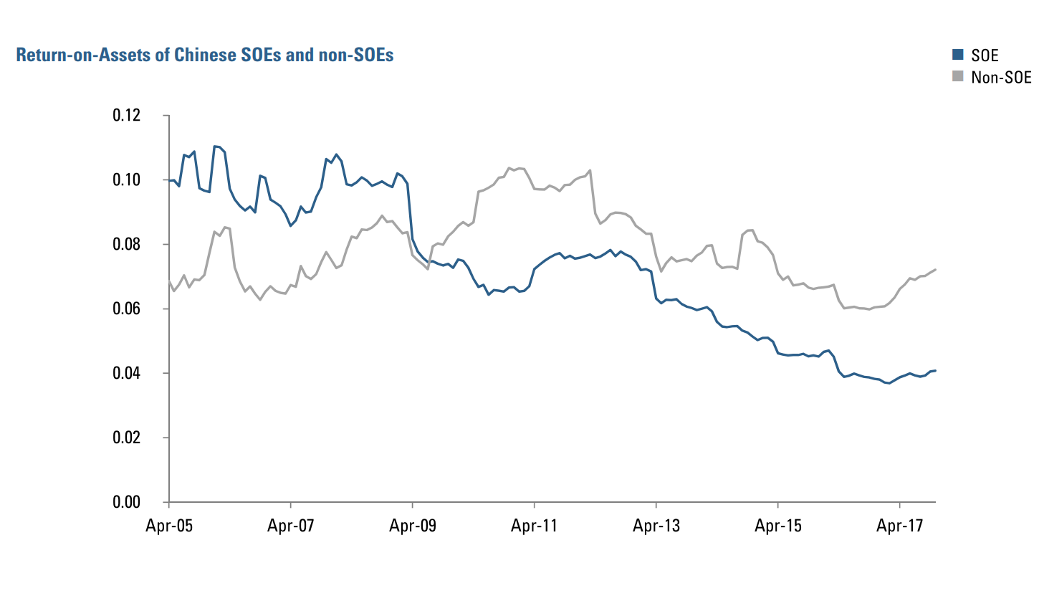
From 2005 through 2008, SOEs in China generally kept pace with the performance of non-SOEs, while delivering modestly better cumulative returns through October 2008. Reasons for this include easier access to capital, protection from competition, and preferential treatment in receiving state contracts. However, post-2008, SOEs have consistently underperformed privately owned companies. Why this change? The answer appears to be a combination of over-investment and excess debt in SOEs coinciding with the reduction of domestic and global economic growth following the global financial crisis. Part of the Chinese government’s response to this slowdown was an increase in expenditures and investment to maintain overall economic activity. SOEs were encouraged to increase their asset base, which required taking on additional debt, but these investments proved to be of limited profitability. The return-on-assets (ROA) of Chinese SOEs versus non-SOEs in Figure 5 reflects the evidence of over-investment in SOEs pre-GFC. Asset growth combined with higher debt service and lower profitability following the financial crisis led to a significant decline in the ROA for these companies from which there has yet to be a full recovery.
Figure 5
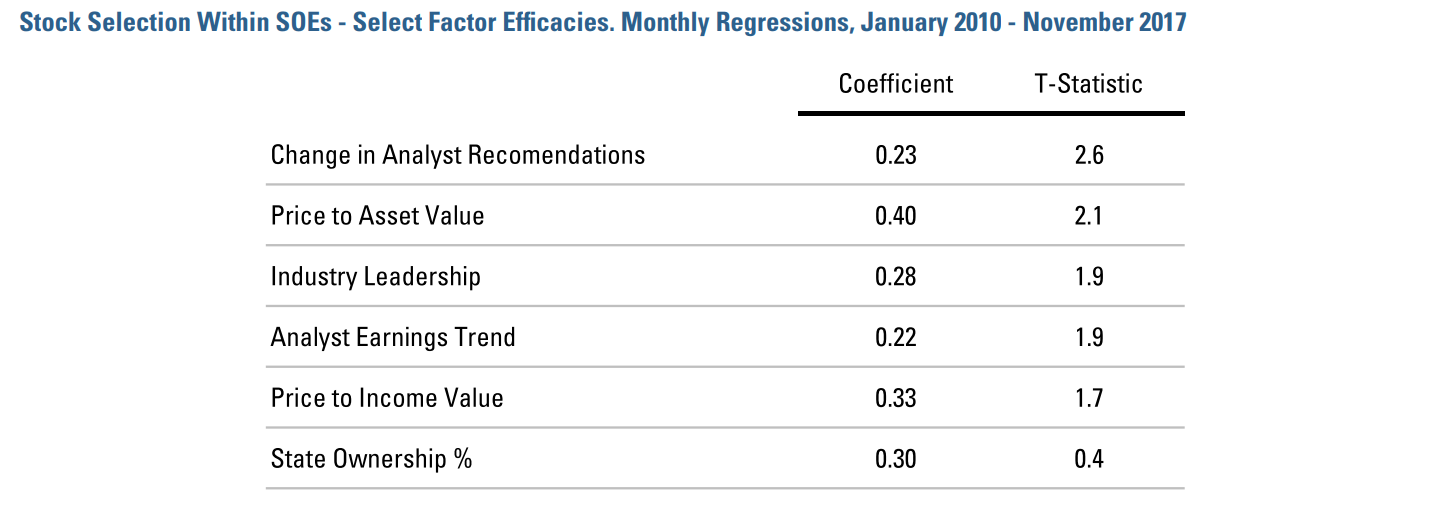
There is evidence in this post-2008 period that tilting towards select value, analyst sentiment, and industry trend signals has helped to identify Chinese SOEs with above-average return prospects. Figure 6 shows results from predictive multivariate regressions of SOE returns on selected factor exposures. Only Change in Analyst Recommendations and Price to Asset Value (which includes Price/Book among other asset-based measures) are statistically significant at greater than a 95% level, but others, including Industry Leadership (which measures how companies follow their largest industry leaders), have shown some efficacy. Note that the State Ownership Percentage did not have a significant influence on the returns among SOEs. It appears that investors are not sensitive to levels of control over the 20% threshold that we have adopted for this paper.
Figure 6
The Future Of Chinese SOEs
Having witnessed both outperformance and, more recently, underperformance of SOEs in China, investors may wonder how well SOEs will do going forward. In general, we expect SOEs to underperform. Reasons for this include: political patronage in the appointment of executives, a culture of fraud, poorly incentivized performance, a lack of autonomy, and objectives other than maximizing shareholder value.
Will the importance of SOEs in the Chinese economy require that they counter these trends and improve—or will these disadvantages further weigh on their performance? In the near-term, SOEs will continue to dominate the Chinese economy with the government retaining control of a number of key and strategic enterprises. Although there has long been talk of reform, many challenges continue to stand in the way, including, for example, the fact that SOE executives often outrank regulators in the Chinese Communist Party or local governments, weakening enforcement capabilities.
However, change may finally be on the horizon. President Xi Jinping has called for broad SOE reform, emphasizing more operational transparency, greater foreign and domestic competition, and other marketoriented reforms. In recent quarters, cuts in over-capacity, reduction in debt, and mergers among SOEs have occurred. Although valuations for SOEs remain below those of private companies, profitability has been improving. These are promising—if tentative—signs.
Conclusion
SOEs remain a considerable presence among emerging markets, especially in China. Many have been extremely successful and joined the ranks of some of the largest global companies. But in recent years their performance has lagged that of non-SOEs in China, and we believe that exercising care in stock selection, emphasizing value, analyst sentiment, and industry trends may help investors achieve superior performance within the broad universe of Chinese SOEs.
Interestingly, although all five of the largest companies in China as measured by revenue are SOEs, three of its five largest by capitalization are privately owned: Tencent, Alibaba, and Baidu. If capitalization is a more accurate measure of the market’s view of future prospects and profitability, then non-SOEs may continue to grow in importance in China. However, if announced reforms are effectively implemented, then SOEs may remain a critical component of the Chinese economy—and of investors’ portfolios—for years to come.
Endnotes
- References to specific securities are for illustrative purposes only and should not be construed as recommendations to buy or sell
- Copyright MSCI 2018. All Rights Reserved. Unpublished. PROPRIETARY TO MSCI. Percentages as of 7/31/2017.
- References to specific securities are for illustrative purposes only and should not be construed as recommendations to buy or sell.
- Acadian’s universe of Chinese companies includes A-shares, H-shares, and non-locally listed Chinese companies.
Legal Disclaimer
These materials provided herein may contain material, non-public information within the meaning of the United States Federal Securities Laws with respect to Acadian Asset Management LLC, Acadian Asset Management Inc. and/or their respective subsidiaries and affiliated entities. The recipient of these materials agrees that it will not use any confidential information that may be contained herein to execute or recommend transactions in securities. The recipient further acknowledges that it is aware that United States Federal and State securities laws prohibit any person or entity who has material, non-public information about a publicly-traded company from purchasing or selling securities of such company, or from communicating such information to any other person or entity under circumstances in which it is reasonably foreseeable that such person or entity is likely to sell or purchase such securities.
Acadian provides this material as a general overview of the firm, our processes and our investment capabilities. It has been provided for informational purposes only. It does not constitute or form part of any offer to issue or sell, or any solicitation of any offer to subscribe or to purchase, shares, units or other interests in investments that may be referred to herein and must not be construed as investment or financial product advice. Acadian has not considered any reader's financial situation, objective or needs in providing the relevant information.
The value of investments may fall as well as rise and you may not get back your original investment. Past performance is not necessarily a guide to future performance or returns. Acadian has taken all reasonable care to ensure that the information contained in this material is accurate at the time of its distribution, no representation or warranty, express or implied, is made as to the accuracy, reliability or completeness of such information.
This material contains privileged and confidential information and is intended only for the recipient/s. Any distribution, reproduction or other use of this presentation by recipients is strictly prohibited. If you are not the intended recipient and this presentation has been sent or passed on to you in error, please contact us immediately. Confidentiality and privilege are not lost by this presentation having been sent or passed on to you in error.
Acadian’s quantitative investment process is supported by extensive proprietary computer code. Acadian’s researchers, software developers, and IT teams follow a structured design, development, testing, change control, and review processes during the development of its systems and the implementation within our investment process. These controls and their effectiveness are subject to regular internal reviews, at least annual independent review by our SOC1 auditor. However, despite these extensive controls it is possible that errors may occur in coding and within the investment process, as is the case with any complex software or data-driven model, and no guarantee or warranty can be provided that any quantitative investment model is completely free of errors. Any such errors could have a negative impact on investment results. We have in place control systems and processes which are intended to identify in a timely manner any such errors which would have a material impact on the investment process.
Acadian Asset Management LLC has wholly owned affiliates located in London, Singapore, and Sydney. Pursuant to the terms of service level agreements with each affiliate, employees of Acadian Asset Management LLC may provide certain services on behalf of each affiliate and employees of each affiliate may provide certain administrative services, including marketing and client service, on behalf of Acadian Asset Management LLC.
Acadian Asset Management LLC is registered as an investment adviser with the U.S. Securities and Exchange Commission. Registration of an investment adviser does not imply any level of skill or training.
Acadian Asset Management (Singapore) Pte Ltd, (Registration Number: 199902125D) is licensed by the Monetary Authority of Singapore. It is also registered as an investment adviser with the U.S. Securities and Exchange Commission.
Acadian Asset Management (Australia) Limited (ABN 41 114 200 127) is the holder of Australian financial services license number 291872 ("AFSL"). It is also registered as an investment adviser with the U.S. Securities and Exchange Commission. Under the terms of its AFSL, Acadian Asset Management (Australia) Limited is limited to providing the financial services under its license to wholesale clients only. This marketing material is not to be provided to retail clients.
Acadian Asset Management (UK) Limited is authorized and regulated by the Financial Conduct Authority ('the FCA') and is a limited liability company incorporated in England and Wales with company number 05644066. Acadian Asset Management (UK) Limited will only make this material available to Professional Clients and Eligible Counterparties as defined by the FCA under the Markets in Financial Instruments Directive, or to Qualified Investors in Switzerland as defined in the Collective Investment Schemes Act, as applicable.