
Risk Mispricing in China A-Shares
Key Takeaways
- We observe the mispricing of risk in China A-shares, similar to other world markets.
- In China A, large-cap stocks constitute a greater portion of the low-vol universe than they do in the rest of emerging markets, and state ownership plays less of a role than investors might guess.
- Hypothetical China A minimum variance portfolios exhibit reduced risk and smaller drawdowns, suggesting promise for low-volatility investing in A-shares.
Table of contents
Introduction
Acadian is increasingly being asked about the potential benefits of a low-volatility investing approach to China A-shares, reflecting interest in accessing that market with a measure of drawdown protection. In this note, we demonstrate that the mispricing of risk is evident in China A-shares, much as it is in other markets around the world. We examine whether any distinctive characteristics of low-risk Chinese stocks differentiate low-volatility investing in A-shares from elsewhere in emerging markets (EM). We also provide a sense of the potential for risk reduction in China A.
Risk Appears Mispriced in China A-Shares
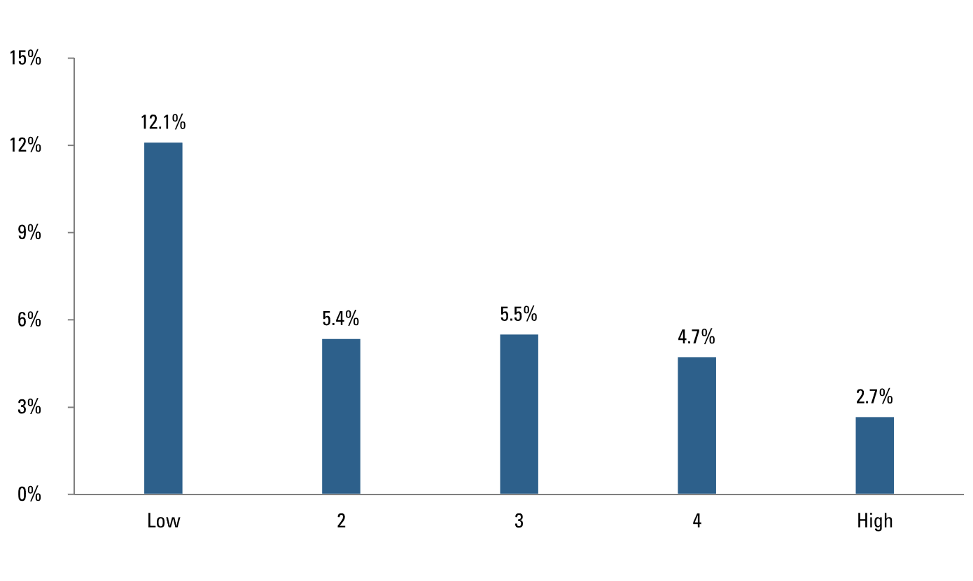
In broad strokes, the risk mispricing in China A-shares looks similar to what we see in other equity markets around the world. Figure 1 shows that low-beta China A stocks have outperformed in absolute terms over the past 10 years. Figure 2 demonstrates the phenomenon on a risk-adjusted basis: A-shares in the lowest beta quintile realize a large positive CAPM alpha, on average, while average alphas for stocks in all higher-beta quintiles are negative. In other words, lower-beta stocks tend to earn higher returns and higher-beta stocks tend to earn lower returns than their risk profiles would suggest. This pattern is economically large in magnitude and monotonic.
As in other markets, we believe that the phenomenon exists because higher-risk stocks tend to be overpriced due to irrational demand from naïve investors. We would expect that phenomenon to be particularly acute in a retail-driven market such as China A.1
Figure 1: Average returns by beta quintile: China A-shares market, 2007-2017
Distinctive Characteristics of Low Volatility In A-Shares
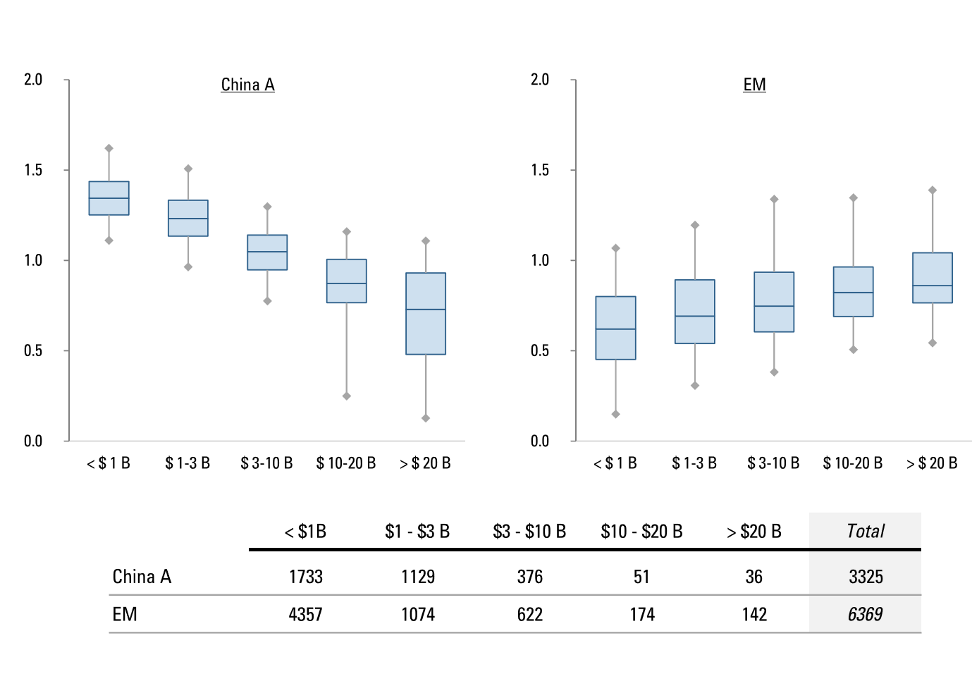
There are two striking differences between low-risk stocks in the A-shares market and elsewhere in EM. One is that they have distinctive market capitalization characteristics. In Figure 3, the left set of boxplots shows that among China A-shares, the largest stocks have the lowest betas to the A-shares index, while betas in the smallest two capitalization quintiles tend to be well above one. This isn’t the case across other emerging markets, as shown in the right-hand set of boxplots. In EM ex-China A, betas are lowest among small-cap stocks. Figure 3 also shows that betas among China A large-caps are highly dispersed, a further indication of their attractiveness for low-vol stock selection. As a result of the distinctive relationship between market capitalization and beta among China A-shares, China A low-volatility portfolios are likely to hold larger-capitalization stocks than investors are used to seeing in other EM contexts.
Figure 2: Realized CAPM alphas and betas by ex-ante beta quintiles: China A-shares, 2007-2017
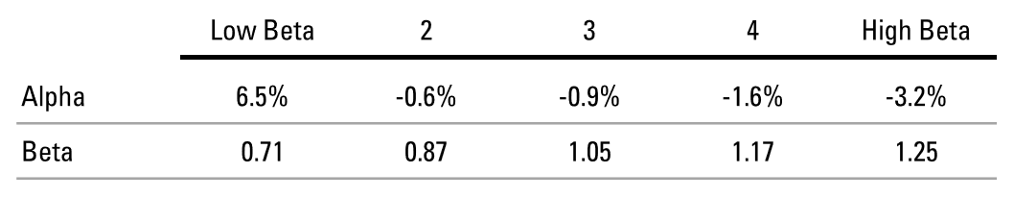
Figure 3: Beta distributions by size quintile: China A (left) and EM ex-China (right)
A second differentiating characteristic of China A low-volatility stocks is state ownership. While state ownership is a significant theme in EM as a whole, it’s particularly prominent in China A, a point that we discussed in-depth in “State-Owned Enterprises – Buyer Beware?”2 Nearly half of China A companies have state-ownership exceeding 20%, and Chinese state- owned enterprises (SOEs) account for almost all of the substantial recent growth in SOE weighting within the Fortune Global 500.
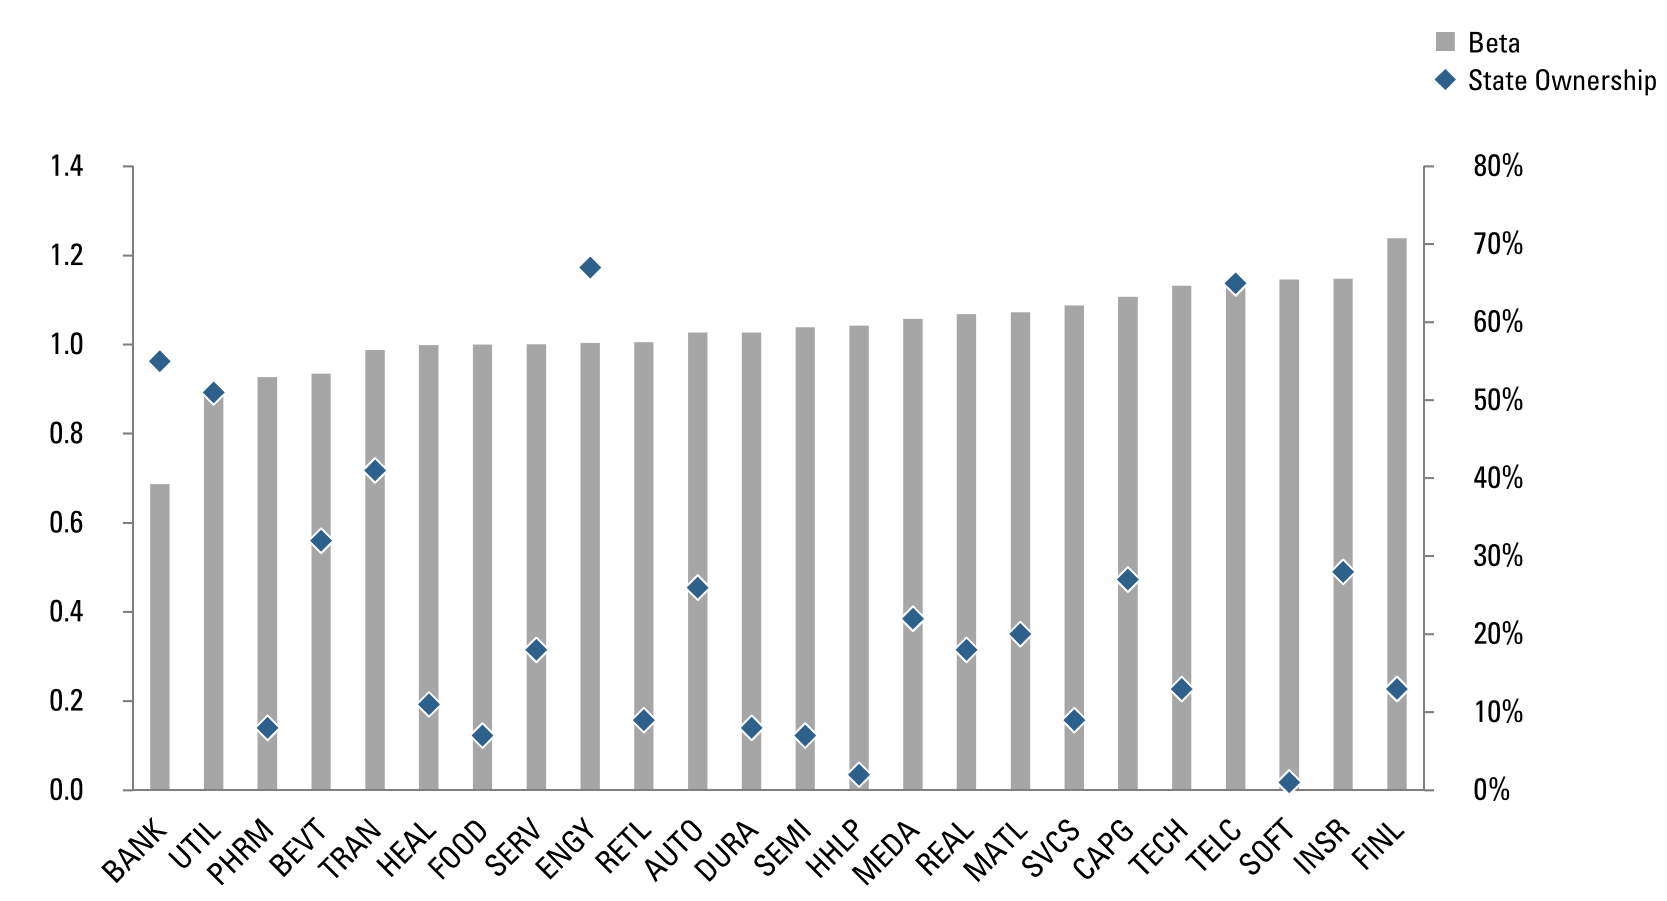
Nevertheless, we are optimistic about the prospect of building low-risk A-shares portfolios that don’t have unusual degrees of state ownership. The reason for this is that we find no relationship between state ownership and beta among China A-shares. We demonstrate this in Figure 4, which shows variation in both beta and state ownership across industry groups. While the two lowest-beta industries, banks and utilities, are indeed characterized by high degrees of state ownership, there are many low-beta sectors where state ownership is quite low, such as healthcare, food, and services.
Further, if we subdivide stocks in the low- and high-beta quintiles from Figure 2 by state ownership, we find that differences in alphas and betas between SOEs and non-SOEs are not statistically significant.
In sum, despite the relative prominence of SOEs in China compared to the rest of EM, we don’t believe that state ownership should drive low-volatility outcomes in the A-shares market. We do believe that state ownership has potential to help forecast returns, however, and we incorporate it into our stock-selection model.
Figure 4: Beta and state ownership by industry group
Risk Reduction Potential
To provide a sense of the risk-reduction potential in China A-shares, we examine the historical behavior of a hypothetical “plain vanilla” minimum variance strategy. It targets MSCI China A3 as the benchmark, sources stocks from an investable universe (market capitalization greater than USD 100MM), and maximizes risk reduction based on Acadian’s proprietary, dedicated China A risk forecasting model. This portfolio is fully invested, long-only, and rebalanced monthly. We cap stock-level active overweights at 3%, a typical plain-vanilla construction approach.
Figure 5 presents the hypothetical performance of such a portfolio from January 2007 – July 2018. This demonstrates material positive active returns, along with substantial benchmark-relative reductions in beta and total volatility (approximately 15% and 11%, respectively). For investors familiar with other EM contexts, that risk reduction may seem modest. Keep in mind, however, that in the China A context, we’re forgoing country diversification, which has a material beta-reduction benefit in portfolios that span EM.
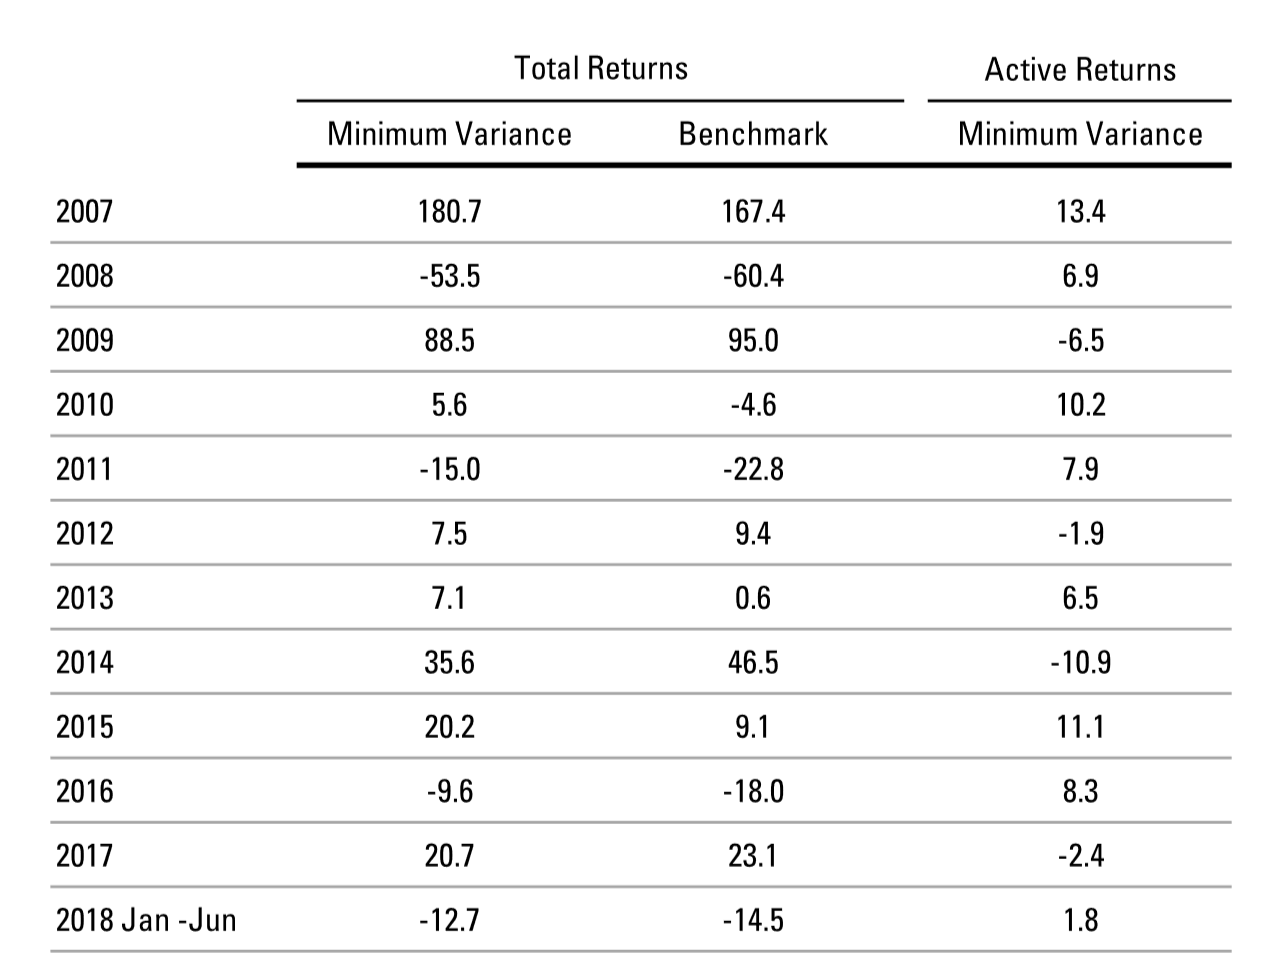
The year-by-year performance breakout in Figure 6 also demonstrates the potential drawdown protection afforded by a low-volatility approach. For example, during the China A selloff from June 2015 to February 2016, when the benchmark returned -44%, the hypothetical minimum variance portfolio experienced a materially smaller loss of -35.4% (i.e., an active return of +8.6%). A tradeoff of this downside protection is expected underperformance during some strong rallies, as can be seen in 2009 and 2014.
Figure 5: Historical performance of a hypothetical minimum variance strategy
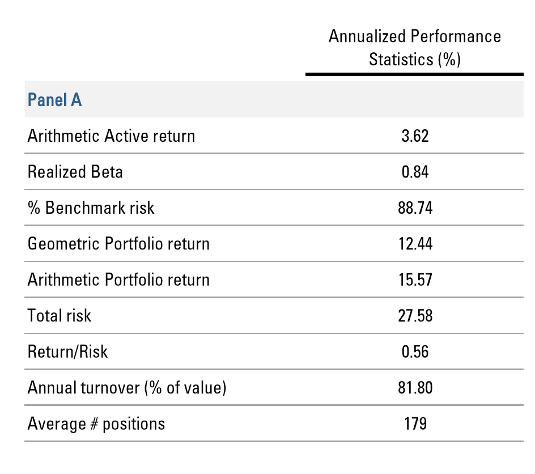
Figure 6: Hypothetical compounded annual returns
Conclusion
Growing interest in applying low-volatility investing to China A-shares reflects both the increasing prominence of the market and its continued volatility. Evidence that risk mispricing manifests in China A-shares is supported by the behavior of a hypothetical minimum variance portfolio. Investors should expect that characteristics of low-volatility China A portfolios will differ from those in other markets. For one thing, the level of risk reduction is likely to be lower than that seen in broader low-volatility portfolios that benefit from country diversification. Nevertheless, hypothetical China A minimum variance portfolios exhibit reduced risk and smaller drawdowns, suggesting promise for low-volatility investing in China A-shares.
Endnotes
- For general background on the low volatility mispricing and its causes, see: Acadian Asset Management. “Managed Volatility Strategies Overview.” (March 2018); Acadian Asset Management. “20 Years of Low-Volatility Equities: A Brief Performance Survey.” (June 2017); Baker, Malcolm, Brendan Bradley, and Jeffrey Wurgler. “Benchmarks as Limits to Arbitrage: Understanding the Low Volatility Anomaly.” Financial Analysts Journal 67, no. 1 (2011): 40-54; Baker, Malcolm, Brendan Bradley, and Ryan Taliaferro. “The Low-Risk Anomaly: A Decomposition into Micro and Macro Effects.” Financial Analyst Journal 70, no. 2 (2014).
- Acadian Asset Management, April 2018
- Copyright MSCI 2019. All Rights Reserved. Unpublished. PROPRIETARY TO MSCI
Legal Disclaimer
These materials provided herein may contain material, non-public information within the meaning of the United States Federal Securities Laws with respect to Acadian Asset Management LLC, Acadian Asset Management Inc. and/or their respective subsidiaries and affiliated entities. The recipient of these materials agrees that it will not use any confidential information that may be contained herein to execute or recommend transactions in securities. The recipient further acknowledges that it is aware that United States Federal and State securities laws prohibit any person or entity who has material, non-public information about a publicly-traded company from purchasing or selling securities of such company, or from communicating such information to any other person or entity under circumstances in which it is reasonably foreseeable that such person or entity is likely to sell or purchase such securities.
Acadian provides this material as a general overview of the firm, our processes and our investment capabilities. It has been provided for informational purposes only. It does not constitute or form part of any offer to issue or sell, or any solicitation of any offer to subscribe or to purchase, shares, units or other interests in investments that may be referred to herein and must not be construed as investment or financial product advice. Acadian has not considered any reader's financial situation, objective or needs in providing the relevant information.
The value of investments may fall as well as rise and you may not get back your original investment. Past performance is not necessarily a guide to future performance or returns. Acadian has taken all reasonable care to ensure that the information contained in this material is accurate at the time of its distribution, no representation or warranty, express or implied, is made as to the accuracy, reliability or completeness of such information.
This material contains privileged and confidential information and is intended only for the recipient/s. Any distribution, reproduction or other use of this presentation by recipients is strictly prohibited. If you are not the intended recipient and this presentation has been sent or passed on to you in error, please contact us immediately. Confidentiality and privilege are not lost by this presentation having been sent or passed on to you in error.
Acadian’s quantitative investment process is supported by extensive proprietary computer code. Acadian’s researchers, software developers, and IT teams follow a structured design, development, testing, change control, and review processes during the development of its systems and the implementation within our investment process. These controls and their effectiveness are subject to regular internal reviews, at least annual independent review by our SOC1 auditor. However, despite these extensive controls it is possible that errors may occur in coding and within the investment process, as is the case with any complex software or data-driven model, and no guarantee or warranty can be provided that any quantitative investment model is completely free of errors. Any such errors could have a negative impact on investment results. We have in place control systems and processes which are intended to identify in a timely manner any such errors which would have a material impact on the investment process.
Acadian Asset Management LLC has wholly owned affiliates located in London, Singapore, and Sydney. Pursuant to the terms of service level agreements with each affiliate, employees of Acadian Asset Management LLC may provide certain services on behalf of each affiliate and employees of each affiliate may provide certain administrative services, including marketing and client service, on behalf of Acadian Asset Management LLC.
Acadian Asset Management LLC is registered as an investment adviser with the U.S. Securities and Exchange Commission. Registration of an investment adviser does not imply any level of skill or training.
Acadian Asset Management (Singapore) Pte Ltd, (Registration Number: 199902125D) is licensed by the Monetary Authority of Singapore. It is also registered as an investment adviser with the U.S. Securities and Exchange Commission.
Acadian Asset Management (Australia) Limited (ABN 41 114 200 127) is the holder of Australian financial services license number 291872 ("AFSL"). It is also registered as an investment adviser with the U.S. Securities and Exchange Commission. Under the terms of its AFSL, Acadian Asset Management (Australia) Limited is limited to providing the financial services under its license to wholesale clients only. This marketing material is not to be provided to retail clients.
Acadian Asset Management (UK) Limited is authorized and regulated by the Financial Conduct Authority ('the FCA') and is a limited liability company incorporated in England and Wales with company number 05644066. Acadian Asset Management (UK) Limited will only make this material available to Professional Clients and Eligible Counterparties as defined by the FCA under the Markets in Financial Instruments Directive, or to Qualified Investors in Switzerland as defined in the Collective Investment Schemes Act, as applicable.