
Quick Take: A historic year for emerging markets mega caps
Unusually concentrated EM benchmarks
-
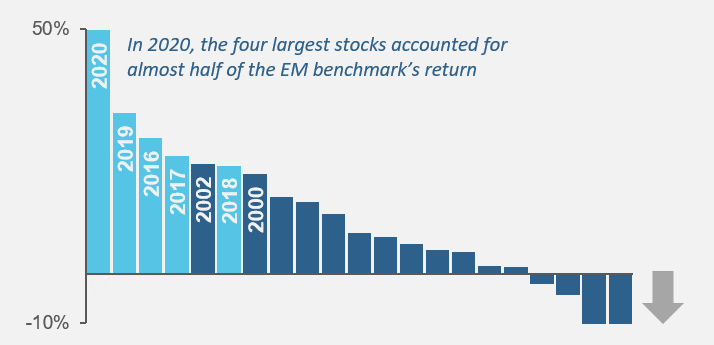
In 2020, the top-four stocks in the MSCI EM Index accounted for nearly half of its return, the highest proportion in the last 20+ years. (Top chart.) Taiwan Semiconductor, Tencent Holdings, and Samsung each gained over 50%.
-
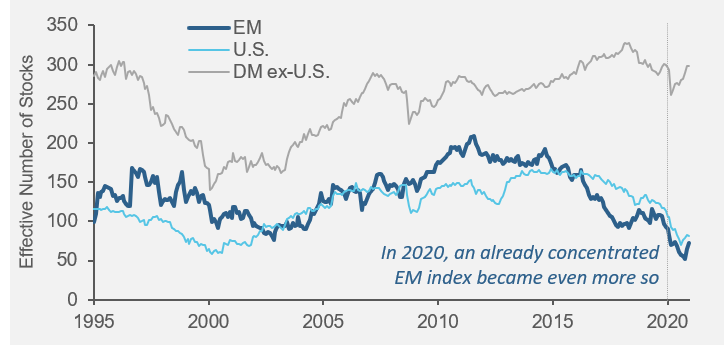
As a result, already concentrated EM benchmark indexes became even more so. Although the MSCI EM index includes close to 1,400 constituents, it has recently been behaving as if it contains only 60-70. (Bottom chart.)
Implications for investors
-
Narrow factor positioning: As we discussed in our October paper, Reassessing Emerging Markets Equities, the EM benchmark has become highly geared to the performance of large-cap growth stocks. 2020’s top-heavy index performance has intensified that exposure. Although that positioning has paid off over the past few years, the benchmark has become particularly vulnerable should large-cap growth fail to meet lofty profitability expectations that already are priced in.
-
Material idiosyncratic risk: Concentrated indexes entail material exposure to company-specific risk. The fortunes of Alibaba Group in 2020 offer a salient example. Since October 2020, when the stock was the largest holding in the EM benchmark, it has lost close to 25% due to tensions with regulators.
Recommit to diversified approaches
-
Looking ahead, we would encourage EM investors to recommit to strategies that provide exposure to a diverse set of returns drivers, geographies, and industries rather than to chase performance trends that were exacerbated by the pandemic. In particular, EM investors with passive allocations should be mindful of their unusually concentrated factor positioning and elevated company-specific risk.
The companies mentioned above are discussed for illustrative purposes only and are not a recommendation to buy or sell a specific security.
EM Benchmark Return Contribution: Top-Four Stocks
Effective Benchmark Concentration
Legal Disclaimer
These materials provided herein may contain material, non-public information within the meaning of the United States Federal Securities Laws with respect to Acadian Asset Management LLC, Acadian Asset Management Inc. and/or their respective subsidiaries and affiliated entities. The recipient of these materials agrees that it will not use any confidential information that may be contained herein to execute or recommend transactions in securities. The recipient further acknowledges that it is aware that United States Federal and State securities laws prohibit any person or entity who has material, non-public information about a publicly-traded company from purchasing or selling securities of such company, or from communicating such information to any other person or entity under circumstances in which it is reasonably foreseeable that such person or entity is likely to sell or purchase such securities.
Acadian provides this material as a general overview of the firm, our processes and our investment capabilities. It has been provided for informational purposes only. It does not constitute or form part of any offer to issue or sell, or any solicitation of any offer to subscribe or to purchase, shares, units or other interests in investments that may be referred to herein and must not be construed as investment or financial product advice. Acadian has not considered any reader's financial situation, objective or needs in providing the relevant information.
The value of investments may fall as well as rise and you may not get back your original investment. Past performance is not necessarily a guide to future performance or returns. Acadian has taken all reasonable care to ensure that the information contained in this material is accurate at the time of its distribution, no representation or warranty, express or implied, is made as to the accuracy, reliability or completeness of such information.
This material contains privileged and confidential information and is intended only for the recipient/s. Any distribution, reproduction or other use of this presentation by recipients is strictly prohibited. If you are not the intended recipient and this presentation has been sent or passed on to you in error, please contact us immediately. Confidentiality and privilege are not lost by this presentation having been sent or passed on to you in error.
Acadian’s quantitative investment process is supported by extensive proprietary computer code. Acadian’s researchers, software developers, and IT teams follow a structured design, development, testing, change control, and review processes during the development of its systems and the implementation within our investment process. These controls and their effectiveness are subject to regular internal reviews, at least annual independent review by our SOC1 auditor. However, despite these extensive controls it is possible that errors may occur in coding and within the investment process, as is the case with any complex software or data-driven model, and no guarantee or warranty can be provided that any quantitative investment model is completely free of errors. Any such errors could have a negative impact on investment results. We have in place control systems and processes which are intended to identify in a timely manner any such errors which would have a material impact on the investment process.
Acadian Asset Management LLC has wholly owned affiliates located in London, Singapore, and Sydney. Pursuant to the terms of service level agreements with each affiliate, employees of Acadian Asset Management LLC may provide certain services on behalf of each affiliate and employees of each affiliate may provide certain administrative services, including marketing and client service, on behalf of Acadian Asset Management LLC.
Acadian Asset Management LLC is registered as an investment adviser with the U.S. Securities and Exchange Commission. Registration of an investment adviser does not imply any level of skill or training.
Acadian Asset Management (Singapore) Pte Ltd, (Registration Number: 199902125D) is licensed by the Monetary Authority of Singapore. It is also registered as an investment adviser with the U.S. Securities and Exchange Commission.
Acadian Asset Management (Australia) Limited (ABN 41 114 200 127) is the holder of Australian financial services license number 291872 ("AFSL"). It is also registered as an investment adviser with the U.S. Securities and Exchange Commission. Under the terms of its AFSL, Acadian Asset Management (Australia) Limited is limited to providing the financial services under its license to wholesale clients only. This marketing material is not to be provided to retail clients.
Acadian Asset Management (UK) Limited is authorized and regulated by the Financial Conduct Authority ('the FCA') and is a limited liability company incorporated in England and Wales with company number 05644066. Acadian Asset Management (UK) Limited will only make this material available to Professional Clients and Eligible Counterparties as defined by the FCA under the Markets in Financial Instruments Directive, or to Qualified Investors in Switzerland as defined in the Collective Investment Schemes Act, as applicable.