
Passive Investing: Reshaping Financial Markets?
Table of contents
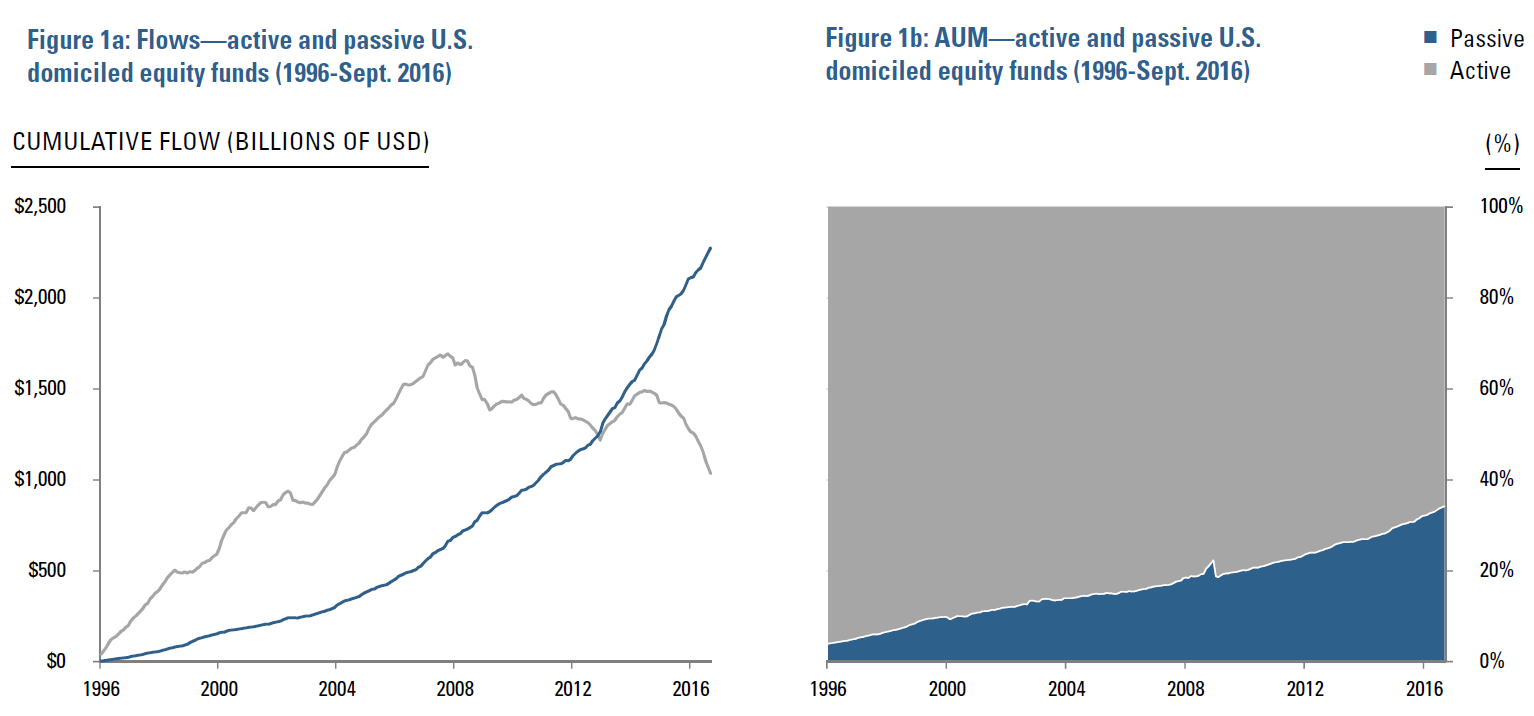
2016 brought a blizzard of headlines about the shift towards passive investing driven by eye-popping data on flows. As demonstrated in Figure 1a, active strategies have experienced sizeable outflows over the past two years, while passive inflows have accelerated. AUM statistics show that passive has garnered a material, although not yet dominant, share of the market. U.S. fund data, for example, puts passive market share at about 35-40%.i (Figure 1b)
The rise of passive investing has potentially significant consequences for market behavior. In this note, we explore its influence on asset comovement, market fragility, pricing efficiency, and index frictions. We then consider implications for investors. The uneven distribution of passive ownership benefits strategies that seek to exploit the entire available investment universe. We believe that changes in the drivers, expression, and dynamics of mispricings favor active approaches that have the richness and flexibility to adapt. Greater market fragility presents risk management challenges for all investors, exacerbates vulnerability of simplistic allocation approaches, and highlights the value of keeping powder dry.
Figure 1
Passive: From Theory To Messy Reality
Before we assess how passive investing may be reshaping markets, we first consider how the concept of “passive” has evolved over time. A canonical form of passive investing derives from Modern Portfolio Theory and the Capital Asset Pricing Model (CAPM). Their central implication is that in equilibrium, every investor should (and would) hold the market portfolio, a static capitalization-weighted portfolio of all investible assets, including global stocks, bonds, loans, etc. This is a world in which investment management requires little skill. This theoretical ideal provides a handy reference point in identifying salient aspects of passive’s evolution, in practice. The first broad-market index mutual fund, the Vanguard 500, was introduced in 1976. While it represents a cap-weighted portfolio holding the majority of U.S. equities by market cap, there are important differences between even this benchmark and the CAPM market portfolio. It holds only a narrow slice of all available investible assets (U.S. large caps), and rules govern changes in its composition over time. So even close approximations of passive concepts still reflect active decision-making with material potential consequences for returns and risk. Launch of the first U.S. listed ETF in 1993, SPY, broadened access to tradable passive product; it provided investors en masse with the means to buy and sell a benchmark portfolio as conveniently as any stock. Tradability opens the door to decidedly active behaviors, e.g., market timing. ETFs’ first-order relevance as a trading vehicle is indisputable. They now account for roughly 35%, on average, of daily U.S. equity market turnover, and even more in times of market stress.ii
Relentless proliferation of index-linked products in recent years has further expanded practical usage of the term “passive.” For example, hundreds of U.S.-listed ETFs now slice and dice the equity universe, deliberately diverging from the market portfolio in myriad ways. And despite transparent, rules-based construction and implementation, such index-based vehicles often reflect a host of other active choices, e.g., liquidity and capitalization cutoffs, alternative weighting schemes, rebalancing schedules, turnover and exposure controls. At this point, popular usages of the term “passive” stray far from the canonical form. In thinking about how passive might influence markets, it is helpful to think in terms of investment universe restrictions, rebalancing procedures, tradability, and product proliferation.
Market Consequences Of Passive
We focus on four main themes associated with the growth of passive investing: 1) asset comovement, 2) market fragility, 3) pricing efficiency, and 4) frictions in indexes and tracking products.
Comovement
The financialization of commodities markets in the mid-2000s provides evidence that passive investing can influence comovement among indexed assets. From 2003 through mid-2008, passive investment flooded into multi-commodity index products, motivated by research arguing that the asset class offered significant diversification and an attractive returns premium. Arguably, the flows caused a substantial increase in correlations among index components. Figure 2, for example, shows the pattern for crude and soybeans, two apparently dissimilar commodities that were both members of popular indexes. In contrast, crude’s correlation with orange juice, which was not included in the major indexes, remained little changed.
In equities, there is empirical evidence that stocks with higher degrees of passive ownership exhibit greater comovement with the market. Studies have attributed heightened systematic risk and liquidity in large caps and commonality of trading activity across stocks to the growth in passive investing and index-based trading.iii Recent research suggests that trading in ETFs propagates returns shocks to the funds’ component stocks, increasing correlations among them.iv
Development of the passive product universe may contribute to new manifestations of comovement. Behavioralists have argued that categorization effects – a tendency among investors to form portfolios by first classifying stocks and then allocating across the groups – may induce common factors in returns.v The rapid proliferation of index-based products provides investors with ready means to express views across groups defined on the basis of an increasingly broad variety of attributes.
Figure 2
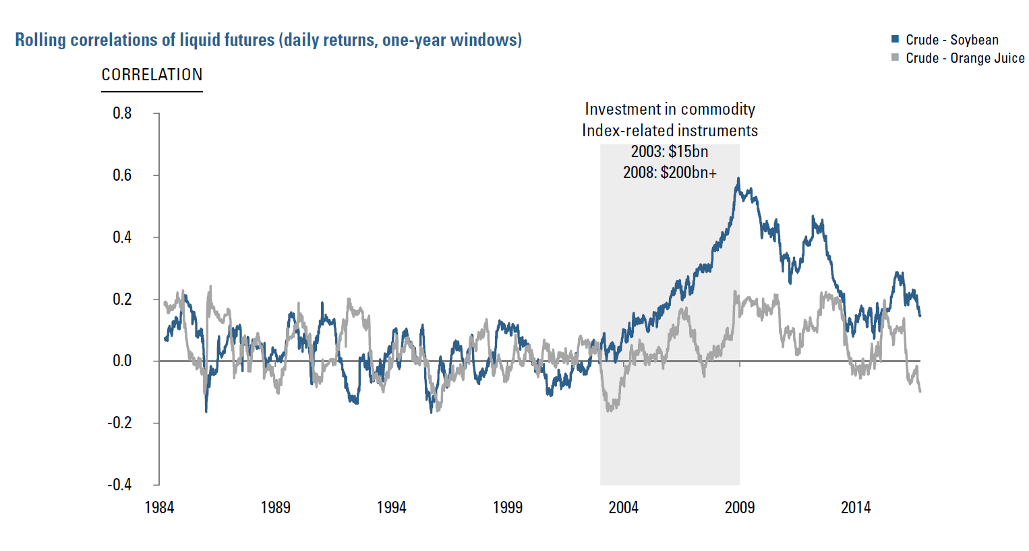
Figure 3
Fragility
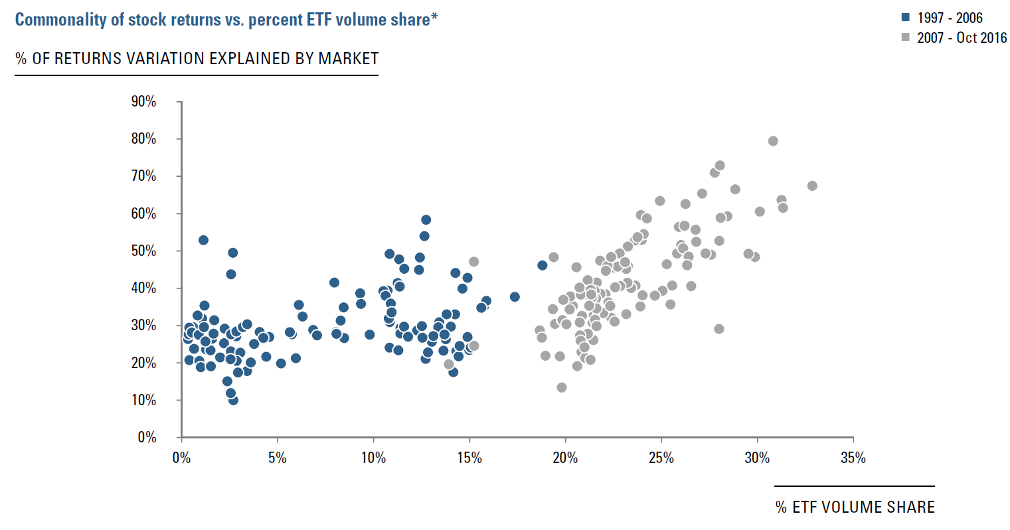
Beyond a generally higher degree of comovement associated with the rise of passive investing over time, there is evidence that the broadened availability of tradable passive product may be increasing market fragility, i.e., increasing risk and severity of dislocations. Figure 3 shows that over the past 10 years (grey dots) increases in ETFs’ share of overall market volume (x-axis) have coincided with material increases in commonality of stock returns (y-axis). In other words, diversification benefits decline precipitously under market conditions that induce large amounts of passive trading. This may reflect herding or other forms of correlated sentiment-driven trading via index-linked vehicles during selloffs and other periods of uncertainty. It is hardly a surprise that under such conditions investors would focus on modulating overall equity market exposure via liquid, index-linked instruments. Interestingly, the blue dots in Figure 3 show that we don’t see such a strong relationship over the prior decade, 1997-2006, perhaps indicating that that ETF activity didn’t yet represent a large enough share of market activity to affect comovement and/or that ETFs hadn’t yet become a vehicle of choice for sentiment-driven traders.
Efficiency
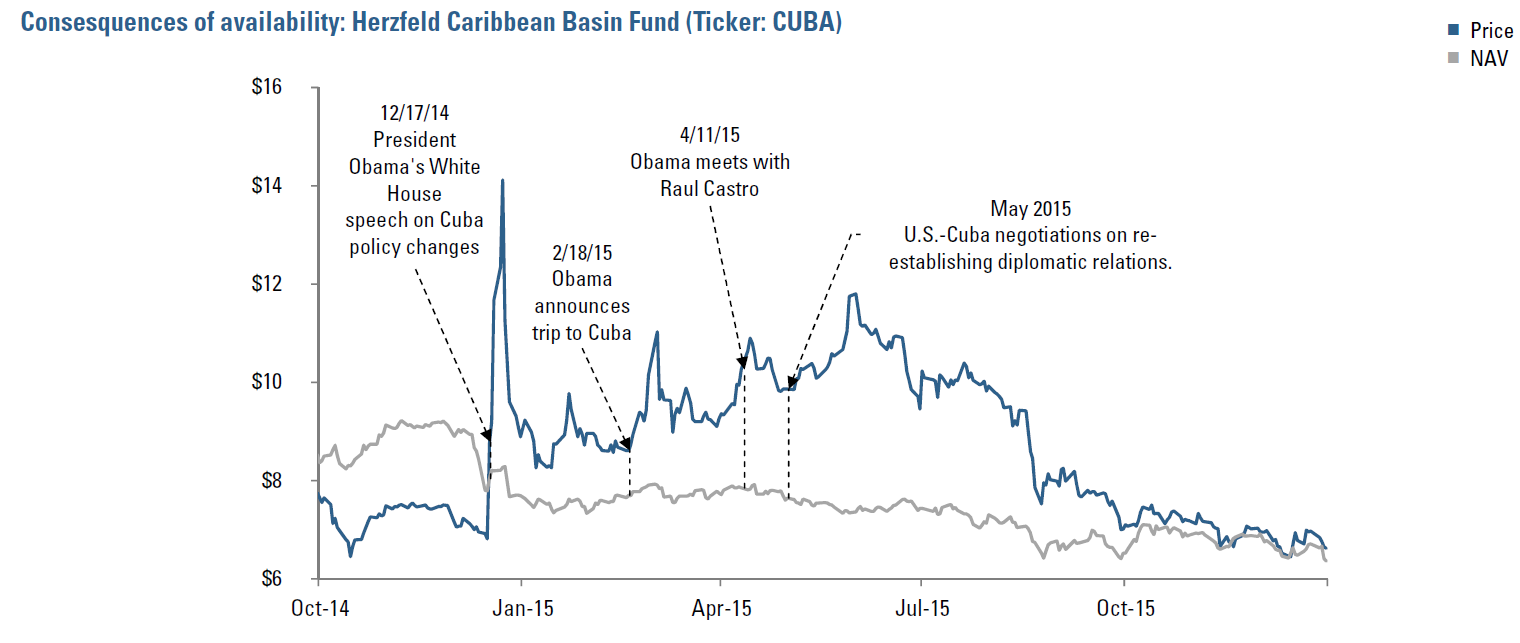
In addition to its effects on risk, the trend towards passive may reshape the opportunity set for active investors. The closed-end fund world offers an instructive example. (Figure 4) In December 2014, the price of the Herzfeld Caribbean Basin Fund (Ticker: CUBA) doubled when President Obama raised the prospect of liberalized relations with Cuba. The price also responded to subsequent promising news flow. But the net asset value, i.e., the weighted average price of the component stocks, hardly budged. Traders looking to immediately capitalize on the headlines seemed to view the fund as the vehicle of choice to implement, perhaps because it was prepackaged, available, and conspicuous. The example suggests that index-based products may draw uniformed speculative or liquidity-driven activity, raising the prospect of sentiment or flow-based mispricings originating at the index level or migrating there from individual stocks.vi
Figure 4
If availability of index-based products siphons focus and flow away from individual stocks, then we may also see knock on effects with respect to micro-efficiency, a possibility that has become a recent focus of academic research. Synchronization of returns among stocks with high passive ownership hints at a relative reduction in the influence of company-specific information in determining prices. More directly, Israeli, Lee, and Sridharan (2016) find that the returns of stocks with higher ETF ownership impound less information about future earnings. They attribute the effect to reduced incentive for active investors to acquire information about such stocks as uninformed trading migrates to the ETF. In commodities, Brogaard, Ringgenberg, and Sovich (2016) find that the surge of investment flows into passive indexes during financialization materially undermined the information content of commodity futures prices, leading commodity-sensitive firms to rely less on price signals in modulating investment and inventories.
Underappreciated Frictions
There is extensive literature evidencing potential frictions and/or valuation distortions associated with changes in index composition. Specifically, the prices of stocks added to popular benchmarks tend to rise prior to their actual inclusion, reflecting expectations of additional demand from funds indexed to them.vii Buying at inflated prices, and, possibly, selling at depressed prices, represents a source of performance drag for both paper indexes and portfolios designed to track them.
Although index frictions have been long documented in popular benchmarks like the S&P 500 and Russell 2000, as the universe of passive products expands, they may arise in contexts where investors do not expect. As an example, an announcement on October 7, 2016 that the S&P 500 Preferred Index would add a lightly traded Bank of America issue two weeks later sent the stock’s price and trading volume soaring, presumably reflecting anticipated buying pressure from a roughly $17bn iShares U.S. Preferred Stock ETF (PFF) based on the index.1,viii,ix (In fact, the price collapsed below pre-announcement levels the day following the actual addition as the demand failed to materialize or, at the very least, was overestimated.) As well, some index-based strategies generate materially larger changes in composition than a typical cap-weighted portfolio. The November 2013 rebalance of the MSCI ACW Momentum index, for example, saw North America’s weight rise from 39% to 64%! Turnover controls designed to limit trading frictions might have knock-on effects that are difficult to trace, such as reduced exposure to desired factors and/or increased unintended risks.
Implications For Asset Owners And Investors
Investment Universe: Embrace Breadth And Structure
Index-based products often have restricted investment universes, e.g., stocks in a cap-weighted benchmark. Such limitations have costs, and active approaches should seek to exploit the full available investment universe. Low-volatility investing in the first part of 2016 offers an instructive example. Despite evidence at the time of rising average low-vol valuations and a premium associated with benchmark low-vol indexes, a topic well covered by the financial press, in the full equity universe, high- and low-beta 25th percentile valuations looked similar. In other words, managers who were willing to make use of the entire equity universe had considerable flexibility to form low-volatility portfolios with attractive valuations.
What’s more, to the extent that passive ownership influences stock comovement and pricing efficiency, it likely will become an increasingly valuable feature of the investment universe topography to map. There is considerable dispersion in passive ownership across stocks, suggesting benefit from explicitly factoring that variation into return models and risk management. In addition to the overall level, the nature of passive ownership may matter too, e.g., tradable ETFs vs. long-horizon mutual funds. As well, the relevant structure of the investment universe may become more dynamic, as development of new index-linked products may induce new common factors in risk and return.
The Search For Alpha: Adapt or Atrophy
In the search for alpha, the rise of passive may call for adaptation in several respects. If availability of index-based products induces uninformed trading at the group level and/or siphons focus from individual stocks’ fundamentals, then sentiment-based mis-pricings could become more prevalent. Flow-based signals could become increasingly important in both generating alpha and managing risk (e.g., crowding). The dynamics of active management might change as well, requiring greater patience from investors and managers; sentiment-driven misvaluations may persist. We might also see returns premia migrate from the individual stock to the group level, an intriguing prospect for value in light of ongoing academic discussion regarding stock versus industry effects. Active managers should monitor for trends in the pricing environment and invest in R&D accordingly.
Allocation/Risk Management: Vulnerabilities For Simplistic Approaches
The rise of passive presents new challenges for allocation and risk management. Increased prevalence of systematic factors in flows, returns, and liquidity may impede diversification and diminish the market’s ability to absorb shocks or uncertainty without disruption. As well, the ready availability of ETFs has provided scared investors with a convenient instrument to rapidly reduce equity exposure upon signs of stress (more accessible than futures and options), possibly accentuating the risk of herding.
Such challenges underscore the value of a well integrated allocation framework that combines a rich risk forecasting model, sensitivity to liquidity conditions, and macro indicators, valuations, and sentiment to assess how the market is pricing risk. In contrast, a purely risk-based allocation approach that narrowly focuses on simplistic metrics such as recent realized volatility or the VIX likely will be insufficient in this environment.
Passive Strategies: Evaluate Them As If They’re Active
The increasingly expansive definition of “passive” emphasizes the value of adopting a systematic, active perspective in analyzing any investment approach. Almost all instantiations of passive investing concepts have active characteristics, at the most basic level associated with selection of the investment universe and implementation frictions. But as an increasingly diverse range of strategies are classified as passive, potential tradeoffs involved in their specification and implementation may not be readily apparent. For example, a cap on turnover may accomplish the stated goal of reducing transaction costs, but at the expense of exposure to a market or a targeted characteristic. Viewing all strategies through the lens of an unrestricted systematic, active investment process offers a comprehensive and consistent framework to evaluate and compare alternatives.
Conclusion
The rise of passive is not a singular, simple trend. It likely reflects the confluence of several factors, including regulatory and tax changes, relentless technological evolution that has enabled basket trading and commoditized index formulation, growing availability and comparability of fund performance data, and 35 years of interest rate declines that have pressured savers to seek higher returns in equities. In light of those complexities, it is a challenge to isolate market impacts specifically attributable to whatever we might specifically define as passive investing.
But change is not new; the investing environment has always undergone continual transformation. And we have solid reason to believe that investors’ behavioral biases and markets’ idiosyncratic structures will continue to create opportunities to generate superior risk-adjusted returns. But constant change puts a premium on approaches that seek to identify the deeply rooted sources of mispricings and common risk factors and that adapt to changes in their expression. On the other hand, rigid strategies born from backtests, tuned to capture past patterns, may disappoint.
Selected References
Nicholas Barberis, Shleifer, Andrei, and Wurgler, Jeffrey, Comovement, Journal of Financial Economics, 2005, 283-317.
Nicholas Barberis and Wurgler, Jeffrey, Style Investing, Journal of Financial Economics, 2003, 161-199.
Utpal Bhattacharya, Loos, Benhamin, Meyer, Steffen, and Hackethal, Andreas, Abusing ETFs, Working Paper, July 2016.
Jonathan Brogaard, Ringgenberg, Matthew, and Sovich, David, The Economic Impact of Index Investing, Working Paper, Washington University in St. Louis, May 2016.
Markus Broman and Shum, Pauline, Does Liquidity Encourage Short-Term Trading Evidence from Exchange Traded Funds, October 2016.
Itzhak Ben David, Franzoni, Francesco, and Moussawi, Rabih, Do ETFs Increase Volatility?, Fisher College of Business Working Paper Series, October 2014.
Ing-Haw Cheng, Kirilenko, Andrei, and Xiong, Wei, Convective Risk Flows in Commodity Futures Markets, Working Paper, March 2014.
Martijn Cremers, Petajisto, Antti, and Zitzewitz, Eric, Should Benchmark Indices Have Alpha? Revisiting Performance Evaluation, Critical Finance Review, 2012, 2:1-48.
Zhi Da and Shive, Sophie, Exchange Traded Funds and Asset Returns Correlations, Working Paper, March 2016.
R. Jared DeLisle, French, Dan, and Schutte, Maria Gabriela, Comovement, Passive Investing, and Price Informativeness, Working Paper, July 2015.
Sina Ehsani and Lien, Donald, Effects of Passive Intensity on Aggregate Price Dynamics, Working Paper, August 2014. (Since published in Financial Review, 2015.)
Gary Gorton and Rouwenhorst, K. Geert, Facts and Fantasies about Commodity Futures, National Bureau of Economic Research Working Paper 10595, June 2004.
Robert Greer, The Nature of Commodity Index Returns, The Journal of Alternative Investments, Summer 2000.
Avraham Kamara, Xiaoxia, Lou, Sadka, Ronnie, Has the U.S. Stock Market Become More Vulnerable Over Time?, Working Paper, May 13, 2009.
Avraham Kamara, Xiaoxia, Lou, Sadka, Ronnie, The Divergence of Liquidity Commonality in the Cross-Section of Stocks, Working Paper, October 25, 2007.
Randall Morck, Yang, Fan, The Mysterious Growing Value of S&P 500 Membership, Working Paper, 2002.
Antti Petajisto, The Index Premium and Its Hidden Cost for Index Funds, Journal of Empirical Finance, 18, 2011, 271-288.
Rodney Sullivan and Xiong, James, How Index Trading Increases Market Vulnerability, Financial Analysts Journal, Volume 68, Number 2, 2012
Ke Tang and Xiong, Wei, Index Investment and the Financialization of Commodities, Financial Analysts Journal, Volume 68, Number 6, 2012.
Jeffrey Wurgler, On the Economic Consequences of Index-Linked Investing, in W. T. Allen, Khurana, R., Lorsch, J., and Rosenfeld, G. (Editors), Challenges to Business in the Twenty-First Century: The Way Forward, Cambridge: American Academy of Arts and Sciences, 2011.
Endnotes
- This security is mentioned for illustrative purposes only and should not be considered a recommendation to buy or sell.
- There is modest variation in data across sources, presumably reflecting variation in the definition of “passive,” which, as discussed throughout this note, is a meaningful source of ambiguity.
- This approximation reflects ETFs on non-equity underlyings, such as the VIX and Treasuries.
- See, for example, Kamara, Lou, Sadka (2007, 2009) and Sullivan and Xiong (2012).
- See, for example, Da and Shive (2016).
- See Barberis and Wurgler (2003) and Barberis, Shleifer, and Wurgler (2005).
- See, for example, Broman and Shum (2016) and Bhattacharya, Loos, Meyer, and Hackethal (2016).
- Similarly, stocks being removed tend to fall prior to deletion.
- AUM as of 19-Jan-17. Source: Bloomberg.
- PFF was not actually obligated to incorporate the stock into its portfolio. The ETF employs “representative sampling” of securities in managing the fund. See iShares U.S. Preferred Stock ETF, 2016 Prospectus, August 1, 2016.
- See Beta, Indexing, and Valuations, Acadian Asset Management, May 2016 and A Bubble in Low-Vol Stocks or Low-Vol Indices?, September 2016.
Legal Disclaimer
These materials provided herein may contain material, non-public information within the meaning of the United States Federal Securities Laws with respect to Acadian Asset Management LLC, Acadian Asset Management Inc. and/or their respective subsidiaries and affiliated entities. The recipient of these materials agrees that it will not use any confidential information that may be contained herein to execute or recommend transactions in securities. The recipient further acknowledges that it is aware that United States Federal and State securities laws prohibit any person or entity who has material, non-public information about a publicly-traded company from purchasing or selling securities of such company, or from communicating such information to any other person or entity under circumstances in which it is reasonably foreseeable that such person or entity is likely to sell or purchase such securities.
Acadian provides this material as a general overview of the firm, our processes and our investment capabilities. It has been provided for informational purposes only. It does not constitute or form part of any offer to issue or sell, or any solicitation of any offer to subscribe or to purchase, shares, units or other interests in investments that may be referred to herein and must not be construed as investment or financial product advice. Acadian has not considered any reader's financial situation, objective or needs in providing the relevant information.
The value of investments may fall as well as rise and you may not get back your original investment. Past performance is not necessarily a guide to future performance or returns. Acadian has taken all reasonable care to ensure that the information contained in this material is accurate at the time of its distribution, no representation or warranty, express or implied, is made as to the accuracy, reliability or completeness of such information.
This material contains privileged and confidential information and is intended only for the recipient/s. Any distribution, reproduction or other use of this presentation by recipients is strictly prohibited. If you are not the intended recipient and this presentation has been sent or passed on to you in error, please contact us immediately. Confidentiality and privilege are not lost by this presentation having been sent or passed on to you in error.
Acadian’s quantitative investment process is supported by extensive proprietary computer code. Acadian’s researchers, software developers, and IT teams follow a structured design, development, testing, change control, and review processes during the development of its systems and the implementation within our investment process. These controls and their effectiveness are subject to regular internal reviews, at least annual independent review by our SOC1 auditor. However, despite these extensive controls it is possible that errors may occur in coding and within the investment process, as is the case with any complex software or data-driven model, and no guarantee or warranty can be provided that any quantitative investment model is completely free of errors. Any such errors could have a negative impact on investment results. We have in place control systems and processes which are intended to identify in a timely manner any such errors which would have a material impact on the investment process.
Acadian Asset Management LLC has wholly owned affiliates located in London, Singapore, and Sydney. Pursuant to the terms of service level agreements with each affiliate, employees of Acadian Asset Management LLC may provide certain services on behalf of each affiliate and employees of each affiliate may provide certain administrative services, including marketing and client service, on behalf of Acadian Asset Management LLC.
Acadian Asset Management LLC is registered as an investment adviser with the U.S. Securities and Exchange Commission. Registration of an investment adviser does not imply any level of skill or training.
Acadian Asset Management (Singapore) Pte Ltd, (Registration Number: 199902125D) is licensed by the Monetary Authority of Singapore. It is also registered as an investment adviser with the U.S. Securities and Exchange Commission.
Acadian Asset Management (Australia) Limited (ABN 41 114 200 127) is the holder of Australian financial services license number 291872 ("AFSL"). It is also registered as an investment adviser with the U.S. Securities and Exchange Commission. Under the terms of its AFSL, Acadian Asset Management (Australia) Limited is limited to providing the financial services under its license to wholesale clients only. This marketing material is not to be provided to retail clients.
Acadian Asset Management (UK) Limited is authorized and regulated by the Financial Conduct Authority ('the FCA') and is a limited liability company incorporated in England and Wales with company number 05644066. Acadian Asset Management (UK) Limited will only make this material available to Professional Clients and Eligible Counterparties as defined by the FCA under the Markets in Financial Instruments Directive, or to Qualified Investors in Switzerland as defined in the Collective Investment Schemes Act, as applicable.