
Passive Investing and Quant Efficacy
Key Takeaways
- This paper presents a novel analysis of the relationship between passive ownership and the efficacy of quantitative investing signals.
- We find that passive investing may be modestly reducing the short-term efficacy of active factor-oriented strategies, perhaps by slowing down the convergence of mispricings. These results are consistent with a hypothesis that passive is diverting assets from fundamentally-informed investing.
- We see more pronounced effects associated with faster factors, suggesting that the “rise of passive” may have less impact on fundamentally-oriented, lower-frequency approaches than on technically-focused, higher-frequency strategies.
Table of contents
September 2018
Despite the wave of headlines devoted to the “rise of passive,” the trend’s effects on market behavior remain poorly understood. That ambiguity has further fueled the hype by preserving the plausibility of provocative yet unproven narratives, including warnings of valuation distortions due to robotic flows into passive vehicles, rationalizations of stock pickers’ poor performance, and even proclamations of the impending death of active management.
As a quantitative active manager, we have natural interest in understanding how passive investing may affect our opportunity set and the efficacy of our signals. In this note, we lay out competing hypotheses about passive’s effects based on two contrasting assumptions regarding the source of passive flows. We evaluate them by exploiting cross-sectional variation in stocks’ passive ownership.
We find evidence that passive investing is modestly reducing the short-term efficacy of active, factor-oriented strategies by slowing down the convergence of mispricings. These results are consistent with a view that the rise of passive largely represents a “dumbing down” of investment activity in a way that might exacerbate mispricings but also increase their persistence. They are not consistent with a hypothesis that passive represents a diversion of assets away from unsophisticated investors who were actually exacerbating inefficiencies, which, if true, might represent a threat to the active opportunity set. The results also suggest that the impacts of passive are limited for scalable, lower-frequency investment processes, like Acadian’s. Impacts appear more pronounced for “faster” signals that generate higher turnover.
How Might Passive Affect Active?
Passive’s impact on the performance of quantitative signals should depend on the source and nature of passive flows. One possibility would be that the rise of passive reflects a shift of AUM away from investing approaches that are sensitive to fundamentals and help to prevent or correct mispricings. If so, then we might expect passive’s growth to increase the number and degree of mispricings and to expand the opportunity set for active investors who remain. But the impact on the efficacy of quantitative signals wouldn’t be clear. If convergence of mispricings to fundamental value were unaffected by the trend, then signal efficacy might remain unchanged. But if an increase in fundamentally insensitive flows and a reduction of capital allocated to harvesting inefficiencies delayed the correction of mispricings, then we might see reduced short-term efficacy of fundamentally based quantitative signals.
A second possibility is that the growth of passive represents a reallocation of assets away from naive forms of active investing that were actually exacerbating market inefficiency. That might reduce the opportunity set for more sophisticated active investors and diminish the efficacy of quantitative signals, even over longer horizons.
Testing The Alternatives
Ideally, we’d be able to evaluate passive’s impact by comparing the efficacy of quantitative signals in otherwise identical markets with disparate levels of passive investing. That’s not possible, of course. As an alternative, most discussions around the topic try to associate the gradual time trend in aggregate passive flows or market share with various effects. But such analyses have poor ability to discern impacts of passive investing’s growth. They have, in effect, only a few data points from which to draw inferences, and it’s difficult to isolate passive’s effects from those of all kinds of other concurrent trends.
For our analysis, we instead exploit stock-level information on passive ownership, which greatly increases the amount of data that we can bring to bear in testing for its effects. But doing so is quite a departure from the ideal “controlled experiment” described above. Stocks differ with respect to many attributes that may be related to passive ownership, such as liquidity and market capitalization, so if we want to isolate the incremental impact of passive ownership on signal efficacy, then we must control for such characteristics. In the analyses that follow, we also control for certain technical and risk factors.1
As our measure of passive ownership, for each stock in a developed markets (DM) universe we calculate the fraction of market capitalization held by passive institutions as reflected in consolidated global holdings of mutual funds and institutional investment managers’ 13(f) filings as sourced from the Thomson Reuters Global Ownership OP database (TR). TR categorizes ownership as passive or active at the institutional rather than the fund or account level, which introduces noise into the estimates.2
Most discussions of passive’s market share focus on U.S.- domiciled mutual funds, because that data is most readily available. In our sample, which is broader, we find that roughly 65% of the passive holdings derives from 13(f) filings, while the remaining 35% comes from mutual fund reports. Our data primarily reflects holdings of investment managers based in North America and the U.K., with relatively sparse information from other regions.3
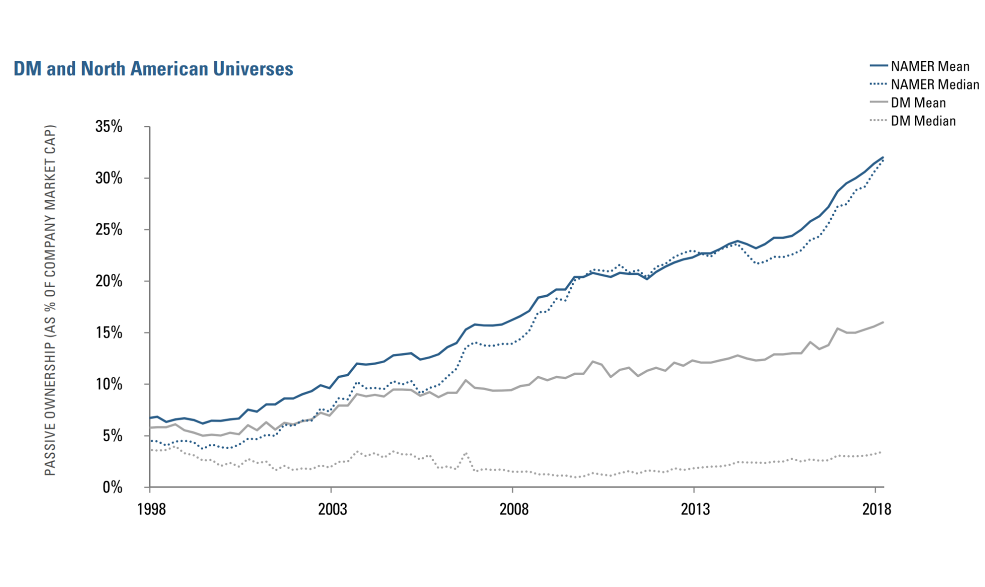
Figure 1 highlights the evolution of passive ownership levels among stocks since 1998, when the data starts to appear reliable. The chart suggests that by 2018 about 30% of the typical North American stock was owned by passive mutual funds and institutional managers.4 In our sample, we observe that by March 2018 roughly 80% of U.S. stocks had non-zero passive ownership, versus 52% in developed markets more broadly (including the U.S.).
Figure 1: Passive Ownership – Institutional Investors Plus Mutual Funds
Results
Figure 2 highlights the ex-post efficacy of our bottom-up stock return forecasts across the DM and North American universes and the impact of passive ownership. The ex-ante alphas combine contributions from Acadian’s proprietary value, quality, growth, and technical factor groups. To clarify interpretations, we have simplified calculation of the alphas relative to our production models, basing the forecasts on a one-month investment horizon and omitting certain adjustments. As noted above, to better isolate the incremental impact of passive ownership, the regressions underlying the analysis include controls for a host of variables, including firm size, risk, liquidity, and technical attributes.
The table’s first column shows that in the cross-section of the DM universe from 1998-2018, an incremental 1% of forecasted alpha has been associated, on average, with a 1.07% increase in realized return over the following month. This is strong evidence of the short-run cross-sectional efficacy of our bottom-up forecasts. But the second row shows that this ex-post payoff to alpha diminishes somewhat as passive ownership increases.
Specifically, for a stock with passive ownership of one standard deviation above the mean, the ex-post return per 1% of forecasted alpha drops by 0.05%. Summarizing in relative terms, higher levels of passive ownership reduce ex-post alpha efficacy on the order of 5%.
Column 2 shows that passive’s impact appears to have strengthened over time, rising to roughly 9% in relative terms (0.08%/0.95%) over the past decade. Figure 3, which charts cumulative returns to alpha assuming varying degrees of passive ownership (blue: none; red: +1 std. dev.; grey: -1 std. dev.), shows that the effect became more pronounced following the GFC, a period of substantial growth in passive investing in North America, as shown in Figure 1.
Returning to Figure 2, columns 3 and 4 show that the short-term interaction effect appears more pronounced in North America, over the past decade reaching 20% on a relative basis (0.18%/0.91%). This might reflect higher overall levels of passive ownership or more complete reporting in North America. It might also reflect regional variation in the actual composition of what has been classified as “passive.”
Figure 2: Passive’s Impact on Ex-Post Alpha Efficacy (1-Month Horizon)
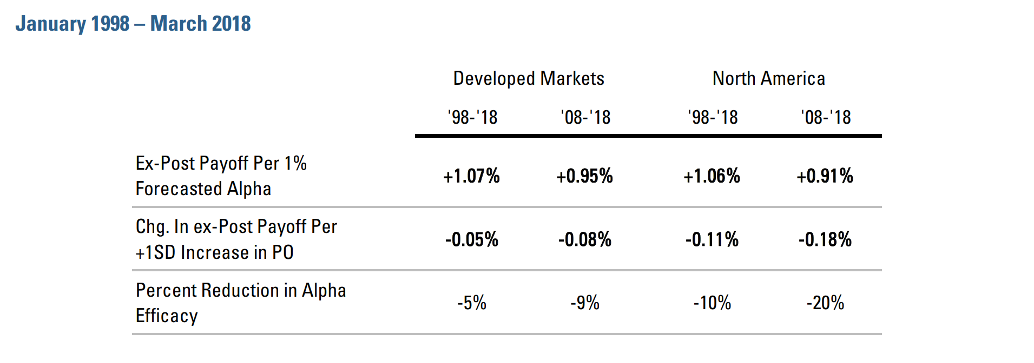
Figure 3: Cumulative Impact of Passive Ownership on 1M Payoff to Alpha
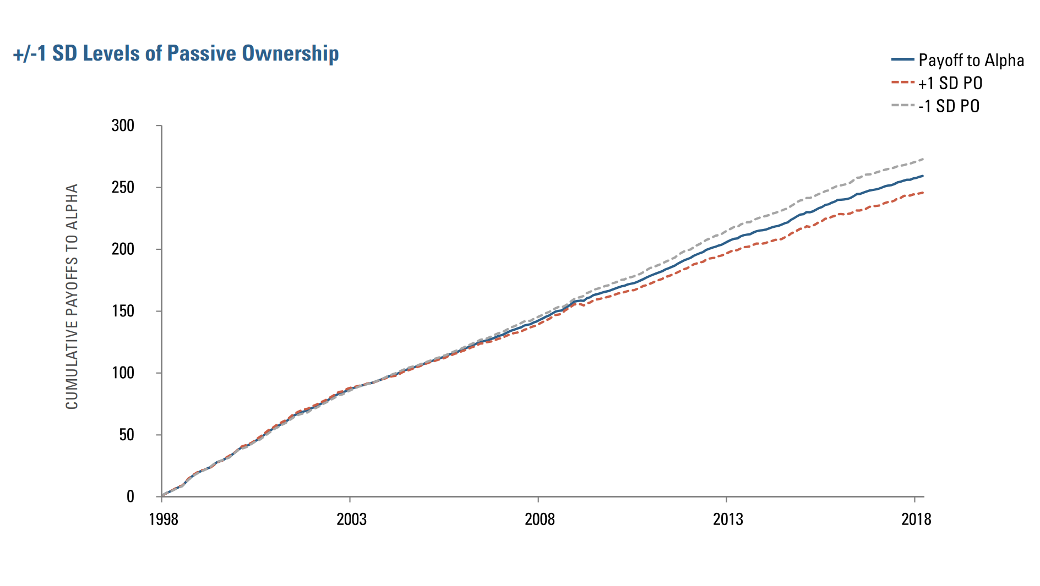
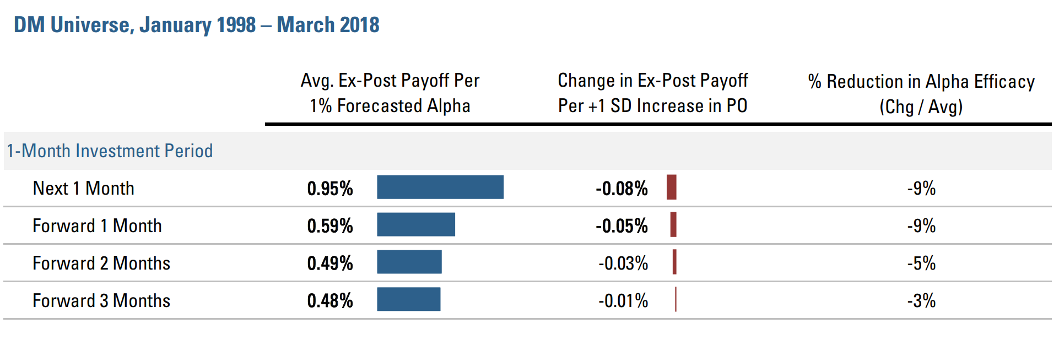
Figure 4: Passive’s Impact on Alpha Efficacy – By Investment Horizon
Source: Acadian. In columns 1 and 2, bolded values indicate statistical significance at conventional levels. Regression specifications are consistent with those described in Figure 3. Please contact us for further details. This hypothetical analysis is being provided for illustrative purposes only. Past results are not indicative of future results. Every investment program has an opportunity for loss as well as profit.
The competing hypotheses regarding the nature and sources of passive flows generate testable predictions regarding passive’s impact on alpha efficacy over different investment horizons. Figure 4 highlights results for the DM universe over the past 10 years, showing that the interaction becomes economically negligible and statistically insignificant when the investment horizon is pushed forward even just a few months. Specifically, while the alphas demonstrate considerable ability to predict returns in the cross section several months into the future (looking down column 1), passive’s impact on alpha efficacy diminishes fairly rapidly (columns 2 and 3). It is no longer statistically significant for 1 month returns, forward 2 months. Results for North America are broadly similar (unreported).
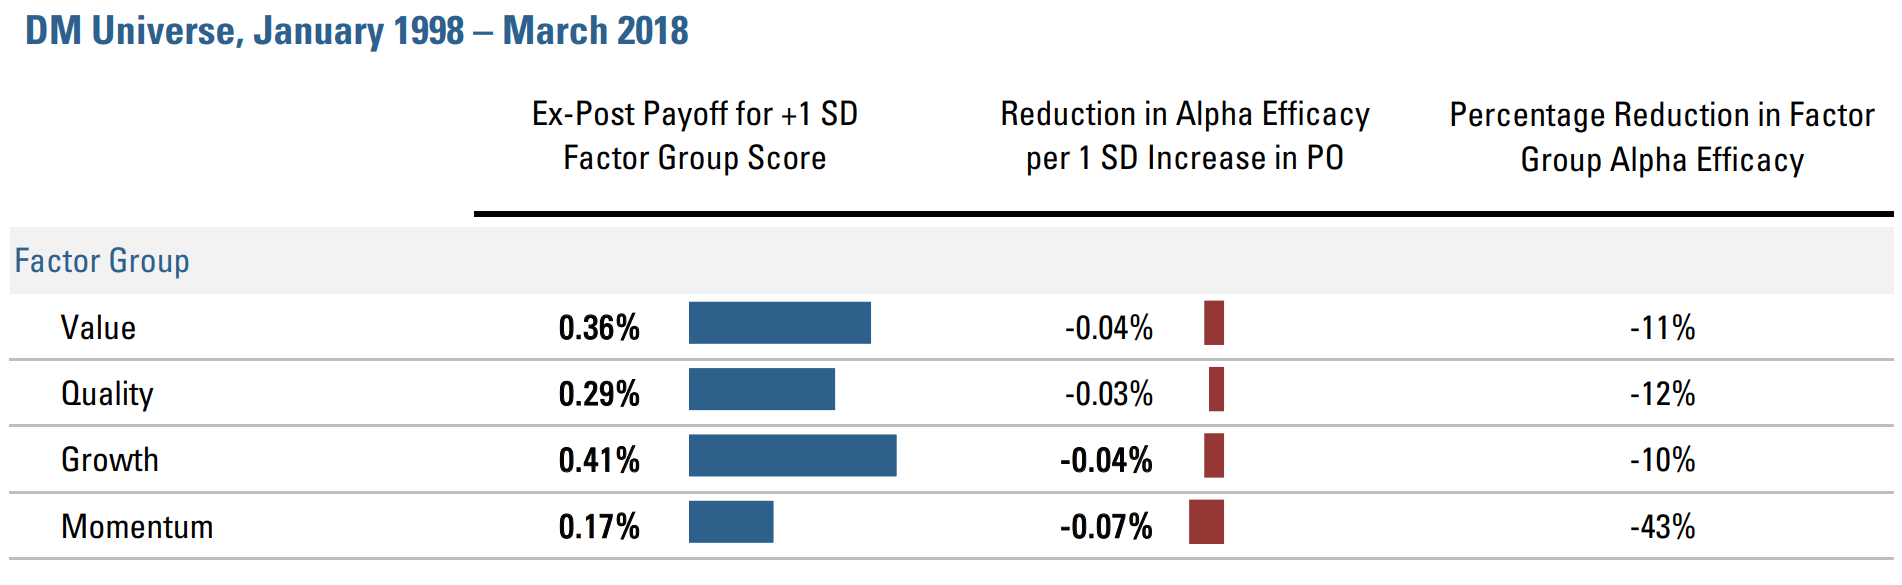
Figure 5: Passive’s Impact on Alpha Efficacy – Attribution to Factor Groups
These results are inconsistent with the hypothesis that the rise of passive is improving market efficiency by diverting assets away from unsophisticated active investors that were exacerbating mispricings. If that were the case, we would expect persistent degradation of alpha efficacy, reflective of a reduction in mispricings. Instead, Figure 4 suggests that higher levels of passive ownership impede correction of mispricings in the short-run but have less effect over longer horizons. That would be consistent with passive investing delaying the incorporation of fundamentally relevant information into prices over relatively short horizons.
Figure 5 provides further evidence in favor of this interpretation, showing that passive ownership has greater impact on the efficacy of faster factors. Specifically, momentum and growth factors (e.g., analyst revisions, analyst recommendation changes, and earnings surprises) appear to be more negatively affected by higher levels of passive ownership than value and quality. The interaction of passive ownership with value isn’t statistically significant in either DM or North American universes over the full sample period or the past decade.
Conclusion
The results suggest that passive investing may be influencing the performance of active strategies. The picture that emerges favors a view that the rise of passive reflects a shift away from fundamentally informed investing that might even increase inefficiency but somewhat delay the correction of mispricings. That interpretation would be broadly consistent with empirical evidence that higher levels of indexation and ETF ownership reduce the information content of prices and that trading of ETFs generates non-fundamentally based demand shocks for the stocks that they hold.5
Pragmatically speaking, the impact of passive on forecast efficacy appears statistically relevant but modest, roughly similar to our bottom-up alphas’ interaction with market capitalization and trading volume. The results highlighting passive ownership’s relatively pronounced impact on faster factors suggest that the effects of the “rise of passive” may be smaller for fundamentally oriented, lower-frequency approaches like Acadian’s, than for technically focused, higher-frequency strategies.
Endnotes
- Specifically, in the cross-sectional regressions of ex-post returns on alpha and its interaction with passive ownership, we include controls for ADV, bid/ask spreads, market cap as well as their interactions with ex-ante alpha. We also control for beta and certain technical effects. We include a control for passive ownership on a standalone basis (not interacted with alpha), because we’re interested in how passive ownership affects the ex-post payoff per incremental increase in ex-ante alpha rather than on how passive ownership is related to ex-post returns, per se.
- We are also implicitly ignoring the material question of whether strategies or instruments that are commonly classified as passive actually embed substantial active characteristics (e.g., smart beta) or may be actively traded (e.g., broad-market ETFs). For further discussion, please see our January 2017 paper, “Passive Investing: Reshaping Financial Markets?”
- Form 13(f) requires all institutions with investment discretion over $100 million or more to report their long holdings as of the end of calendar quarters. These reports also include holdings of non-U.S. 13(f) eligible securities by U.S.-based institutions and holdings of US 13(f) eligible securities by non-U.S. investment managers required to report. Aggregate mutual fund holdings in the TR OP database reflect holdings of both U.S. and non-U.S. securities by mutual funds domiciled mainly in the U.S., U.K., and Canada, but we also see a few passively managed funds based in Germany, Sweden, France, and South Africa. In cases where the owner reports the holdings of the same security both under “Agg MF” and 13f, we pick the source with the largest reported dollar amount.
- That number appears reasonably consistent with levels of passive ownership attributed only to U.S. mutual funds and ETFs in many media and practitioner reports.
- See Ben-David et al., “Do ETFs Increase Volatility?”, Working Paper, 2017; Israeli et al, “Is there a Dark Side to Exchange Traded Funds (ETFs)? An Information Perspective,” Working Paper, 2016; Brogaard et al, “The Economic Impact of Index Investing,” Working Paper, 2016.
Legal Disclaimer
These materials provided herein may contain material, non-public information within the meaning of the United States Federal Securities Laws with respect to Acadian Asset Management LLC, Acadian Asset Management Inc. and/or their respective subsidiaries and affiliated entities. The recipient of these materials agrees that it will not use any confidential information that may be contained herein to execute or recommend transactions in securities. The recipient further acknowledges that it is aware that United States Federal and State securities laws prohibit any person or entity who has material, non-public information about a publicly-traded company from purchasing or selling securities of such company, or from communicating such information to any other person or entity under circumstances in which it is reasonably foreseeable that such person or entity is likely to sell or purchase such securities.
Acadian provides this material as a general overview of the firm, our processes and our investment capabilities. It has been provided for informational purposes only. It does not constitute or form part of any offer to issue or sell, or any solicitation of any offer to subscribe or to purchase, shares, units or other interests in investments that may be referred to herein and must not be construed as investment or financial product advice. Acadian has not considered any reader's financial situation, objective or needs in providing the relevant information.
The value of investments may fall as well as rise and you may not get back your original investment. Past performance is not necessarily a guide to future performance or returns. Acadian has taken all reasonable care to ensure that the information contained in this material is accurate at the time of its distribution, no representation or warranty, express or implied, is made as to the accuracy, reliability or completeness of such information.
This material contains privileged and confidential information and is intended only for the recipient/s. Any distribution, reproduction or other use of this presentation by recipients is strictly prohibited. If you are not the intended recipient and this presentation has been sent or passed on to you in error, please contact us immediately. Confidentiality and privilege are not lost by this presentation having been sent or passed on to you in error.
Acadian’s quantitative investment process is supported by extensive proprietary computer code. Acadian’s researchers, software developers, and IT teams follow a structured design, development, testing, change control, and review processes during the development of its systems and the implementation within our investment process. These controls and their effectiveness are subject to regular internal reviews, at least annual independent review by our SOC1 auditor. However, despite these extensive controls it is possible that errors may occur in coding and within the investment process, as is the case with any complex software or data-driven model, and no guarantee or warranty can be provided that any quantitative investment model is completely free of errors. Any such errors could have a negative impact on investment results. We have in place control systems and processes which are intended to identify in a timely manner any such errors which would have a material impact on the investment process.
Acadian Asset Management LLC has wholly owned affiliates located in London, Singapore, and Sydney. Pursuant to the terms of service level agreements with each affiliate, employees of Acadian Asset Management LLC may provide certain services on behalf of each affiliate and employees of each affiliate may provide certain administrative services, including marketing and client service, on behalf of Acadian Asset Management LLC.
Acadian Asset Management LLC is registered as an investment adviser with the U.S. Securities and Exchange Commission. Registration of an investment adviser does not imply any level of skill or training.
Acadian Asset Management (Singapore) Pte Ltd, (Registration Number: 199902125D) is licensed by the Monetary Authority of Singapore. It is also registered as an investment adviser with the U.S. Securities and Exchange Commission.
Acadian Asset Management (Australia) Limited (ABN 41 114 200 127) is the holder of Australian financial services license number 291872 ("AFSL"). It is also registered as an investment adviser with the U.S. Securities and Exchange Commission. Under the terms of its AFSL, Acadian Asset Management (Australia) Limited is limited to providing the financial services under its license to wholesale clients only. This marketing material is not to be provided to retail clients.
Acadian Asset Management (UK) Limited is authorized and regulated by the Financial Conduct Authority ('the FCA') and is a limited liability company incorporated in England and Wales with company number 05644066. Acadian Asset Management (UK) Limited will only make this material available to Professional Clients and Eligible Counterparties as defined by the FCA under the Markets in Financial Instruments Directive, or to Qualified Investors in Switzerland as defined in the Collective Investment Schemes Act, as applicable.