
Managed Volatility Strategies and Long-Short Equity: Similar Paths to Alternative Returns
Table of contents
November 2016
This note compares equity long-short hedge funds and managed volatility strategies. Over the past 15+ years, both approaches have provided investors with lower volatility and smaller drawdowns than the cap-weighted benchmark. Managed volatility, however, may appeal to investors seeking less complex, more liquid, more transparent, and lower fee strategies. And in the context of a broader equity portfolio, a simple historical analysis highlights that managed volatility may complement a hedge fund allocation.
Background
Interest in hedge funds soared over the past 20 years as investors sought diversifying strategies with particular focus on downside protection in tumultuous markets. As well, the concept of freeing a skilled manager from traditional fund constraints to focus on delivering high absolute returns and motivating her with performance fees has obvious appeal. But some hedge fund strategies have drawbacks, including lack of transparency in the investment process, complexity of investment instruments and attendant risks, and high management fees.
For investors who are sensitive to such considerations, managed volatility strategies may provide an appealing alternative approach to lower-risk, diversifying investing. Like equity hedge funds, managed volatility strategies focus on absolute performance compared to cap-weighted benchmarks (i.e., Sharpe ratio rather than Information ratio). Specifically, they seek to generate similar average returns but with lower risk. Lower volatility translates similar-to-benchmark average returns into even higher compounded performance over time. Empirical work (guided by intuition) has provided evidence as to the robustness of the “low volatility” mispricing over time and across markets.*
Comparing Attributes
Managed volatility strategies are fully-invested, 100% long equity portfolios that target low absolute risk. Active implementations, generally speaking, are not referenced to a cap-weighted index; they draw from a broad universe of stocks and are largely unconstrained with respect to style, size, and sector allocations, so factor exposures may vary through time.
As a relevant comparison, we focus on long-short equity hedge funds. This class of investments encompasses strategies that may range broadly in terms of investment process (quant or fundamental), use of derivatives, sector concentration, net market exposure, leverage, portfolio market capitalization, etc.
Managed volatility strategies and hedge funds share similar performance objectives. They’re both designed to maximize risk-adjusted return without reference to a cap-weighted benchmark. With respect to risk, they target lower-volatility and lower-beta portfolios than cap-weighted indices, and they’re designed to provide diversification, e.g., a returns stream with lower correlation to traditional equity portfolios.
But the vehicles that these two classes of strategies employ are quite different. While managed volatility is a relatively straightforward, purely long-only equity portfolio, hedge funds typically hold a mix of long and short equities, cash, and possibly derivatives, which may involve counterparty exposure. Managed volatility strategies are liquid, with daily pricing and, typically, daily liquidity. By comparison, hedge funds often provide only monthly marks and may impose lock-ups, gates, and other redemption restrictions. As well, managed volatility fees are typically in the 0.5% range, whereas 1% management and 20% performance fee arrangements are still common among hedge funds.
Comparing Risk and Return
How has performance of managed volatility and long-short hedge funds, in aggregate, compared over time? We analyze three series of monthly returns:
- The HFRX Equity Hedge index (HFRX EH): an average net-of-fee, USD returns stream from a global sample of equity hedge funds.1
- A simulated managed volatility portfolio (SMV): a hypothetical, net-of-fee actively managed long-only equity strategy that creates a low-risk portfolio using stocks from the world’s developed markets.2*
- The MSCI World index (MW), representing a cap-weighted benchmark portfolio of global developed market stocks.3
Table 1 presents summary statistics from January 1999 through June 2016. Among the highlights, simulated managed volatility realized a higher average return than hedge funds and the cap-weighted benchmark (10.6%, 4.7%, and 5.4%, respectively). In terms of risk, SMV and HFRX EH both exhibited considerably lower volatility than MW (10.1%, 7.9%, 15.5%) and much smaller drawdowns. Putting return and risk together to compare risk-adjusted performance, the Sharpe ratio of SMV exceeds those of HFRX EH and MW (0.86, 0.36, 0.23). Although hedge funds offered the lowest volatility, SMV benefited not only from both the dampened volatility relative to the cap-weighted benchmark but also the highest absolute returns over the analysis period.
Table 1
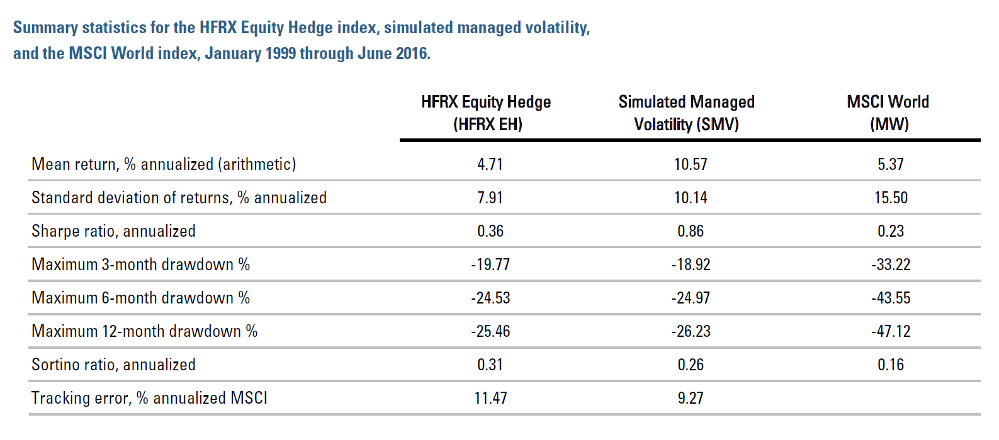
See end notes and disclosures for full descriptions of the three return series.
* SIMULATED MANAGED VOLATILITY PORTFOLIO: In this paper, the returns and results reported for the managed volatility portfolio are simulated results and are being used for illustrative purposes only. The simulated returns vary significantly from the live strategy returns. The returns represent a theoretical equity portfolio and are being provided as supplemental to our fully compliant GIPS® presentation attached. Actual performance for the Global Managed Volatility strategy incepted on August 1, 2006. They do not represent actual trading or an actual account, but were achieved by means of retroactive application of a model designed with the benefit of hindsight. Results may not reflect the impact that material economic and market factors might have had on the adviser’s decision-making of managing actual client assets. All returns reflect the reinvestment of dividends and other earnings as well as estimated transaction costs. The net simulated performance returns reflect a maximum 0.40% flat advisory fee. The One Month U.S. T-Bill is the risk-free rate in the Sharpe Ratio calculation. These results assume a $1B initial investment. Additional information about how the simulated portfolio was constructed is available upon request. Simulated performance is not indicative of actual future results. Investors have the opportunity for losses as well as profits.
Thinking further about risk, it isn’t surprising that managed volatility has higher volatility than hedge funds. Managed volatility is a long-only strategy, while hedge funds often short equities explicitly to reduce market exposure. Consistent with this intuition, the full-period beta of SMV to MW is 0.54, versus 0.36 for HFRX EH. Even without shorting, however, managed volatility’s fully invested portfolio generates quite a substantial reduction in beta and generates total volatility that is roughly 1/3 less than the benchmark. Figure 1 shows the consistency of the volatility reduction over time, comparing rolling 3-year standard deviations of the returns streams. The chart provides evidence that managed volatility’s risk reduction benefit grows at times when it’s desirable, i.e., when market volatility is high.
Figure 1
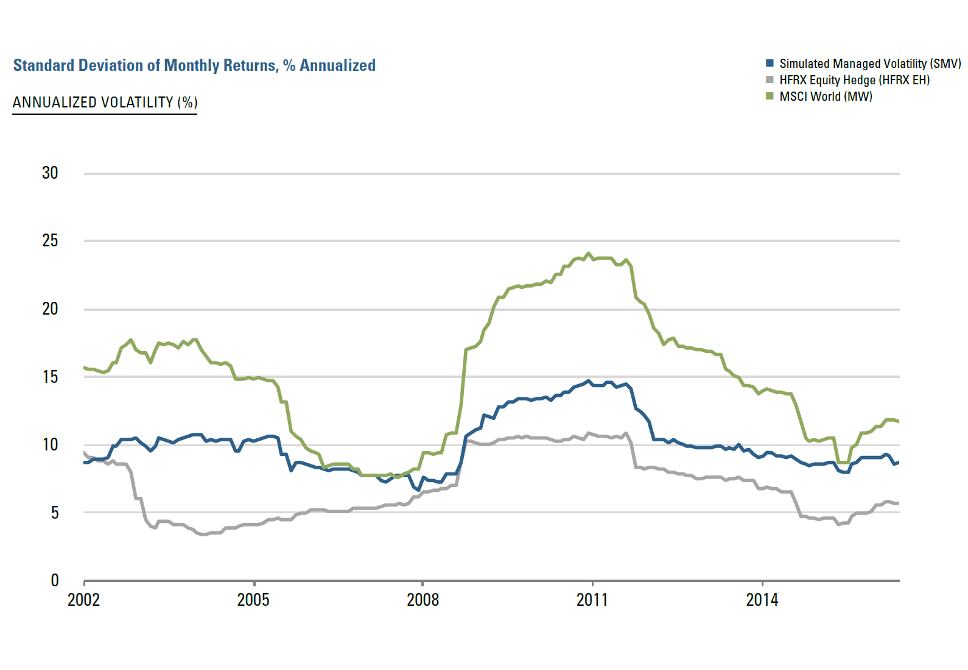
Sources: MSCI, Hedge Fund Research (HFRX), and Acadian. For illustrative purposes only.
See end notes and disclosures for full descriptions of the three return series.
For a more granular look at returns, Table 2 reports year-by-year returns for the three series. Simulated managed volatility outperformed MSCI World not just on average, but in a majority of years. Hedge funds, in contrast, underperformed the benchmark during 13 of the 18 years in the sample period. HFRX EH performance was particularly strong early in the sample, when many hedge fund managers appear to have correctly called the boom and bust of technology stocks (and equities generally). Subsequently, however, HFRX EH returns have been comparatively low.
Table 2
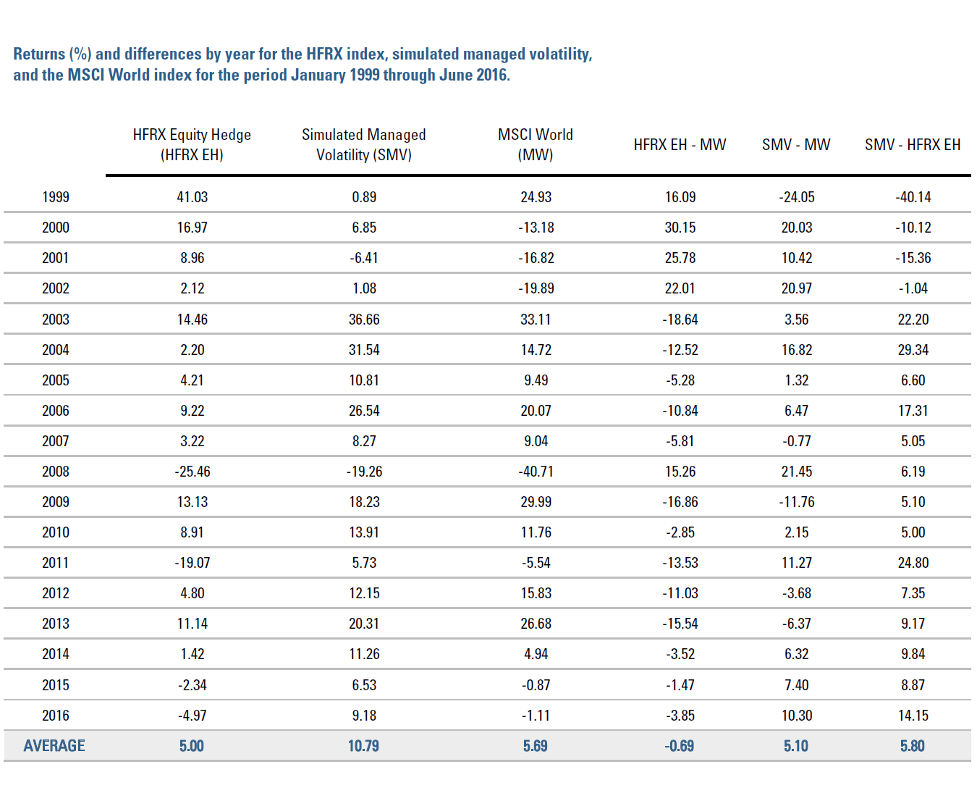
See end notes and disclosures for full descriptions of the three return series.
Figure 2
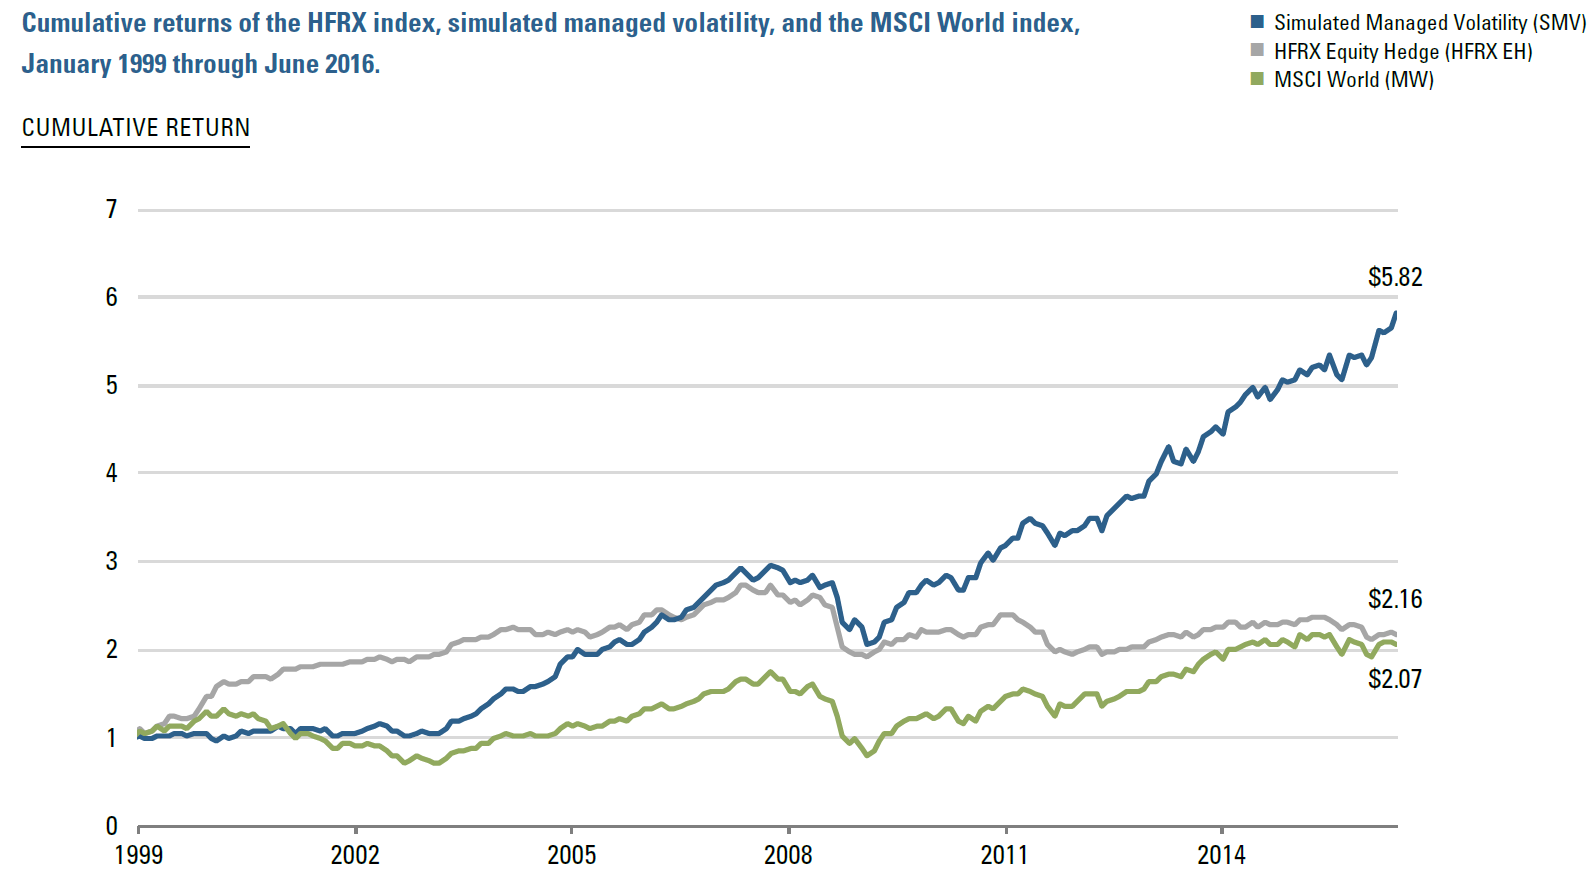
See end notes and disclosures for full descriptions of the three return series.
Figure 2 plots the hypothetical cumulative return of $1 invested in each of the strategies at the end of January 1999. HFRX EH’s early strong performance is evident, but SMV catches up in the mid-2000s and eventually surpasses it. Both the chart and Table 2 show outperformance of SMV versus HFRX EH during the global financial crisis (GFC) of 2008-9. MSCI World lags both alternative strategies over the full period, although its gap relative to HFRX EH has narrowed due to continued hedge fund underperformance since the GFC.
Portfolio Allocation: Managed Volatility and Hedge Funds as Complements
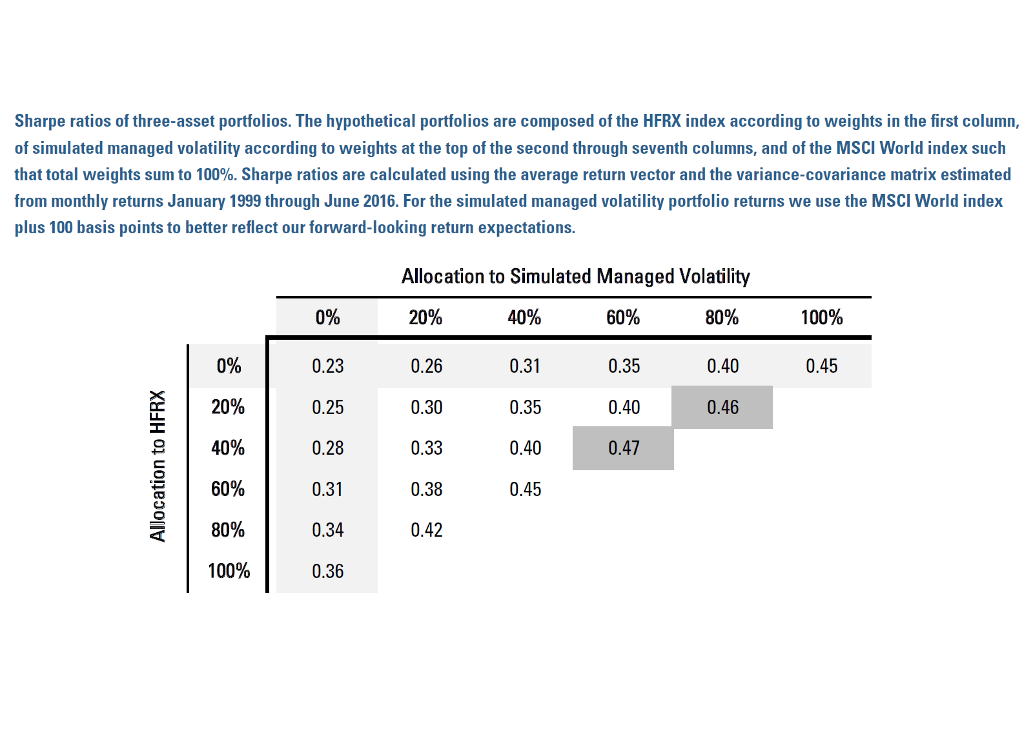
Historical behavior of HFRX EH and SMV returns suggest that a mix of hedge funds and managed volatility may work well in an asset allocation setting alongside (or in lieu of) an index such as MSCI World. They both display higher Sharpe ratios and may offer potentially diversifying risk characteristics. To investigate further, we compare hypothetical performance of alternative allocations to the three strategies. Specifically, in Table 3, we compare Sharpe ratios calculated from average returns of the three hypothetical portfolios and their covariances.
Table 3 may take a moment to digest, but it’s worth a little effort. Each cell represents a hypothetical portfolio with an allocation to the HFRX EH, SMV, and MW. The left-most column displays the weight assigned to HFRX EH, and the top row displays the weight assigned to SMV. The allocation to MW is the residual, i.e., the weight that creates a 100% invested portfolio. We lowered the simulated managed volatility portfolio returns to the MSCI World index plus 100 basis points in order to better reflect our forward-looking return expectations. The table reports the Sharpe ratio for each hypothetical asset allocation portfolio. So as an example, a portfolio that has a 0% allocation to both HFRX EH and SMV, in the upper left corner, has an implied 100% allocation to MSCI World and a Sharpe ratio of 0.23 (consistent with that reported in Table 1).
The lightly shaded column and row highlight hypothetical portfolios in which the allocation to either HFRX EH or SMV is constrained to be 0. In each case, Sharpe ratios rise steadily as the allocation shifts from the MSCI World benchmark to either hedge funds or managed volatility, consistent with the relative Sharpe ratios from Table 1. In other words, on a Sharpe ratio basis, as calculated from returns over our sample period, no optimal portfolio would include an allocation to the benchmark index.
Table 3
See end notes and disclosures for full descriptions of the three return series.
This is not intended to represent investment returns generated by actual portfolios. They do not represent actual trading or an actual account. Results do not reflect transaction costs or other implementation costs. Hypothetical performance is no guarantee of future results. Every investment program has the opportunity for loss as well as profit.
A second key result of the analysis is that investors who have allocated between the benchmark and equity long-short hedge funds might see benefit from a reallocation to managed volatility. We can see evidence of this in the Sharpe ratios of portfolios that contain 0 allocation to MSCI World, which are found in the main diagonal that runs from bottom left to top right. (Where allocations to HFRX EH + SMV = 100%.) There, the highest Sharpe ratio among all portfolios represented in the table has a 60%/40% allocation to SMV/HFRX EH.
Conclusion
Over the past nearly 18 years, hedge funds have delivered lower risk than cap weighted equity portfolios and a materially higher Sharpe ratio. During the same period, a simulated managed volatility portfolio also generated lower risk than the benchmark but with enough of an increase in returns to deliver an even higher Sharpe ratio than hedge funds.
Both hedge funds and managed volatility may provide beneficial diversification and drawdown protection in a broader asset allocation context. The simple allocation study presented in this note suggests, for example, that an optimal combination of the market index, hedge funds, and managed volatility may actually tilt towards the latter.
Overall, we see compelling evidence that managed volatility strategies may offer an attractive mix of low correlations, risk reduction, and return potential, and even more so when other attributes such as liquidity, transparency, and complexity are taken into consideration alongside raw performance. For these reasons, we consider managed volatility as a natural component of an asset allocation strategy.
Performance Disclosure - Global Managed Volatility
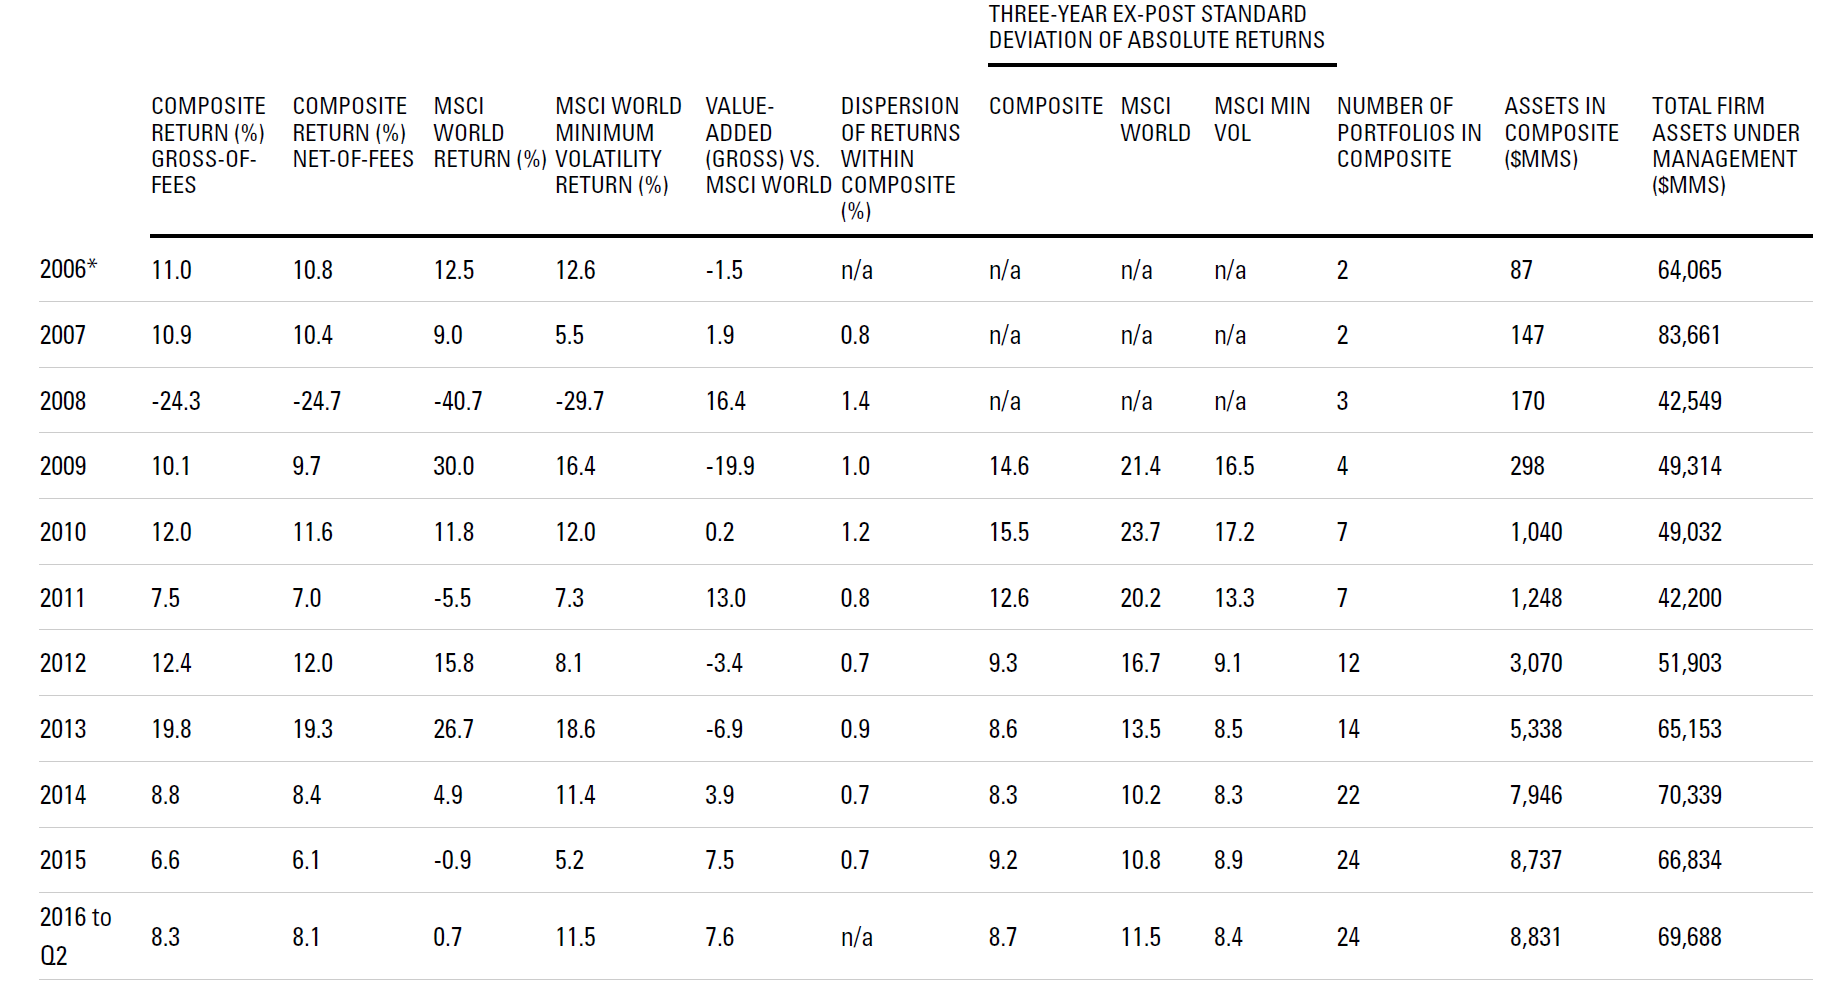
Acadian Asset Management claims compliance with the Global Investment Performance Standards (GIPS®) and has prepared and presented this report in compliance with the GIPS standards. Acadian Asset Management has been independently verified for the periods January 1, 1994 through June 30, 2016 by Ashland Partners & Company LLP. A copy of the verification report is available upon request. Verification assesses whether (1) the firm has complied with all the composite construction requirements of the GIPS standards on a firm-wide basis and (2) the firm’s policies and procedures are designed to calculate and present performance in compliance with the GIPS standards. Verification does not ensure the accuracy of any specific composite presentation. Reference to the benchmark is for comparative purposes only and is not intended to indicate that the composite will contain the same investments as the benchmark. Investors have the opportunity for losses as well as profits. Past performance is no guarantee of future results. Acadian Asset Management is an investment adviser specializing in global equity management. Acadian Asset Management is defined to include assets managed by Acadian Asset Management LLC, an investment adviser registered with and regulated by the United States Securities and Exchange Commission, as well as assets managed by its four wholly-owned affiliates, Acadian Asset Management (Australia) Limited (ABN 41 114 200 127), Acadian Asset Management (Japan), registered with the Kanto Local Financial Bureau, Acadian Asset Management Singapore Pte Ltd, (Registration Number: 199902125D) is licensed by the Monetary Authority of Singapore, and Acadian Asset Management (UK) Limited, authorized and regulated by the Financial Conduct Authority of the United Kingdom. On June 30, 2015, Acadian acquired the assets of Acadian’s Australian office.
Methodology: Returns are net of estimated foreign withholding taxes on dividends, interest, and capital gains. As of January 1, 2010 Acadian’s methodology was augmented to produce a more accurate gross return figure by eliminating modest cash flows such as securities lending income and custodial fees which are regarded as independent of the investment management process; the reinvestment of all income and trading expenses continue to be included. Gross returns will be reduced by investment advisory fees and other expenses. Monthly composite results are asset-weighted by beginning-of-month asset values of member portfolios which are geometrically linked to arrive at the annual composite return. Net-of-fee performance is accrued on a monthly basis and is calculated using the highest management fee as described in section 2A of the firm’s Form ADV for the investment process utilized to manage this strategy; such form is available upon request. Net-net-of-fees additionally include incentive fees which, when applicable, are also accrued on a monthly basis. The standard fee schedule for accounts managed with this product is 0.40% on the first $50 million, 0.30% on the next $50 million, and 0.25% thereafter. Management fees may vary according to the range of services provided, investment performance, and the amount of assets under management. Constituent portfolios are included from the first full month after inception to the present or the last full month prior to cessation of the client relationship with the firm. For example, an account that opened January 15, 2010 will be included beginning February 1, 2010. An account that terminated February 12, 2010 will be included through January 31, 2010. Policies for valuing portfolios, calculating performance, and preparing compliant presentations are available upon request.
Dispersion: Acadian’s broad definitions are mainly the product of a highly customized process that may result in modest differences with regards to portfolio characteristics among constituents. All accounts managed with directly comparable investment objectives are included, though it’s possible for members to utilize slightly different benchmarks in optimization and reporting. Although at times dispersion among constituents may be high, the long-term forecast for each portfolio is consistent with the overall composite. The ‘Dispersion’ statistic presented above is an annual, asset-weighted standard deviation calculation performed only on those portfolios who have been members for the entire calendar year. Thirty-six months are required to calculate the ‘Three Year ex-Post Standard Deviation’ statistic. These figures are not shown if the requirements necessary to perform the calculations are unavailable.
Composite Description: This composite invests globally in developed and opportunistic emerging equity markets. The strategy aspires to provide market-like returns with less-than-market volatility. As of January 1, 2010 this composite was renamed from “Global Low Volatility Equity.” A complete list of the firm’s composites and their descriptions is available upon request.
Benchmark Description: The primary benchmark for the composite is MSCI World (net of dividend withholding taxes). The MSCI World Index is a free float-adjusted market capitalization weighted index that is designed to measure the equity market performance of developed markets. The secondary benchmark is MSCI World Minimum Volatility (net of dividend withholding taxes) for purposes of additional comparison. The MSCI World Minimum Volatility Index is calculated by optimizing the MSCI World index to produce an index with the least volatility for a given set of constraints and to ensure index replicability and investability.
Index Source: MSCI Copyright MSCI 2016. All Rights Reserved. Unpublished. PROPRIETARY TO MSCI.
Endnotes
- The HFRX Equity Hedge index is an equal-weighted average of hedge fund returns collected and analyzed by Hedge Fund Research, Inc., www.hedgefundresearch.com. In general, funds that have at least $50 million under management, that have at least a twenty-four-month track record, and that are open to new investment are eligible for inclusion in HFR’s indexes. The HFRX Equity Hedge index is intended to be composite of many different equity strategies, but typically constituent funds have at least 50% of their capital invested in equities. Returns aggregated into the index are net of the fees that are reported by the constituent hedge funds and that may differ from fund to fund. Additional information may be available from HFR. Reference to the HFRX Equity Hedge index is for comparative purposes only and is not intended to indicate that a Managed Volatility portfolio would contain the same investments as the index.
- SIMULATED MANAGED VOLATILITY PORTFOLIO: In this paper, the returns and results reported for the managed volatility portfolio are simulated results and are being used for illustrative purposes only. The simulated returns vary significantly from the live strategy returns. The returns represent a theoretical equity portfolio and are being provided as supplemental to our fully compliant GIPS® presentation attached. Actual performance for the Global Managed Volatility strategy incepted on August 1, 2006. They do not represent actual trading or an actual account, but were achieved by means of retroactive application of a model designed with the benefit of hindsight. Results may not reflect the impact that material economic and market factors might have had on the adviser’s decision-making of managing actual client assets. All returns reflect the reinvestment of dividends and other earnings as well as estimated transaction costs. The net simulated performance returns reflect a maximum 0.40% flat advisory fee. The One Month U.S. T-Bill is the risk-free rate in the Sharpe Ratio calculation. These results assume a $1B initial investment. Additional information about how the simulated portfolio was constructed is available upon request. Simulated performance is not indicative of actual future results. Investors have the opportunity for losses as well as profits.
- Reference to the MSCI World index is for comparative purposes only and is not intended to indicate that a Managed Volatility portfolio would contain the same investments as the index.
Index source: MSCI, copyright MSCI 2016. All Rights Reserved. Unpublished. PROPRIETARY TO MSCI.
Copyright MSCI 2016. All Rights Reserved. Without prior written permission of MSCI this information and any other MSCI intellectual property may only be used for your internal use, may not be reproduced or re-disseminated in any form and may not be used to create financial instruments or products or any indices. This information is provided on an “as is” basis, and the user of this information assumes the entire risk of any use of this information. Neither MSCI nor any third party involved in or related to the computing or compiling of the data makes any express or implied warranties, representations or guarantees concerning the MSCI index-related data, and in no event shall MSCI or any third party have any liability for any direct, indirect, special, punitive, consequential or any other damages (including lost profits) relating to any use of this information.
Hypothetical Legal Disclaimer
Acadian is providing hypothetical performance information for your review as we believe you have access to resources to independently analyze this information and have the financial expertise to understand the risks and limitations of the presentation of hypothetical performance. Please immediately advise if that is not the case.
Hypothetical performance results have many inherent limitations, some of which are described below. No representation is being made that any account will or is likely to achieve profits or losses similar to those shown. In fact, there are frequently sharp differences between hypothetical performance results and the actual performance results subsequently achieved by any particular trading program.
One of the limitations of hypothetical performance results is that they are generally prepared with the benefit of hindsight. In addition, hypothetical trading does not involve financial risk, and no hypothetical trading record can completely account for the impact of financial risk in actual trading. For example, the ability to withstand losses or to adhere to a particular trading program in spite of trading losses are material points which can also adversely affect actual trading results. There are numerous other factors related to the markets in general or to the implementation of any specific trading program which cannot be fully accounted for in the preparation of hypothetical performance results and all of which can adversely affect actual trading results.
Legal Disclaimer
These materials provided herein may contain material, non-public information within the meaning of the United States Federal Securities Laws with respect to Acadian Asset Management LLC, Acadian Asset Management Inc. and/or their respective subsidiaries and affiliated entities. The recipient of these materials agrees that it will not use any confidential information that may be contained herein to execute or recommend transactions in securities. The recipient further acknowledges that it is aware that United States Federal and State securities laws prohibit any person or entity who has material, non-public information about a publicly-traded company from purchasing or selling securities of such company, or from communicating such information to any other person or entity under circumstances in which it is reasonably foreseeable that such person or entity is likely to sell or purchase such securities.
Acadian provides this material as a general overview of the firm, our processes and our investment capabilities. It has been provided for informational purposes only. It does not constitute or form part of any offer to issue or sell, or any solicitation of any offer to subscribe or to purchase, shares, units or other interests in investments that may be referred to herein and must not be construed as investment or financial product advice. Acadian has not considered any reader's financial situation, objective or needs in providing the relevant information.
The value of investments may fall as well as rise and you may not get back your original investment. Past performance is not necessarily a guide to future performance or returns. Acadian has taken all reasonable care to ensure that the information contained in this material is accurate at the time of its distribution, no representation or warranty, express or implied, is made as to the accuracy, reliability or completeness of such information.
This material contains privileged and confidential information and is intended only for the recipient/s. Any distribution, reproduction or other use of this presentation by recipients is strictly prohibited. If you are not the intended recipient and this presentation has been sent or passed on to you in error, please contact us immediately. Confidentiality and privilege are not lost by this presentation having been sent or passed on to you in error.
Acadian’s quantitative investment process is supported by extensive proprietary computer code. Acadian’s researchers, software developers, and IT teams follow a structured design, development, testing, change control, and review processes during the development of its systems and the implementation within our investment process. These controls and their effectiveness are subject to regular internal reviews, at least annual independent review by our SOC1 auditor. However, despite these extensive controls it is possible that errors may occur in coding and within the investment process, as is the case with any complex software or data-driven model, and no guarantee or warranty can be provided that any quantitative investment model is completely free of errors. Any such errors could have a negative impact on investment results. We have in place control systems and processes which are intended to identify in a timely manner any such errors which would have a material impact on the investment process.
Acadian Asset Management LLC has wholly owned affiliates located in London, Singapore, and Sydney. Pursuant to the terms of service level agreements with each affiliate, employees of Acadian Asset Management LLC may provide certain services on behalf of each affiliate and employees of each affiliate may provide certain administrative services, including marketing and client service, on behalf of Acadian Asset Management LLC.
Acadian Asset Management LLC is registered as an investment adviser with the U.S. Securities and Exchange Commission. Registration of an investment adviser does not imply any level of skill or training.
Acadian Asset Management (Singapore) Pte Ltd, (Registration Number: 199902125D) is licensed by the Monetary Authority of Singapore. It is also registered as an investment adviser with the U.S. Securities and Exchange Commission.
Acadian Asset Management (Australia) Limited (ABN 41 114 200 127) is the holder of Australian financial services license number 291872 ("AFSL"). It is also registered as an investment adviser with the U.S. Securities and Exchange Commission. Under the terms of its AFSL, Acadian Asset Management (Australia) Limited is limited to providing the financial services under its license to wholesale clients only. This marketing material is not to be provided to retail clients.
Acadian Asset Management (UK) Limited is authorized and regulated by the Financial Conduct Authority ('the FCA') and is a limited liability company incorporated in England and Wales with company number 05644066. Acadian Asset Management (UK) Limited will only make this material available to Professional Clients and Eligible Counterparties as defined by the FCA under the Markets in Financial Instruments Directive, or to Qualified Investors in Switzerland as defined in the Collective Investment Schemes Act, as applicable.