
Does Value Have Beta?
Table of contents
March 2020
Not necessarily. We study Developed Markets since 1998 and show that generic value implementations do indeed exhibit active beta. However, we also show that more sophisticated multi-factor implementations of value are beta-neutral and a lot more efficacious. Finally, we consider an event study of market drawdowns and find no evidence that value tends to struggle during periods of extreme market stress.
Introduction
The precipitous drop in markets this year has refocused asset owners on the beta implications of their active tilts. In addition to health concerns, Covid-19 has brought on an unprecedented shock to the global supply chain, which has been accompanied by a sharp increase in investor risk aversion. Unfortunately, monetary and fiscal policies have limited direct effectiveness against supply chain disorganization and can only help offset the risk aversion domino effects. While the ultimate impact on corporate profitability is still uncertain and very much dependent on governmental responses, investors are rightfully concerned that recent asset price moves may not be overblown but may be correctly incorporating a persistent deterioration of corporate fundamentals. In light of current events, we examine how active value tilts affect portfolio beta.
Estimation of the beta tilt of value
In previous work, we showed how industry shifts induce beta shifts in generic implementations of value in the U.S. Here we extend our analysis by considering how more sophisticated implementations of value can help eliminate its beta tilt while improving its efficacy. We also extend our universe beyond the U.S. by including all Developed Markets going back to the late 1990s. Our analysis should help to reassure our investors that Acadian’s value implementation is beta-neutral.
First, a word on our methodology. Our analysis evaluates different value signals based on the historical performance of hypothetical long/short portfolios built from these signals. Our chosen methodology is very similar to the one used by the ubiquitous Fama-French HML value portfolio. On any given day, we split the universe of developed markets stocks into small-, mid-, and large-cap buckets and we form three long/short portfolios for each of the three buckets by going long the most attractive stocks and short the least attractive stocks within each bucket. The return of the value signal under consideration for that particular day is simply the average of the three long/short portfolios. These hypothetical portfolios do not, of course, incorporate important real-world considerations such as trading costs and should not be used as a benchmark for performance expectations. However, specifically because they abstract from other considerations, they are fresh daily-rebalanced portfolios ideally suited for estimating the effects of value factor construction choices on beta as precisely as possible.
We start with what we consider a generic but sensible implementation of value, and we gradually build on this concept by incorporating aspects of Acadian’s proprietary alpha model. We consider three candidate value signals:
- Generic Value, which we define as the cross-sectional rank of each company’s price-to-earnings and book-to-earnings ratios relative to the rest of developed-market stocks in our universe.
- Acadian Value, which incorporates more sophisticated and more granular valuation metrics while also adjusting for peer-relative risk effects.
- Acadian Value-Quality Intersection, which additionally focuses on the subset of the attractively valued stocks that also have attractive quality characteristics.
The third value signal is the one that is closest to our diversified multi-factor alpha model. We believe that value payoffs originate in inefficiencies rooted in human psychology and the resulting behavioral mistakes of investors. An attractively valued stock is more likely to have a strong payoff if it also benefits from other attractive fundamental characteristics, such as the quality of its balance sheet.cs.
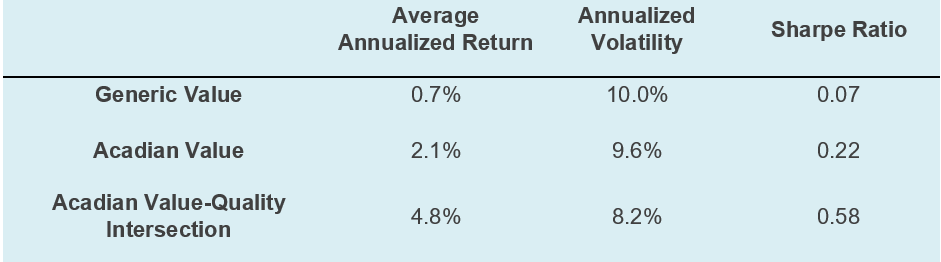
Table 1 examines the historical performance in Developed Markets of each of the three value signals under consideration:
Table 1
Value factor portfolio raw returns, Developed Markets, 12/31/1998-3/10/2020

Source: Acadian, MSCI. This is meant to be an educational illustrative example and is not intended to represent investment returns generated by an actual portfolio. They do not represent actual trading or an actual and results do not reflect transaction costs, other implementation costs and do not reflect advisory fees or their potential impact. Hypothetical results are not indicative of actual future results. Every investment program has the opportunity for loss as well as profit. Index Source: MSCI Copyright MSCI 2020. All Rights Reserved. Unpublished. PROPRIETARY TO MSCI. It is not possible to invest directly in an index.
Admittedly, this has been a difficult period for value, and especially so for the generic implementation. Still, the increase in sophistication has been rewarded by superior risk-adjusted returns, as shown in the first three columns of Table 1. As the construction of the value factor shifts from generic value to Acadian value and to Acadian value-quality intersection, becoming progressively more sophisticated along each step, the average return of the corresponding hypothetical portfolio increases. At the same time, the volatility decreases, which means that the Sharpe ratio improves. While this improved efficacy is highly desirable for active investors, the benefit to increased sophistication does not end there.
As we can see from the fourth column of Table 1, generic value has an active beta tilt of 0.13, which we estimate to be statistically significant at the 99% level of confidence. This developed-markets estimate is very similar to our 0.10 estimate, not shown here, that we obtain for the market beta of the Fama-French HML portfolio in the U.S. going back to 1927.
The estimated generic beta tilt of 0.13 from Table 1 is reduced by more than two thirds to 0.04 when we shift to the more sophisticated Acadian value construction. And it is then eliminated, estimated at -0.01, when we shift to our most sophisticated Acadian value-quality intersection approach. Both beta tilt reductions are as expected. Our proprietary Acadian value factor corrects for risk biases, including industry effects. And our proprietary Acadian value-quality intersection further builds on our value factor by focusing on attractively valued stocks that also enjoy attractive balance sheets. Thus, our intersection benefits from the defensive nature of quality to eliminate the slight 0.04 beta tilt of our Acadian value factor.
Finally, using our beta estimates, Table 2 shows beta-hedged returns for each of the three factor portfolios:
Table 2
Value factor portfolio beta-hedged returns, Developed Markets, 12/31/1998 - 3/10/2020
Source: Acadian. This is meant to be an educational illustrative example and is not intended to represent investment returns generated by an actual portfolio. They do not represent actual trading or an actual and results do not reflect transaction costs, other implementation costs and do not reflect advisory fees or their potential impact. Hypothetical results are not indicative of actual future results. Every investment program has the opportunity for loss as well as profit.
Not surprisingly, the Sharpe ratio of the generic value factor portfolio is reduced most significantly, further highlighting the recent struggles of generic value.
Value behavior during stock market drawdowns
The above analysis established that it is possible to implement sophisticated value factors with improved efficacy and without a beta bias. While the elimination of the beta bias removes the systematic component of risk, value investing remains risky and inherently uncomfortable. This is consistent with our belief that value payoffs arise as a result of investors’ behavioral errors, and thus vary across market cycles depending on prevailing investor sentiment. Much as it has in recent years, sentiment may at times favor a prolonged and unsustainable one-factor bet on growth to the detriment of good nights’ sleep for value investors. At other times, it may instead shy away from over-confidence and favor sound fundamentals. Overall, we do not expect to see a specific pattern in value payoffs related to market performance.
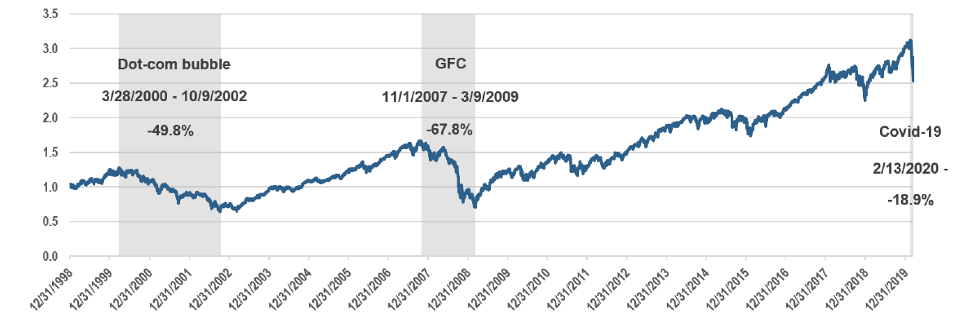
We provide supporting anecdotal evidence by examining value payoffs during bear markets in our historical sample of developed countries. In Figure 1, we identify two drawdowns where peak-to-trough losses of the MSCI World Index exceeded 20%, namely the dot-com bubble in the early 2000s and the GFC in the late 2000s. And we analyze them alongside the coronavirus drawdown that is still unfolding and, similarly, has reached losses of roughly 20% since mid-February:
Figure 1
MSCI World Total Return Index (12/31/1998 = 1.0)
MSCI Daily Total Return Net World USD. Morgan Stanley Capital International Equity Indices in US Dollars. Indices with net dividends reinvested use the same dividend minus-tax-credit calculations, but subtract withholding taxes retained at the source for foreigners who do not benefit from a double taxation treaty.
Index Source: MSCI Copyright MSCI 2020. All Rights Reserved. Unpublished. PROPRIETARY TO MSCI. It is not possible to invest directly in an index. Every investment program has the opportunity for losses as well as profits. Past results are not indicative of future results
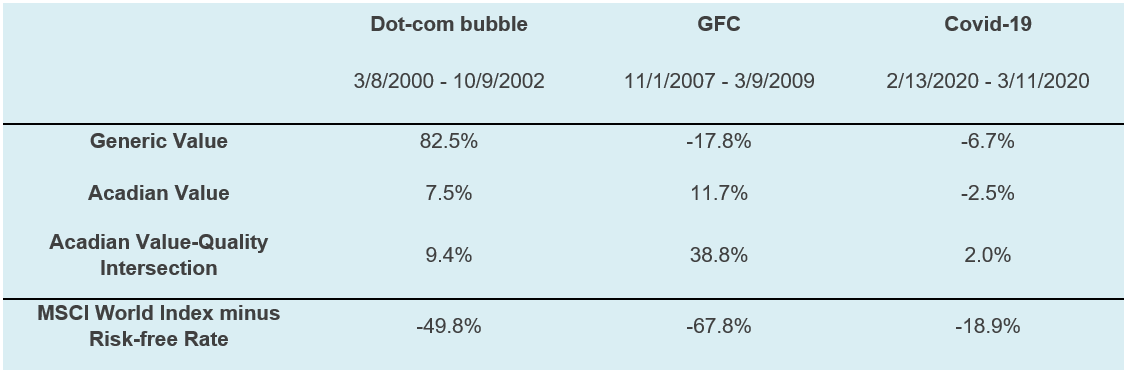
For each of these three episodes, Table 3 reports the payoffs to the three value signals we have been analyzing:
Table 3
Value factor portfolio raw returns, Developed Markets, Selected episodes
Source: Acadian, MSCI. This is meant to be an educational illustrative example and is not intended to represent investment returns generated by an actual portfolio. They do not represent actual trading or an actual and results do not reflect transaction costs, other implementation costs and do not reflect advisory fees or their potential impact. Hypothetical results are not indicative of actual future results. Every investment program has the opportunity for loss as well as profit. Index Source: MSCI Copyright MSCI 2020. All Rights Reserved. Unpublished. PROPRIETARY TO MSCI. It is not possible to invest directly in an index.
The evidence from Table 3 shows that even generic value does not necessarily struggle during periods of extreme market stress. It also shows considerable differences between the payoffs of generic value and Acadian value. Finally, it shows that our preferred implementation at the intersection of value and quality has enjoyed positive payoffs during all three episodes.
Overall, this event study has offered further support for our behavioral multi-factor approach to value based on our nuanced, sophisticated, and evolving implementation.
Hypothetical Legal Disclaimer
Acadian is providing hypothetical performance information for your review as we believe you have access to resources to independently analyze this information and have the financial expertise to understand the risks and limitations of the presentation of hypothetical performance. Please immediately advise if that is not the case.
Hypothetical performance results have many inherent limitations, some of which are described below. No representation is being made that any account will or is likely to achieve profits or losses similar to those shown. In fact, there are frequently sharp differences between hypothetical performance results and the actual performance results subsequently achieved by any particular trading program.
One of the limitations of hypothetical performance results is that they are generally prepared with the benefit of hindsight. In addition, hypothetical trading does not involve financial risk, and no hypothetical trading record can completely account for the impact of financial risk in actual trading. For example, the ability to withstand losses or to adhere to a particular trading program in spite of trading losses are material points which can also adversely affect actual trading results. There are numerous other factors related to the markets in general or to the implementation of any specific trading program which cannot be fully accounted for in the preparation of hypothetical performance results and all of which can adversely affect actual trading results.
Legal Disclaimer
These materials provided herein may contain material, non-public information within the meaning of the United States Federal Securities Laws with respect to Acadian Asset Management LLC, Acadian Asset Management Inc. and/or their respective subsidiaries and affiliated entities. The recipient of these materials agrees that it will not use any confidential information that may be contained herein to execute or recommend transactions in securities. The recipient further acknowledges that it is aware that United States Federal and State securities laws prohibit any person or entity who has material, non-public information about a publicly-traded company from purchasing or selling securities of such company, or from communicating such information to any other person or entity under circumstances in which it is reasonably foreseeable that such person or entity is likely to sell or purchase such securities.
Acadian provides this material as a general overview of the firm, our processes and our investment capabilities. It has been provided for informational purposes only. It does not constitute or form part of any offer to issue or sell, or any solicitation of any offer to subscribe or to purchase, shares, units or other interests in investments that may be referred to herein and must not be construed as investment or financial product advice. Acadian has not considered any reader's financial situation, objective or needs in providing the relevant information.
The value of investments may fall as well as rise and you may not get back your original investment. Past performance is not necessarily a guide to future performance or returns. Acadian has taken all reasonable care to ensure that the information contained in this material is accurate at the time of its distribution, no representation or warranty, express or implied, is made as to the accuracy, reliability or completeness of such information.
This material contains privileged and confidential information and is intended only for the recipient/s. Any distribution, reproduction or other use of this presentation by recipients is strictly prohibited. If you are not the intended recipient and this presentation has been sent or passed on to you in error, please contact us immediately. Confidentiality and privilege are not lost by this presentation having been sent or passed on to you in error.
Acadian’s quantitative investment process is supported by extensive proprietary computer code. Acadian’s researchers, software developers, and IT teams follow a structured design, development, testing, change control, and review processes during the development of its systems and the implementation within our investment process. These controls and their effectiveness are subject to regular internal reviews, at least annual independent review by our SOC1 auditor. However, despite these extensive controls it is possible that errors may occur in coding and within the investment process, as is the case with any complex software or data-driven model, and no guarantee or warranty can be provided that any quantitative investment model is completely free of errors. Any such errors could have a negative impact on investment results. We have in place control systems and processes which are intended to identify in a timely manner any such errors which would have a material impact on the investment process.
Acadian Asset Management LLC has wholly owned affiliates located in London, Singapore, and Sydney. Pursuant to the terms of service level agreements with each affiliate, employees of Acadian Asset Management LLC may provide certain services on behalf of each affiliate and employees of each affiliate may provide certain administrative services, including marketing and client service, on behalf of Acadian Asset Management LLC.
Acadian Asset Management LLC is registered as an investment adviser with the U.S. Securities and Exchange Commission. Registration of an investment adviser does not imply any level of skill or training.
Acadian Asset Management (Singapore) Pte Ltd, (Registration Number: 199902125D) is licensed by the Monetary Authority of Singapore. It is also registered as an investment adviser with the U.S. Securities and Exchange Commission.
Acadian Asset Management (Australia) Limited (ABN 41 114 200 127) is the holder of Australian financial services license number 291872 ("AFSL"). It is also registered as an investment adviser with the U.S. Securities and Exchange Commission. Under the terms of its AFSL, Acadian Asset Management (Australia) Limited is limited to providing the financial services under its license to wholesale clients only. This marketing material is not to be provided to retail clients.
Acadian Asset Management (UK) Limited is authorized and regulated by the Financial Conduct Authority ('the FCA') and is a limited liability company incorporated in England and Wales with company number 05644066. Acadian Asset Management (UK) Limited will only make this material available to Professional Clients and Eligible Counterparties as defined by the FCA under the Markets in Financial Instruments Directive, or to Qualified Investors in Switzerland as defined in the Collective Investment Schemes Act, as applicable.