
Active Micro-Cap Equities as a Substitute for Private Equity
Table of contents
February 2017
Micro-cap stocks represent one of the least efficient areas of global equity markets. For active managers who can successfully negotiate the associated trading and risk challenges, we believe micro-caps offer attractive stock selection opportunities at institutional capacity.
Micro-caps are also often put forth as an attractive, liquid alternative to private equity because management has “skin in the game.” As shown in Figure 1, the percent of market cap held by insiders and private investors steadily increases from large-cap stocks to small-cap stocks to micro-caps, both domestically and internationally.
In this note, we further analyze the relationship between micro-cap equities and private equity. We examine the publicly listed companies that were bought out by private equity firms in the last three years and show that the typical private equity portfolio company resembles a micro-cap stock with attractive value characteristics. We then review the performance characteristics of private equity and micro-caps.
Figure 1
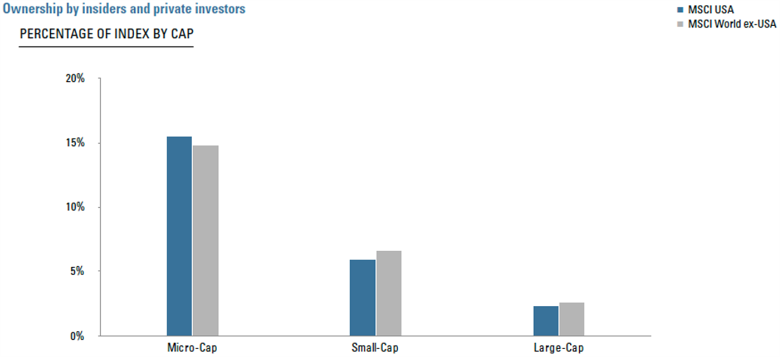
For illustrative purposes only. It is not possible to invest directly in any index. Past performance is not indicative of future results. Every investment program has an opportunity for loss as well as profit. Index Source: MSCI Copyright MSCI 2017. All Rights Reserved. Unpublished. PROPRIETARY TO MSCI.
Characteristics of Private Equity and Micro-Caps
A natural starting point for any meaningful comparison between asset classes is to drill down to the underlying assets in each class and compare their characteristics. This exercise is inherently difficult for private equity assets due to the lack of public information on the majority of the companies that make up private equity funds. Some databases offer partial coverage of private equity fund portfolios but they can suffer from sample selection bias.
We circumvent the above hurdles by focusing instead on publicly traded companies that were targeted for buyouts by private equity funds. While this approach is not exhaustive, it does not suffer from selection bias because all the relevant deal information is in the public record. This approach is also likely to be conservative as a comparison to micro-cap stocks, as it will likely overstate the size of the portfolio companies in private equity funds. However, beyond this tilt toward larger companies, there is no good reason to think that our approach will suffer from other biases.
We started by identifying every company in Acadian’s developed markets universe that was involved in a private equity buyout in the past three years. We then restricted the sample to transactions where the acquirer had sought at least three quarters ownership in the target firm, and that were subsequently successfully completed.
Our resulting sample of 154 private equity buyouts for 2014-2016 serves as our “PE proxy” portfolio for our analysis. As expected, the most represented sector is information technology, and the most represented country is the U.S. Our sample size of 154 companies is quite large for this type of private equity portfolio analysis, and reflects the strength of our micro-cap universe which we have maintained since the late 1980s.
Armed with our PE proxy portfolio, we can now compare the characteristics of private equity to micro-caps, as shown in Table 1:
Table 1
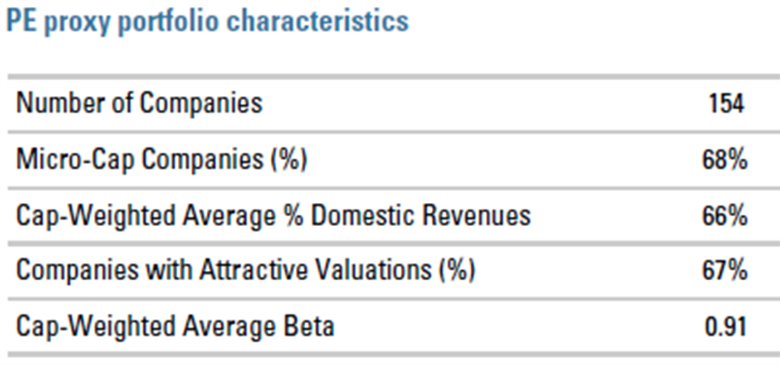
The first characteristic that stands out is that the majority of the companies in the PE proxy portfolio are micro-cap stocks, which we define as stocks with market capitalization under $600M. The true unobserved overlap by company size is likely quite a bit higher, given that we do not observe the smaller, non-publicly traded private equity portfolio companies.
Second, the PE proxy portfolio companies derive the majority of their revenues domestically. This is another characteristic which demonstrates that private equity portfolio companies are similar to micro-cap stocks. Looking across Acadian’s developed markets universe shown in Table 2, we note that micro-cap stocks have the highest percentage of domestic revenues:
Table 2
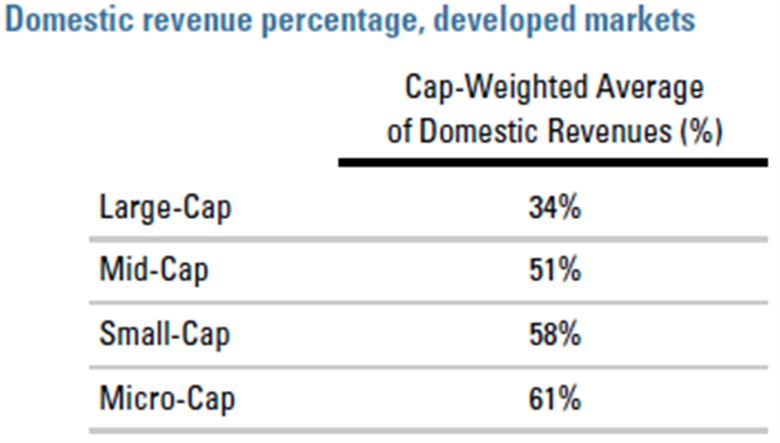
For illustrative purposes only. Past results is not indicative of future results. Every investment program has an opportunity for loss as well as profit.
Third, a similarly high majority of the companies in the PE proxy portfolio (67%) are stocks with attractive valuations. Here we rely on our Price to Intrinsic Asset Value (PIAV) factor, which captures our slower, stock-like valuation metrics such as Price-to-Book. Stocks are counted as having attractive valuations if their PIAV score is more attractive than the average stock in their region and industry peer group.
Finally, the PE proxy portfolio companies are unremarkable in terms of market risk, with an average trailing one-year beta of 0.91 to MSCI World. In summary, our characteristics analysis above suggests that, on average, private equity portfolio companies can resemble micro-cap stocks with attractive valuations.
Performance of Private Equity and Micro-Caps
It will come as no surprise to private equity investors that analyzing the asset class’s performance is at least as hard as identifying the characteristics of its underlying assets. Beyond the lack of public information on the composition and returns of private equity funds, performance measurement is further complicated by institutional structures.
Specifically, even if there existed a mythical comprehensive and bias-free database of private equity funds and their fee structures, the return of each fund would not be known with certainty until it had been liquidated. Given that the life span of a typical private equity fund is itself unknown and can be over ten years, return calculations will depend on variable vintage effects and may suffer from return smoothing. That’s because funds report their interim performance on the basis of cash flows and their own markings of their remaining investments’ net asset value. These markings are unreliable due to their discretionary nature and due to the lack of a liquid secondary market for private equity holdings. As Blackstone noted in its March 2007 IPO filing, valuation “can be subject to significant subjectivity” and “there is no single standard for determining fair value in good faith.”
Once again, we bypass the above hurdles by relying on the price discovery afforded by public markets. We use the Red Rocks Capital Global Listed Private Equity Index as our publicly listed proxy for the performance of private equity as an asset class. The Red Rocks index is typically comprised by 40 to 75 companies, the majority of which generate their returns through direct investments in private companies. As a result, it provides indirect exposure to thousands of underlying private companies, and offers a liquid and transparent proxy for private equity as an asset class. It is rebalanced quarterly and uses market-cap weighting with a 10% maximum weight. Finally, this index is the one tracked by the largest global private equity ETF, the PowerShares Global Listed Private Equity Portfolio.1
There are two key advantages to using a publicly listed proxy for measuring private equity performance:
First, we avoid any return smoothing biases that result from the subjectivity inherent in self-reported fund performance described above. As we show in the Appendix, the difference between publicly listed and fund-reported performance can be quite meaningful.
Second, we can directly compare the performance of private equity to the performance of publicly listed equities, such as micro-cap. Of course, using a publicly listed proxy has its own limitations. While it provides a liquid and transparent market view into the underlying private companies, it only does so via managers that are publicly listed. This manager selection will undoubtedly introduce a “basis” to the true and unobservable PE performance. For example, it will tend to hold some of the larger and more successful PE managers despite its 10% maximum weight. Nevertheless, we believe that the results of our analysis are robust, and we document in the Appendix that the independent and “reverse” proxy approach of building a PE proxy out of micro-cap stocks leads to essentially the same conclusions.
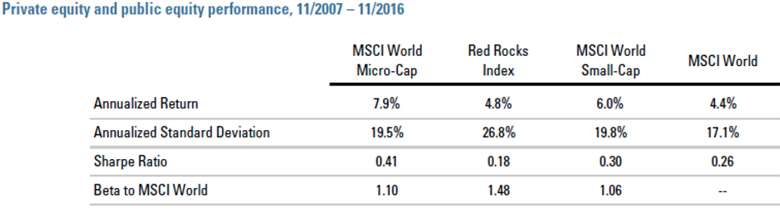
Figure 2 below compares the performance of private equity, as measured by the Red Rocks publicly listed index, to the performance of the MSCI World Micro Cap Index:
Figure 2
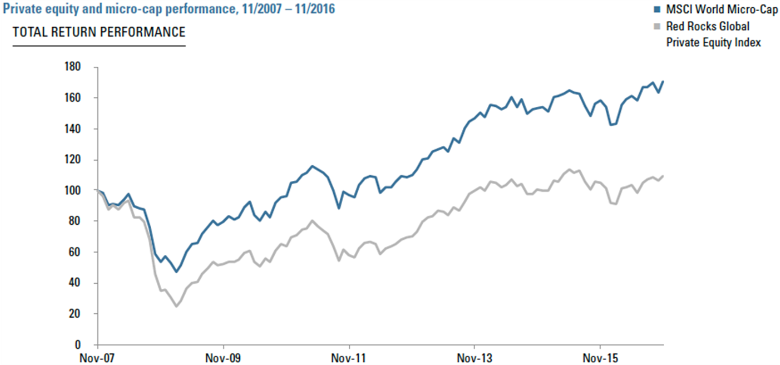
Our chart starts in November of 2007 because that is the earliest available date for the MSCI World Micro Cap Index. It was launched in December 2010, and so the earlier history is back filled. The Red Rocks index performance is actual, as it launched in September of 2007.
As shown in Figure 2, the GFC was particularly challenging for both asset classes, but especially so for private equity. According to our performance indices, from November 2007 to February 2009 micro-cap equity lost more than half its value, whereas private equity lost more than three quarters. Both asset classes have rebounded strongly since. Table 3 summarizes the performance of both asset classes for the same time period relative to MSCI World and MSCI World Small Cap equities. Private equity has been more volatile than micro-cap stocks, and has also exhibited greater beta to world equities. This is consistent with the use of leverage in private equity.
Conclusion
Our portfolio analysis has shown that the typical private equity buyout target company resembles a micro-cap stock with attractive value characteristics. Therefore, we conclude that active micro-cap equity strategies could offer a liquid and transparent substitute for private equity. Finally, at the asset class level, our research suggests micro cap equities have outperformed private equity with lower volatility over the past ten years.
Table 3
Comparing Publicly Listed vs. Fund-Reported Measures of Private Equity Performance
How big an effect can the subjective nature of reported private equity returns have on performance? To answer this question, we use as our proxy of private equity performance the index of post-fee equity returns that we calculated from the Cambridge Associates Private Investments Database (referred to herein as the CA fund-reported proxy). The CA database contains historical performance for over 1,700 fund managers, and we include in our calculation all Buyout, Growth Equity, Mezzanine, and Private Equity Energy funds across all geographies. Figure A1 below compares the performance of the Red Rocks publicly listed proxy to the CA fund-reported proxy of private equity performance.
Figure A1
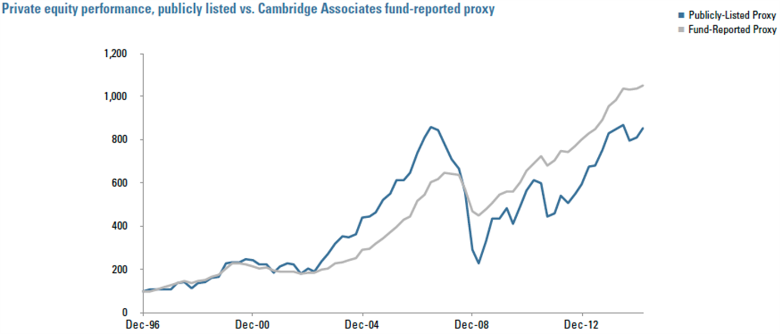
It is striking from Figure A1 how much private equity performance measurement is sensitive to the valuation methodology used. The fund-reported proxy’s performance is both much stronger and much smoother than the performance of the publicly listed proxy, most notably around the global financial crisis. Not only does the fund-reported proxy report better overall performance, it also exhibits better risk-adjusted returns, and especially during time of acute market stress! For example, we show in Table A1 below that the Sharpe ratio of the fund-reported proxy is more than double than that of the publicly listed proxy:
Table A1
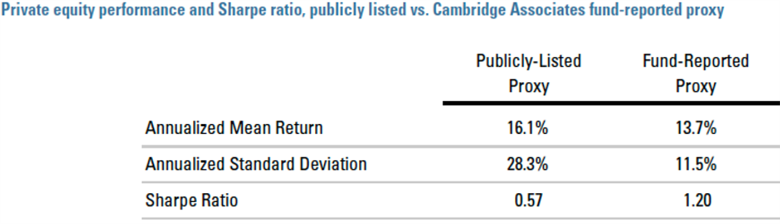
It is also interesting in Table 4 that that the fund-reported proxy has a lower mean return than the publicly listed proxy, even though it ends up at a higher level in Figure 3. This seemingly contradictory pattern is just another manifestation of the return smoothing of the fund-reported proxy. The CA fund-reported proxy has a lower arithmetic average return, but its compounded growth rate ends up being higher because its returns are so much smoother.
Note that our Red Rocks publicly listed proxy commences its actual performance in September of 2007 and so the index performance prior to that date is back filled by the index provider. Also, our CA fund-reported proxy does not have complete coverage of all the investments of its reporting funds, as it covers approximately 80% of the covered funds’ investments. Nevertheless, it is unlikely that these limitations are responsible for the effects documented here.
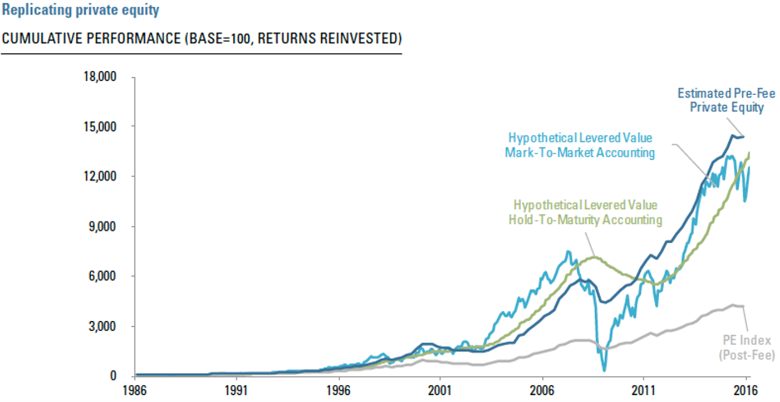
Finally, our finding is robust to using a different type of analysis. For example, Professor Stafford of Harvard Business School reported even stronger effects in his 2015 paper titled “Replicating Private Equity with Value Investing, Homemade Leverage, and Hold-to-Maturity Accounting.” His replicating approach applies the two different valuation methodologies to a private-equity mimicking portfolio of small stocks, and results in similar but more pronounced return smoothing effects. Adapted from this paper, Figure A2 graphically illustrates these effects.
Figure A2
Endnotes
- The security mentioned is being used as an example and should not be construed as investment advice to buy or sell a specific security.
Legal Disclaimer
These materials provided herein may contain material, non-public information within the meaning of the United States Federal Securities Laws with respect to Acadian Asset Management LLC, Acadian Asset Management Inc. and/or their respective subsidiaries and affiliated entities. The recipient of these materials agrees that it will not use any confidential information that may be contained herein to execute or recommend transactions in securities. The recipient further acknowledges that it is aware that United States Federal and State securities laws prohibit any person or entity who has material, non-public information about a publicly-traded company from purchasing or selling securities of such company, or from communicating such information to any other person or entity under circumstances in which it is reasonably foreseeable that such person or entity is likely to sell or purchase such securities.
Acadian provides this material as a general overview of the firm, our processes and our investment capabilities. It has been provided for informational purposes only. It does not constitute or form part of any offer to issue or sell, or any solicitation of any offer to subscribe or to purchase, shares, units or other interests in investments that may be referred to herein and must not be construed as investment or financial product advice. Acadian has not considered any reader's financial situation, objective or needs in providing the relevant information.
The value of investments may fall as well as rise and you may not get back your original investment. Past performance is not necessarily a guide to future performance or returns. Acadian has taken all reasonable care to ensure that the information contained in this material is accurate at the time of its distribution, no representation or warranty, express or implied, is made as to the accuracy, reliability or completeness of such information.
This material contains privileged and confidential information and is intended only for the recipient/s. Any distribution, reproduction or other use of this presentation by recipients is strictly prohibited. If you are not the intended recipient and this presentation has been sent or passed on to you in error, please contact us immediately. Confidentiality and privilege are not lost by this presentation having been sent or passed on to you in error.
Acadian’s quantitative investment process is supported by extensive proprietary computer code. Acadian’s researchers, software developers, and IT teams follow a structured design, development, testing, change control, and review processes during the development of its systems and the implementation within our investment process. These controls and their effectiveness are subject to regular internal reviews, at least annual independent review by our SOC1 auditor. However, despite these extensive controls it is possible that errors may occur in coding and within the investment process, as is the case with any complex software or data-driven model, and no guarantee or warranty can be provided that any quantitative investment model is completely free of errors. Any such errors could have a negative impact on investment results. We have in place control systems and processes which are intended to identify in a timely manner any such errors which would have a material impact on the investment process.
Acadian Asset Management LLC has wholly owned affiliates located in London, Singapore, and Sydney. Pursuant to the terms of service level agreements with each affiliate, employees of Acadian Asset Management LLC may provide certain services on behalf of each affiliate and employees of each affiliate may provide certain administrative services, including marketing and client service, on behalf of Acadian Asset Management LLC.
Acadian Asset Management LLC is registered as an investment adviser with the U.S. Securities and Exchange Commission. Registration of an investment adviser does not imply any level of skill or training.
Acadian Asset Management (Singapore) Pte Ltd, (Registration Number: 199902125D) is licensed by the Monetary Authority of Singapore. It is also registered as an investment adviser with the U.S. Securities and Exchange Commission.
Acadian Asset Management (Australia) Limited (ABN 41 114 200 127) is the holder of Australian financial services license number 291872 ("AFSL"). It is also registered as an investment adviser with the U.S. Securities and Exchange Commission. Under the terms of its AFSL, Acadian Asset Management (Australia) Limited is limited to providing the financial services under its license to wholesale clients only. This marketing material is not to be provided to retail clients.
Acadian Asset Management (UK) Limited is authorized and regulated by the Financial Conduct Authority ('the FCA') and is a limited liability company incorporated in England and Wales with company number 05644066. Acadian Asset Management (UK) Limited will only make this material available to Professional Clients and Eligible Counterparties as defined by the FCA under the Markets in Financial Instruments Directive, or to Qualified Investors in Switzerland as defined in the Collective Investment Schemes Act, as applicable.