20 Years of Low-Volatility Equities: A Brief Performance Survey
Table of contents
Introduction
Since 1998, in developed and emerging markets, lower-volatility stocks have outperformed higher-volatility stocks, while exhibiting lower total risk. These stocks have tended to outperform cap-weighted benchmarks in falling markets, and to underperform those benchmarks in rising markets. Eliminating in this way the equity market’s “high highs and low lows,” while exploiting a general and pervasive mispricing of risk, has allowed low-volatility stocks over time to earn market returns (or better) on average, with materially lower risk.
To study the 20-year performance history of low-volatility equities around the world, we formed hypothetical low-beta portfolios within 4 stock universes: developed markets, emerging markets, developed non-U.S., and the U.S.1 In each market, we used 60-month (5-year) rolling estimates of beta to form equal-capitalization quintiles of stocks on beta.2 We then capitalization weighted the lowest-beta quintile, and we reviewed cumulative 12-month performance histories of these hypothetical low-volatility portfolios in rising and falling markets. For all stocks and markets, we measured returns in USD; we used the U.S. 1-month T-bill rate as the risk-free rate (in CAPM beta estimation); and we estimated stock betas against the relevant cap-weighted market aggregate (developed markets, emerging markets, developed non- U.S., or the U.S.). Our stock return data is from the S&P BMI database.3
Our findings directly reflect the CAPM betas of the stocks we study: we find that lower-beta equities have tended to realize negative active returns in strongly rising markets, and that they have tended to realize positive active returns in falling markets. There is some degree of variation from year to year, but the broad contours of performance are strongly consistent with the stocks’ lower betas. Regarding recent performance, we observe nothing atypical about the most recent 12 months, ending April 2017, relative to historical patterns.
Figure 1 plots cumulative benchmark-relative performance for the hypothetical U.S. low-volatility portfolio, in rising (blue bars, left side) and falling (gray bars, right side) markets. Performance histories are for the 12 months ending in April of each year 1999-2017. (April 2017 is the latest observation in our dataset.) There are 19 full, 12-month periods between April 1998 and April 2017, of which 6 were periods in which the aggregate U.S. market realized negative returns, while in the remaining years the aggregate U.S. market realized positive returns. Active returns for the low-volatility portfolio in the most recent 12 month period, ending in April 2017, is highlighted in green.
Patterns in Figure 1 are consistent with the low-beta characteristic of the hypothetical portfolio. In quickly rising markets (blue bars), the tendency is toward underperformance, although, in no case does the low-beta portfolio realize negative absolute returns. Underperformance for the most recent 12-month period, ending April 2017, is in the middle of the historical distribution. In contrast, the tendency in falling markets (gray bars) is for outperformance.
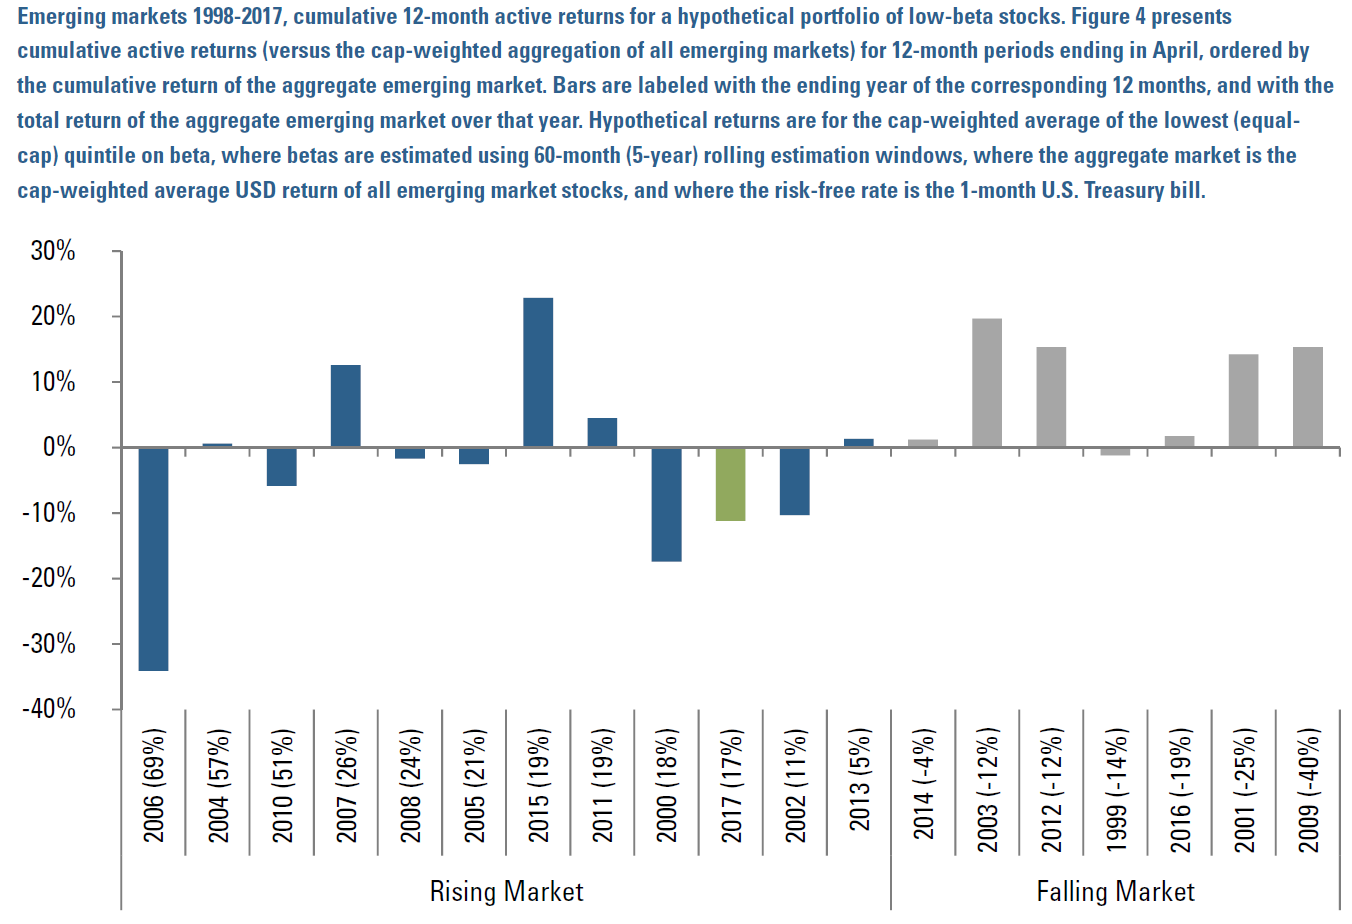
We conducted similar analyses for developed markets, developed markets excluding the U.S., and emerging markets, and we found broadly consistent patterns. Figures 2, 3, and 4 present results for, respectively, developed markets, developed markets excluding the U.S., and emerging markets, for the same 1998-2017 time period.
Figure 1
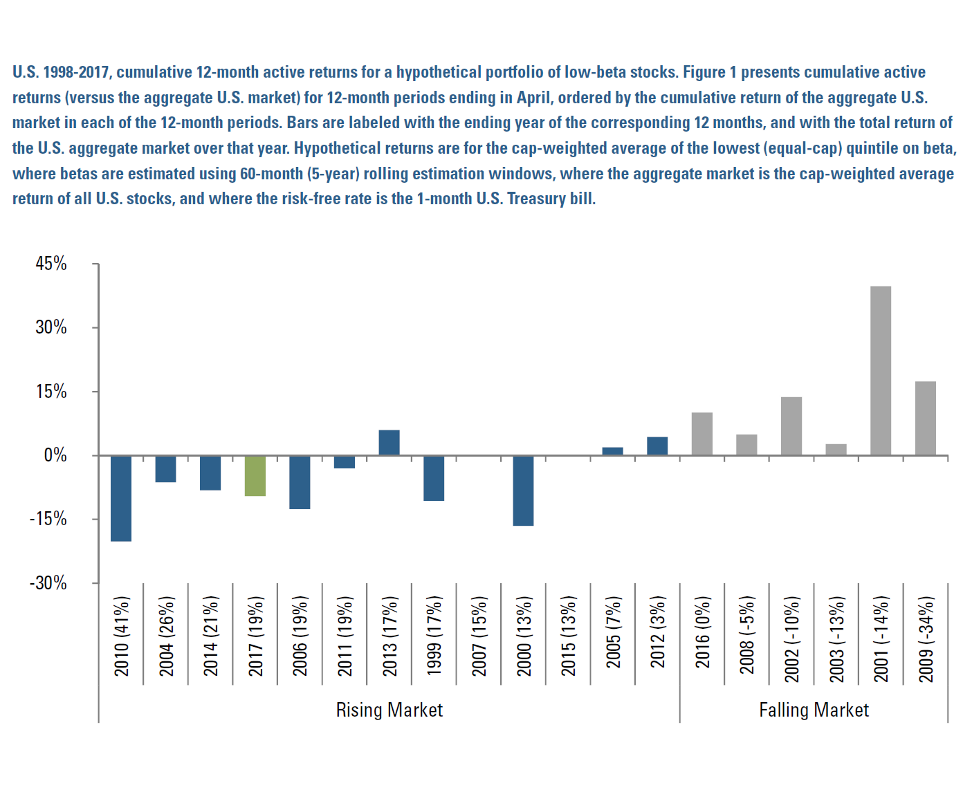
Figure 2
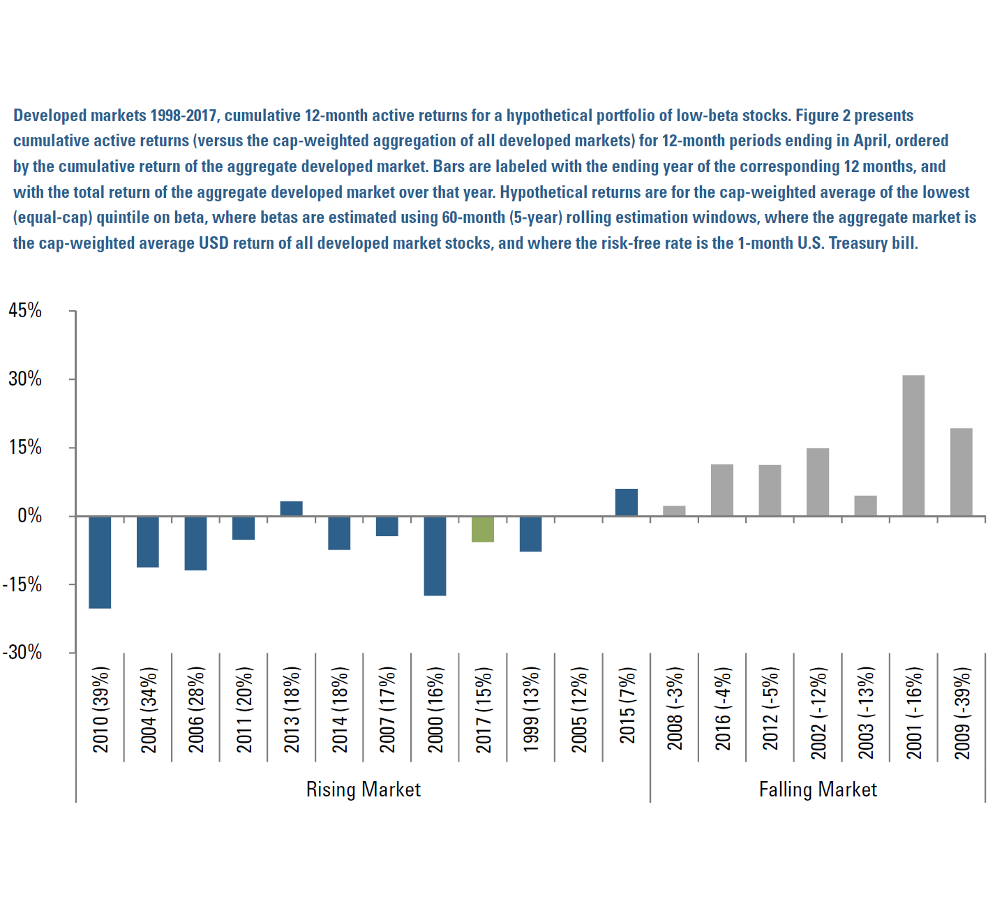
Figure 3
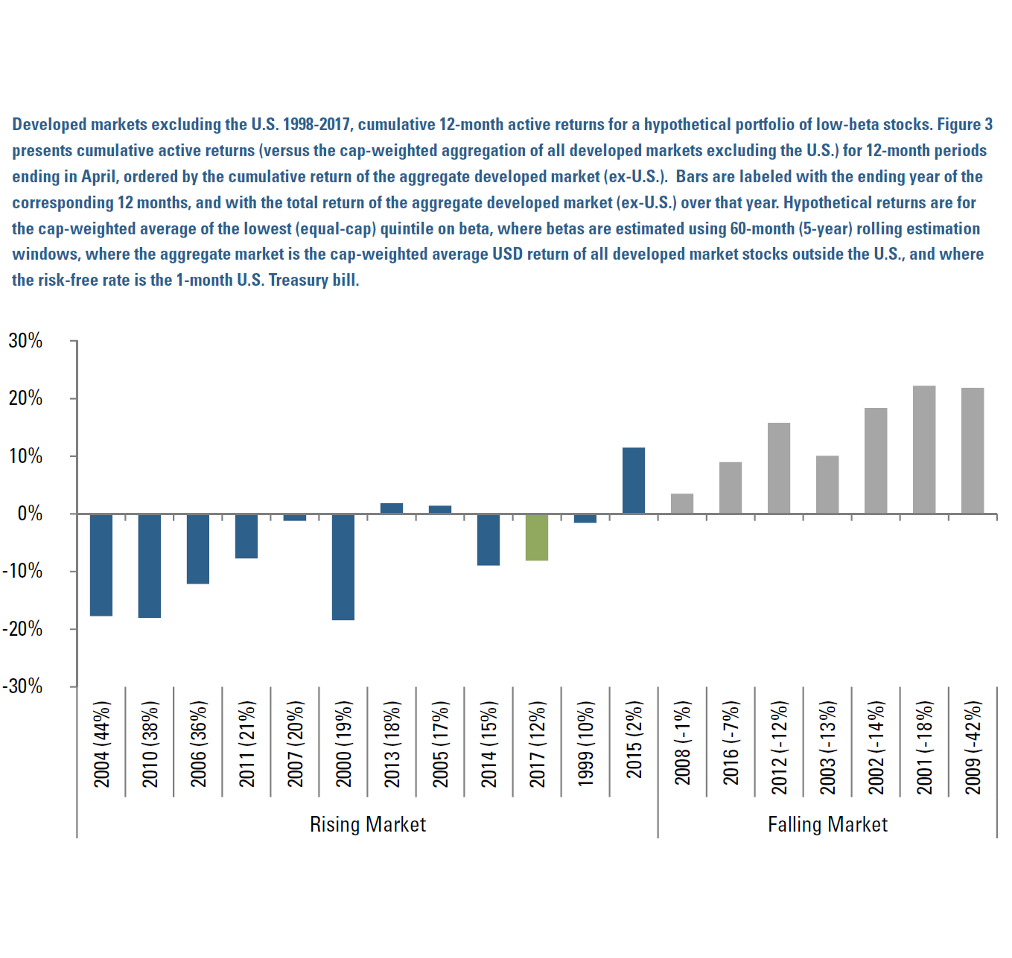
Figure 4
The picture across all markets is consistent. Over shorter time periods, such as our 12-month cumulations, lower-beta stocks earn returns generally consistent with their betas. In quickly rising markets they tend to realize some, but not all, of the aggregate market’s positive returns, while in falling markets they tend to realize some, but not all, of the aggregate market’s negative returns. (Outside the scope of this brief survey, in gently rising markets lower-beta stocks tend to earn returns similar to market aggregates.)
Over longer horizons, lower-beta stocks have tended to earn cumulative returns similar to, or even higher than, market aggregates, reflecting both the improved compounding of lower-volatility return streams, and the general mispricing of risk in equity markets. Their lower total volatility is attributable to attenuating the “high highs and low lows” of the broader equity markets, by outperforming in falling markets and underperforming in rising markets.
Endnotes
- For illustrative purposes only. These exhibits are not intended to represent investment returns generated by actual portfolios. They do not represent actual trading or actual accounts. Results do not reflect management fees, transaction costs, other implementation costs or their potential impact. Hypothetical results are not indicative of actual future results. Every investment program has the opportunity for loss as well as profit.
- We use 60 monthly returns for stability (each month, 59 of 60 estimation data points are the same as for the prior month, so beta estimates do not change too rapidly) and for consistency with prior research in the academic literature. See, e.g., Baker et al., “Benchmarks as Limits to Arbitrage: Understanding the Low-Volatility Anomaly,” Financial Analysts Journal 67 (1), 40-54, and citations therein.
- Copyright © 2017, Standard & Poor’s Financial Services LLC. All rights reserved.
Hypothetical Legal Disclaimer
Acadian is providing hypothetical performance information for your review as we believe you have access to resources to independently analyze this information and have the financial expertise to understand the risks and limitations of the presentation of hypothetical performance. Please immediately advise if that is not the case.
Hypothetical performance results have many inherent limitations, some of which are described below. No representation is being made that any account will or is likely to achieve profits or losses similar to those shown. In fact, there are frequently sharp differences between hypothetical performance results and the actual performance results subsequently achieved by any particular trading program.
One of the limitations of hypothetical performance results is that they are generally prepared with the benefit of hindsight. In addition, hypothetical trading does not involve financial risk, and no hypothetical trading record can completely account for the impact of financial risk in actual trading. For example, the ability to withstand losses or to adhere to a particular trading program in spite of trading losses are material points which can also adversely affect actual trading results. There are numerous other factors related to the markets in general or to the implementation of any specific trading program which cannot be fully accounted for in the preparation of hypothetical performance results and all of which can adversely affect actual trading results.
Don't miss the next Acadian Insight
Get our latest thought leadership delivered to your inbox
Legal Disclaimer
These materials provided herein may contain material, non-public information within the meaning of the United States Federal Securities Laws with respect to Acadian Asset Management LLC, Acadian Asset Management Inc. and/or their respective subsidiaries and affiliated entities. The recipient of these materials agrees that it will not use any confidential information that may be contained herein to execute or recommend transactions in securities. The recipient further acknowledges that it is aware that United States Federal and State securities laws prohibit any person or entity who has material, non-public information about a publicly-traded company from purchasing or selling securities of such company, or from communicating such information to any other person or entity under circumstances in which it is reasonably foreseeable that such person or entity is likely to sell or purchase such securities.
Acadian provides this material as a general overview of the firm, our processes and our investment capabilities. It has been provided for informational purposes only. It does not constitute or form part of any offer to issue or sell, or any solicitation of any offer to subscribe or to purchase, shares, units or other interests in investments that may be referred to herein and must not be construed as investment or financial product advice. Acadian has not considered any reader's financial situation, objective or needs in providing the relevant information.
The value of investments may fall as well as rise and you may not get back your original investment. Past performance is not necessarily a guide to future performance or returns. Acadian has taken all reasonable care to ensure that the information contained in this material is accurate at the time of its distribution, no representation or warranty, express or implied, is made as to the accuracy, reliability or completeness of such information.
This material contains privileged and confidential information and is intended only for the recipient/s. Any distribution, reproduction or other use of this presentation by recipients is strictly prohibited. If you are not the intended recipient and this presentation has been sent or passed on to you in error, please contact us immediately. Confidentiality and privilege are not lost by this presentation having been sent or passed on to you in error.
Acadian’s quantitative investment process is supported by extensive proprietary computer code. Acadian’s researchers, software developers, and IT teams follow a structured design, development, testing, change control, and review processes during the development of its systems and the implementation within our investment process. These controls and their effectiveness are subject to regular internal reviews, at least annual independent review by our SOC1 auditor. However, despite these extensive controls it is possible that errors may occur in coding and within the investment process, as is the case with any complex software or data-driven model, and no guarantee or warranty can be provided that any quantitative investment model is completely free of errors. Any such errors could have a negative impact on investment results. We have in place control systems and processes which are intended to identify in a timely manner any such errors which would have a material impact on the investment process.
Acadian Asset Management LLC has wholly owned affiliates located in London, Singapore, and Sydney. Pursuant to the terms of service level agreements with each affiliate, employees of Acadian Asset Management LLC may provide certain services on behalf of each affiliate and employees of each affiliate may provide certain administrative services, including marketing and client service, on behalf of Acadian Asset Management LLC.
Acadian Asset Management LLC is registered as an investment adviser with the U.S. Securities and Exchange Commission. Registration of an investment adviser does not imply any level of skill or training.
Acadian Asset Management (Singapore) Pte Ltd, (Registration Number: 199902125D) is licensed by the Monetary Authority of Singapore. It is also registered as an investment adviser with the U.S. Securities and Exchange Commission.
Acadian Asset Management (Australia) Limited (ABN 41 114 200 127) is the holder of Australian financial services license number 291872 ("AFSL"). It is also registered as an investment adviser with the U.S. Securities and Exchange Commission. Under the terms of its AFSL, Acadian Asset Management (Australia) Limited is limited to providing the financial services under its license to wholesale clients only. This marketing material is not to be provided to retail clients.
Acadian Asset Management (UK) Limited is authorized and regulated by the Financial Conduct Authority ('the FCA') and is a limited liability company incorporated in England and Wales with company number 05644066. Acadian Asset Management (UK) Limited will only make this material available to Professional Clients and Eligible Counterparties as defined by the FCA under the Markets in Financial Instruments Directive, or to Qualified Investors in Switzerland as defined in the Collective Investment Schemes Act, as applicable.