
Value's Intricacies and the Margin of Safety
Table of contents
August 2016
Value And Drawdown Protection
At a recent client meeting about Crash Risk, the CIO of a large public plan asked whether value stocks might provide protection in the event of a market downturn, similar to a low volatility portfolio. Traditional conceptions of value might suggest so, perhaps hearkening back to Benjamin Graham’s “margin of safety” or reflecting a sense that value stocks include solid, unglamorous firms such as utilities and consumer staples, which we might instinctively think of as lower beta defensives. But the concept of value is complex and dynamic, and inferences based on such conventional wisdom could be misleading, especially if implemented through rudimentary value formulations.
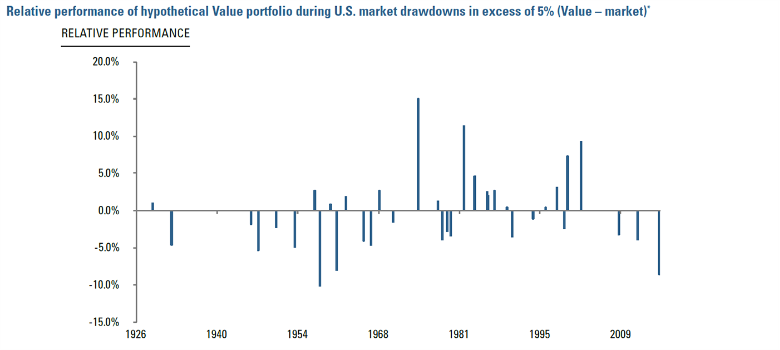
To illustrate, Figure 1 charts relative peak-to-trough drawdowns of a hypothetical B/P-based value portfolio compared to the market during episodes when the cap-weighted index lost at least 5%. Based on this simple definition, it doesn’t seem clear that value affords relative protection. Among several possible explanations as to why, high B/P firms may be relatively inflexible in scaling down operations or reducing costs, and therefore they may be susceptible to deterioration of economic conditions.1 High B/P ratios, in isolation, might also reflect distress.
Figure 1
For investors seeking safety in value, at least based on archetypical B/P, it’s also worth recalling recent changes in sector composition. Figure 2 shows a 30-year history of sector active weights of a hypothetical B/P-based portfolio relative to the cap-weighted market. The value quintile developed a large overweight in financials during the GFC. More recently, mining and energy stocks increased in relative weight. Those outsize positions grew at the expense of sectors that include traditional manufacturing and communications. As well, utilities’ active overweight is considerably lower than it was during the 1990s.2
Accompanying these sector dynamics, we saw a material change in the relative betas of value stocks. While Figure 3 shows a prior tendency for high B/P value stocks to have relatively lower betas, it also shows that post-GFC the opposite became true. This may help to explain the recent pattern, in Figure 1, of value drawdowns in excess of market losses and undermine the notion that this simple measure of value, at least in isolation, provides a robust margin of safety.
Figure 2
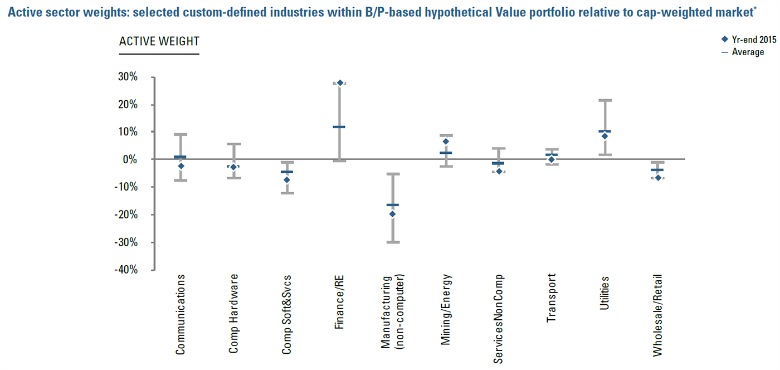
*Industries custom-defined based on 1987 SIC code definitions. On each annual formation date, hypothetical value portfolio formed by sorting stocks in the CRSP universe for which Compustat book value data is available into equal capitalization quintiles on the basis of B/P ratio. Value portfolio represents highest B/P quintile. B/P ratios calculated based on Compustat book value lagged at least 3 months and CRSP market capitalization data as of formation date. For illustrative purposes only. This is meant to be an educational illustrative example that shows attributes of a hypothetical portfolio; it does not represent characteristics of an actual portfolio or associated with actual trading. Hypothetical results are not indicative of actual future results. Source: Acadian estimates and calculations based on data from CRSP and Compustat.
Figure 3
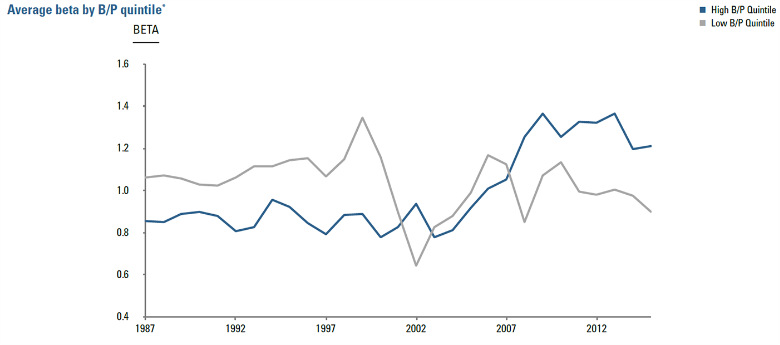
For illustrative purposes only. This is meant to be an educational illustrative example and is not intended to represent investment returns generated by an actual portfolio. They do not represent actual trading or an actual account, but were achieved by means of using the CRSP universe of securities as defined above. Hypothetical results are not indicative of actual future results. Every investment program has the opportunity for loss as well as profit. Source: Acadian estimates and calculations based on data from CRSP and Compustat.
Conclusion
The observations touched on here only scratch the surface of whether, and in what form, value might offer a margin of safety and, more broadly, the value premium’s behavior and its drivers:
Does the value premium represent compensation for economic risk? Or does it reflect a mispricing that may be consistent across economic environments?
Is variation in industry value metrics priced, or is the value premium largely derived from stock-level deviations from contemporaneous industry valuations?
How can we distinguish between value traps and unjustifiably cheap stocks? What value metrics, other than B/P, might help, and what is the most efficient form in which to incorporate them?
Are there intrinsic relationships between value and other risk factors / mispricings, e.g., quality and momentum, that are essential to understanding the nature of the value premium and risk associated with it?
Such questions highlight the benefits of an active quantitative approach to exploiting value, including a multi-factor orientation, integration of bottom-up and top-down research and implementation, as well as rich risk modeling and portfolio construction. That they are all subjects of academic discussion also emphasizes the importance of ongoing research by practitioners.
While value may be the longest established and most widely accepted of factors, it encompasses substantial complexity and dynamism. As such, integration of value into a portfolio isn’t a simple matter. Implementations via rudimentary, set-and-forget vehicles may not fulfill investor expectations.
Endnotes
- E.g., see Huseyin Gulen, Xing, Yuhang, and Zhang, Lu, Value versus Growth: Time-Varying Expected Stock Returns, Working Paper, September 2008.
- Of course material sector dynamics in certain value formulations aren’t new. Around the technology bubble, active weights of computer-related and telecom stocks first fell and then jumped as valuations expanded and then collapsed.
Legal Disclaimer
These materials provided herein may contain material, non-public information within the meaning of the United States Federal Securities Laws with respect to Acadian Asset Management LLC, Acadian Asset Management Inc. and/or their respective subsidiaries and affiliated entities. The recipient of these materials agrees that it will not use any confidential information that may be contained herein to execute or recommend transactions in securities. The recipient further acknowledges that it is aware that United States Federal and State securities laws prohibit any person or entity who has material, non-public information about a publicly-traded company from purchasing or selling securities of such company, or from communicating such information to any other person or entity under circumstances in which it is reasonably foreseeable that such person or entity is likely to sell or purchase such securities.
Acadian provides this material as a general overview of the firm, our processes and our investment capabilities. It has been provided for informational purposes only. It does not constitute or form part of any offer to issue or sell, or any solicitation of any offer to subscribe or to purchase, shares, units or other interests in investments that may be referred to herein and must not be construed as investment or financial product advice. Acadian has not considered any reader's financial situation, objective or needs in providing the relevant information.
The value of investments may fall as well as rise and you may not get back your original investment. Past performance is not necessarily a guide to future performance or returns. Acadian has taken all reasonable care to ensure that the information contained in this material is accurate at the time of its distribution, no representation or warranty, express or implied, is made as to the accuracy, reliability or completeness of such information.
This material contains privileged and confidential information and is intended only for the recipient/s. Any distribution, reproduction or other use of this presentation by recipients is strictly prohibited. If you are not the intended recipient and this presentation has been sent or passed on to you in error, please contact us immediately. Confidentiality and privilege are not lost by this presentation having been sent or passed on to you in error.
Acadian’s quantitative investment process is supported by extensive proprietary computer code. Acadian’s researchers, software developers, and IT teams follow a structured design, development, testing, change control, and review processes during the development of its systems and the implementation within our investment process. These controls and their effectiveness are subject to regular internal reviews, at least annual independent review by our SOC1 auditor. However, despite these extensive controls it is possible that errors may occur in coding and within the investment process, as is the case with any complex software or data-driven model, and no guarantee or warranty can be provided that any quantitative investment model is completely free of errors. Any such errors could have a negative impact on investment results. We have in place control systems and processes which are intended to identify in a timely manner any such errors which would have a material impact on the investment process.
Acadian Asset Management LLC has wholly owned affiliates located in London, Singapore, and Sydney. Pursuant to the terms of service level agreements with each affiliate, employees of Acadian Asset Management LLC may provide certain services on behalf of each affiliate and employees of each affiliate may provide certain administrative services, including marketing and client service, on behalf of Acadian Asset Management LLC.
Acadian Asset Management LLC is registered as an investment adviser with the U.S. Securities and Exchange Commission. Registration of an investment adviser does not imply any level of skill or training.
Acadian Asset Management (Singapore) Pte Ltd, (Registration Number: 199902125D) is licensed by the Monetary Authority of Singapore. It is also registered as an investment adviser with the U.S. Securities and Exchange Commission.
Acadian Asset Management (Australia) Limited (ABN 41 114 200 127) is the holder of Australian financial services license number 291872 ("AFSL"). It is also registered as an investment adviser with the U.S. Securities and Exchange Commission. Under the terms of its AFSL, Acadian Asset Management (Australia) Limited is limited to providing the financial services under its license to wholesale clients only. This marketing material is not to be provided to retail clients.
Acadian Asset Management (UK) Limited is authorized and regulated by the Financial Conduct Authority ('the FCA') and is a limited liability company incorporated in England and Wales with company number 05644066. Acadian Asset Management (UK) Limited will only make this material available to Professional Clients and Eligible Counterparties as defined by the FCA under the Markets in Financial Instruments Directive, or to Qualified Investors in Switzerland as defined in the Collective Investment Schemes Act, as applicable.