
Value and Interest Rates: Don’t Believe (All) the Hype
Key Takeaways
- Prevalent narratives that imply a straightforward causal relationship between interest rates and the performance of equity value strategies are oversimplified.
- The relationship is determined by the confluence of many forces. Depending on circumstances, including the state of the economy, the policy environment, and market sentiment, rising (or falling) interest rates may bode either well or poorly for value stocks.
- The relationship also depends on how value is defined and implemented. Therefore, investors should not anticipate that different value strategies will respond similarly to movements in interest rates.
Table of contents
In the decade following the GFC, the relationship between equity value and interest rates came under scrutiny as investors sought to explain the disappointing performance of many value strategies. Practitioners and academics debated whether historically low interest rates were to blame. And recently, some have interpreted the subsequent rebound of both interest rates and value as further evidence of a direct relationship. Such narratives are often rooted in duration-based arguments that assume growth stocks have more distant cash flows than value stocks, which makes their prices more sensitive to interest rate changes. This causal reasoning implies that asset owners should expect value strategies to reliably underperform when interest rates fall and outperform when they rise. It also could motivate timing value investments based on the outlook for interest rates.
In our view, however, investors should not expect such a straightforward relationship between interest rates and value. Recent academic research has cast doubt on the significance of the duration effect, finding that cash flows of growth stocks do not actually grow meaningfully faster than those of value stocks (Chen 2017).1 Moreover, we believe that any causal relationship is often overwhelmed by forces that separately influence interest rates and value returns, including the state of the economy, the policy environment, and market sentiment. As a result, rising (or falling) rates may bode well or poorly for value stocks, depending on the underlying circumstances.
In this note, we provide evidence that challenges oversimplified narratives about interest rates and value. By a conventional measure, value appears to have become steadily more sensitive to interest rates since the GFC; however, we show that the phenomenon appears less significant and shorter-term once we control for confounding effects. We then contrast the recent joint behavior of value and interest rates to historical periods in which it has differed, demonstrating that the relationship depends on changing circumstances.
Value and Rates: Nuanced Context
Figure 1 compactly captures why the relationship between value and interest rates has come under scrutiny. For a conventional representation of value, the Fama-French long-short high-minus-low B/P factor (“HML”), it shows that: 1) a historic post-GFC run of poor performance coincided with 10-year Treasury yields falling to historic lows, and 2) that this value factor and interest rates have both recently rebounded.
Figure 1: U.S. B/P-Based “HML” Value Factor Performance and 10-Year U.S. Treasury Yields
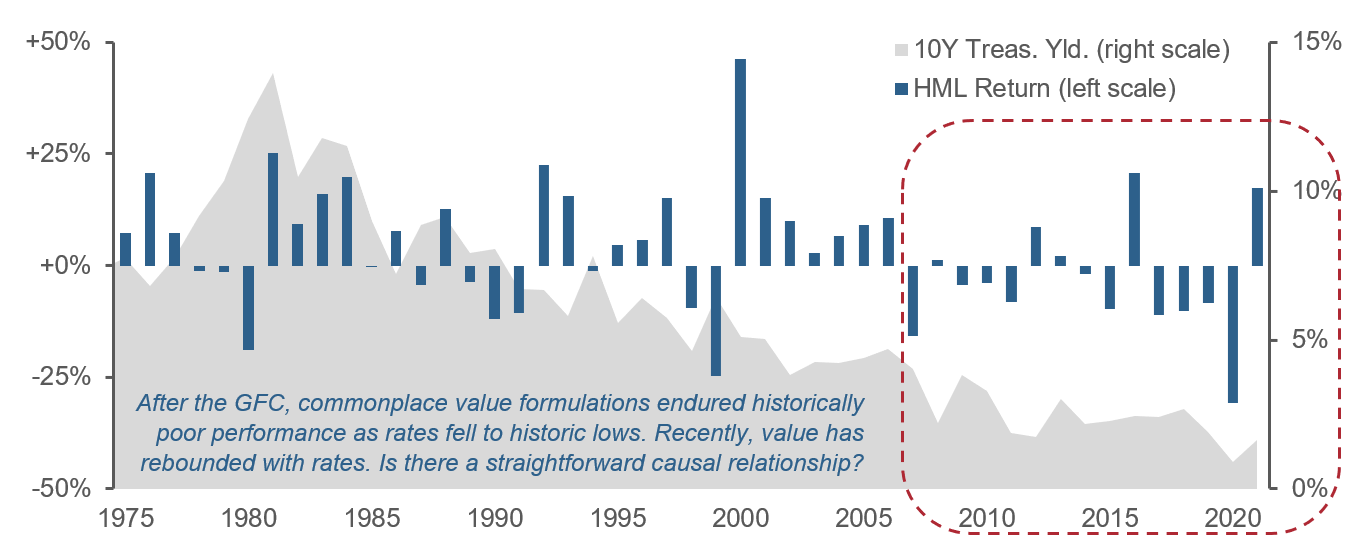
Figure 2 provides an even more direct picture of the relationship between the two, showing the beta of the HML portfolio to 10-year Treasury returns. Although we suspect that it is more natural for equity investors to think in terms of sensitivity to interest rates rather than to bond returns, we base this portion of the analysis on the latter to normalize for changes in both the level of interest rates and 10-year Treasury duration over the long sample period.2
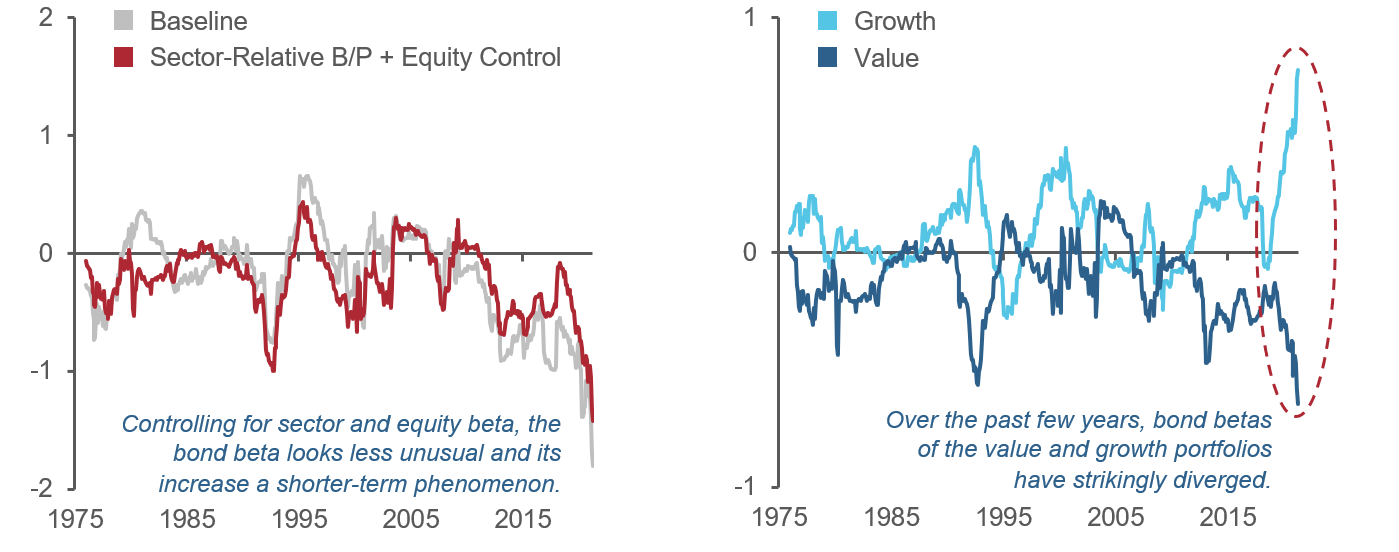
Figure 2: Bond Beta of the HML Value Factor
Calculated relative to 10-year U.S. Treasury excess returns over 36-month rolling windows
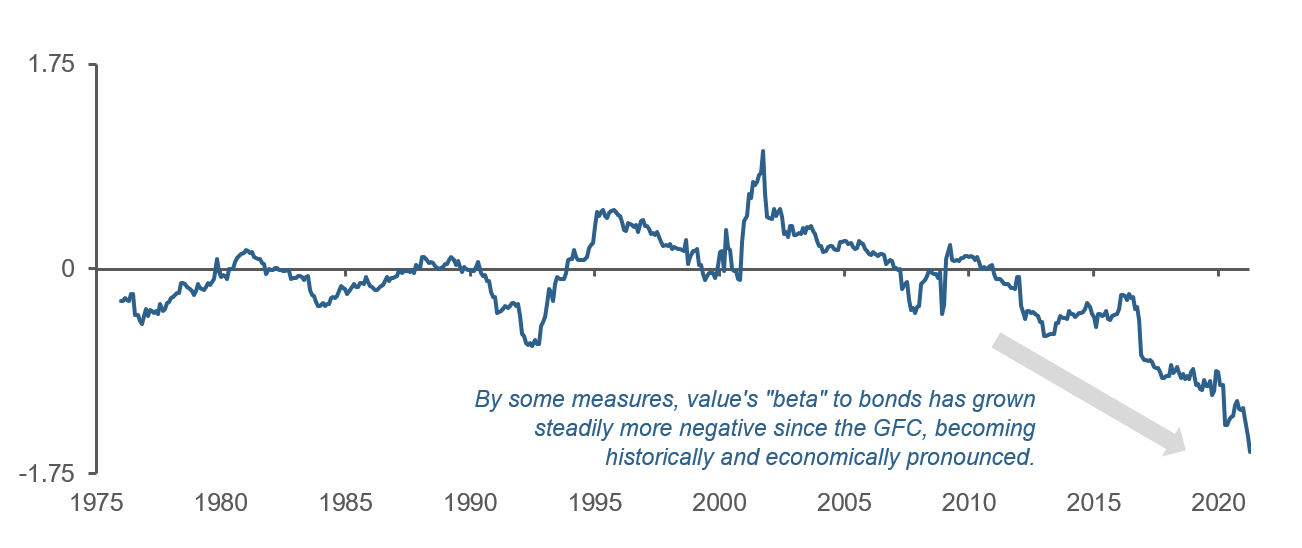
The right portion of the chart seems to confirm that value’s returns have been quite negatively sensitive to bond returns and have become steadily more so since the GFC (at least). To calibrate the economic significance of the relationship, the recently estimated bond beta of -1.6 implies that a roughly one-standard deviation monthly Treasury return of ±2% (historically) would generate a roughly ∓3.2% return for the long-short value-minus-growth portfolio.3
But as is often the case with popular investing narratives, upon closer examination we find a more complex—and in this case likely less significant—story than headlines suggest. First, looking left across Figure 2, we see no long-term evidence that value has an economically large and consistent bond beta. The beta over the full sample period is small, -0.09. Moreover, the bond beta is quite variable, sometimes negative but sometimes positive, and prone to quick reversals. In other words, the chart does not provide evidence of a reliable relationship where rising interest rates cause significant gains for value and falling rates cause significant losses (or the opposite).
Second, although the HML value factor portfolio reflects the most prevalent representation of “value” in the literature, it dates back to the early 1990s. Unsurprisingly, its formulation is rudimentary compared to modern value implementations designed to precisely isolate mispriced fundamentals based on specific behavioral or structural logic.4 Unrefined implementations often exhibit material and time varying exposure to risk factors that may influence their interest-rate sensitivity and that, in our view, are not intrinsic to capturing value-related premia.
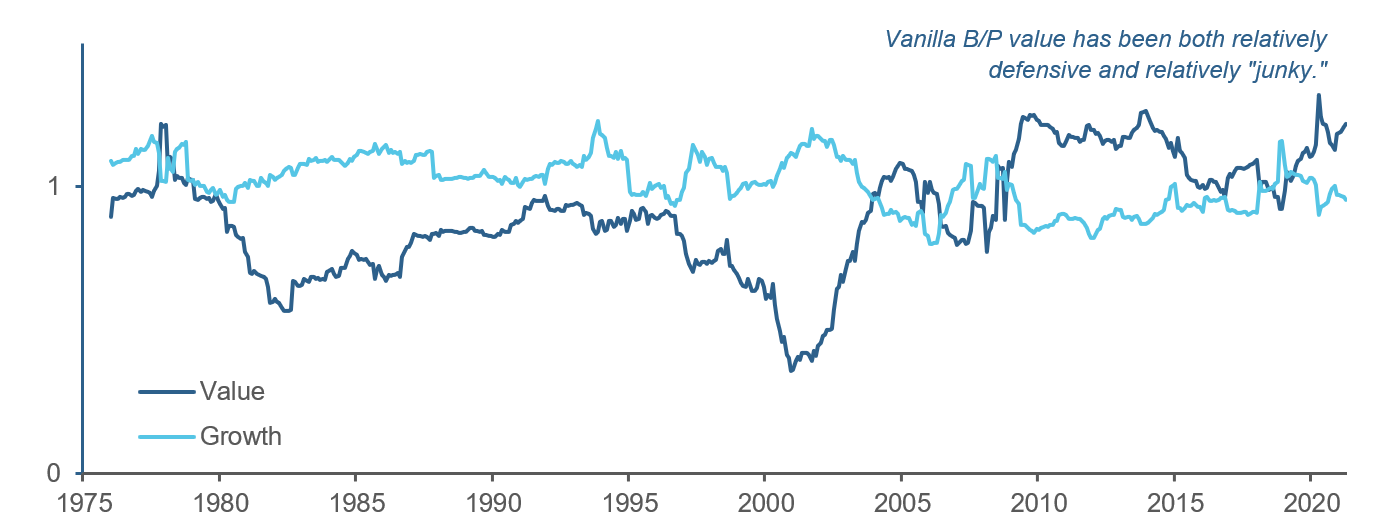
To illustrate, Figure 3 shows that the sectoral compositions of U.S. large-cap value and growth quintile portfolios have changed enormously over time and currently have remarkably little overlap. While the value quintile was once dominated by utilities, it is now almost 50% financials. In the growth quintile, technology’s weight has jumped more than 35% in only five years. Moreover, the equity betas of these portfolios have also varied considerably over time. As we commented on several years ago, vanilla B/P value exhibited a decidedly defensive character in the early 2000s, but since the GFC it has become “junky” relative to growth (Figure 4).5
Figure 3: Sector Composition—Large-Cap B/P-Based U.S. Value and Growth Quintile Portfolios
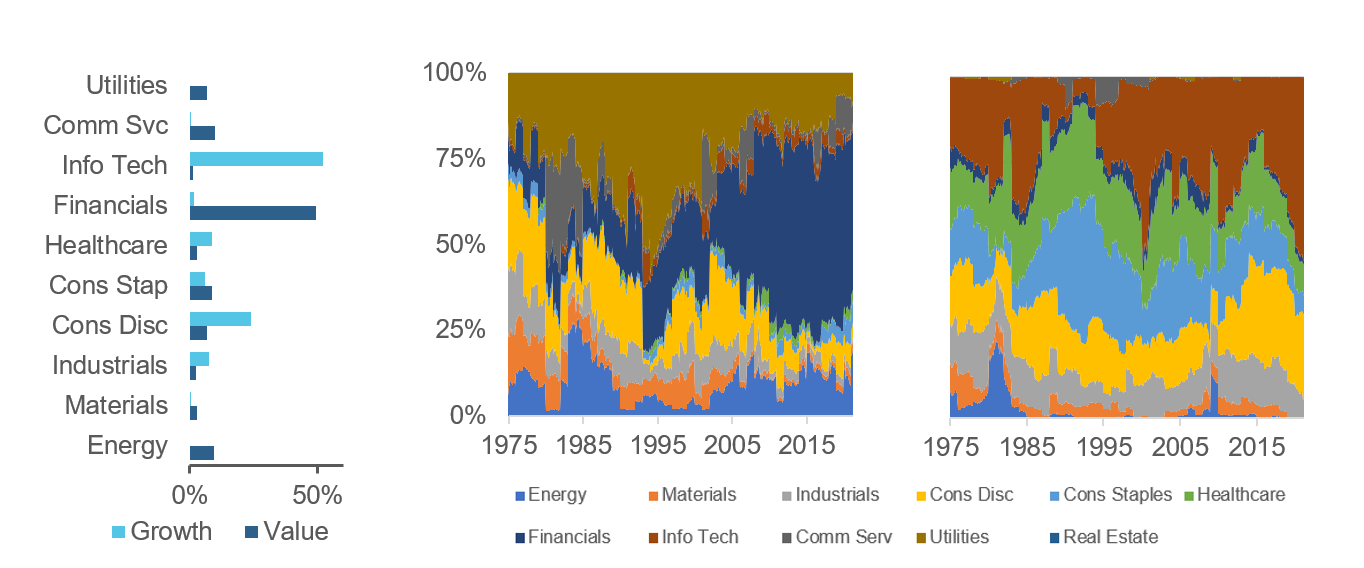
Figure 4: Equity Beta—Large-Cap B/P-Based U.S. Value and Growth Quintile Portfolios
The prior discussion motivates two adjustments in the estimation of value’s sensitivity to interest rates: 1) evaluating B/P on a sector-relative basis, and 2) adding a control for equity market exposure. These two modifications materially change the picture. First, they shrink value’s recent bond beta. For a large-cap long-short B/P value quintile portfolio, the bond beta estimated over the three years ending in April drops from -1.8 to -1.4. For a small-cap value portfolio, the reduction is larger, from -1.9 to -1.1
More important, the modifications reduce the overall variability of value’s measured bond beta through time and significantly alter its post-GFC trajectory. As shown in the left panel of Figure 5, after making the adjustments, we no longer see value’s sensitivity to rates growing so steadily more negative (compare red to grey). In fact, by this measure, the large-cap bond beta was near zero as recently as mid-2018 (based on data from the prior 36 months). Value’s historically high interest rate sensitivity relative to growth, therefore, appears to be a quite recent phenomenon. That sense is reinforced by the right panel, which breaks out the bond betas of the component long-only value and growth portfolios. The chart shows that over roughly the past three years the bond betas of the value and growth portfolios have diverged markedly. The natural question is why?
Figure 5: Bond Betas of Large-Cap U.S. Equity Portfolios
Drivers of Value-Rate Dynamics: Historical Perspective
To understand the recent behavior of value’s beta to bonds, we examine the drivers of value’s performance and interest rates over the past few years. We focus this discussion on a U.S. large-cap B/P-based formulation of value that typifies prevalent narratives on the topic. From late-2018 through much of 2019, this representation of value steadily underperformed growth. At the same time, bonds rallied; 10-year Treasury yields steadily declined by more than a point to less than 2%. The left panel of Figure 6 shows that during this period, the value-growth portfolio and Treasuries generated near mirror-image returns, consistent with the increasingly negative value-growth bond beta shown in Figure 5.
Figure 6: Recent Context—Value, Rates, and the Economy from 2018-2020
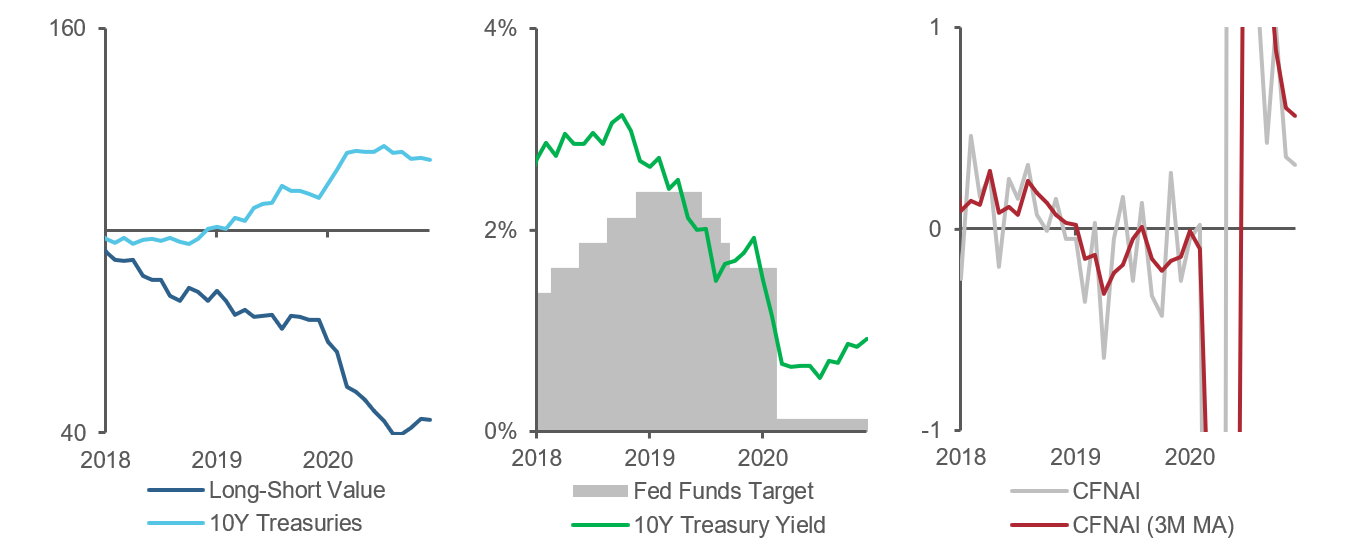
We attribute some of value’s underperformance directly (causally) to the behavior of interest rates, although to a sentiment effect rather than a simple cash flow duration-based explanation. As Treasury yields fell back towards what were then historic lows (pre-COVID), asset owners faced intensifying pressure to find sources of return that they saw as adequate to meet their performance targets. That pressure likely contributed to the bid for growth assets during 2019, and made it difficult for strategies positioned otherwise, including value-oriented investments, to keep up.6
But value’s negative bond beta during this period also reflected the influence of several other forces on both interest rates and equities. One such factor was the state of the economy. The Chicago Fed’s National Activity Index (CFNAI) shows that conditions were above long-term trend through mid-2018 but gradually deteriorated into the first few months of 2019 (Figure 6, right). That cooling simultaneously dampened both long-term interest rates as well as the earnings prospects of low P/B stocks whose fundamentals were already discounted by the market due to their sensitivity to economic conditions. Value stocks, by that definition, underperformed as their multiples contracted relative to more expensive, less cyclically geared stocks.
Expectations regarding future monetary policy also affected both interest rates and value stocks during this period. As signs of economic weakness emerged in late 2018, the bond market started to price in rate cuts even though the Fed was still hiking. After Fed Chair Powell signaled a pivot towards easing in January 2019, Treasuries steadily rallied; the 10-year yield fell to 2% before the central bank finally started to cut at the end of July (Figure 6, middle). Yet economic conditions were not sufficiently robust to benefit cyclically sensitive low B/P value stocks.
The analysis demonstrates that the relationship between interest rates and value depends on the investing climate. In 2019, economic conditions and the policy environment put downward pressure on interest rates and simultaneously set the stage for value underperformance. While this confluence of factors led to a negative bond beta during this period (subsequently magnified by COVID-related circumstances), in different contexts, economic conditions, the policy environment, market sentiment, and other forces might cause bonds and stocks to move in tandem.
The early 1990s provide an example. From 1992- 1995, economic conditions and Federal Reserve policy resulted in value’s bond beta becoming positive (see Figures 2 and 5). Figure 7 offers reminders of the economic and policy context from the time. In Q3 1990, the economy slipped into a shallow recession that was triggered by anti-inflationary rate hikes and the oil price shock that accompanied Iraq’s August invasion of Kuwait. The Fed’s policy response was strong; it steadily cut its target rate from 8% all the way to 3% by September 1992. Although economic activity quickly rebounded back to long-term trend, conditions remained uncertain in 1993, and inflation was subdued.
Figure 7: Case Study—The Early 1990s
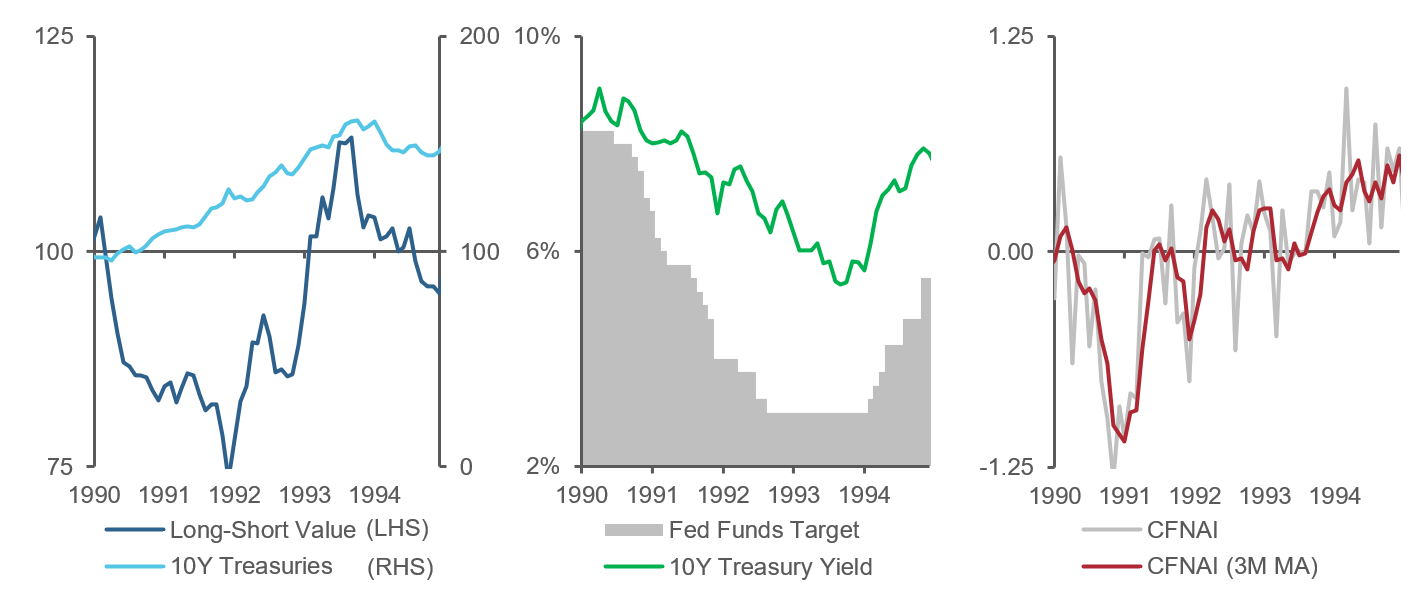
Figure 7-left shows that as a result of these economic and policy conditions, value and bonds simultaneously rallied during much of 1993: Treasury yields fell, with some investors anticipating further rate cuts,7while value stocks continued to rebound from their recessionary losses as their fundamentals recovered and multiples expanded. Value and bonds remained positively correlated in 1994, but this time both fell as conditions evolved. Surging economic activity caused bonds to sell off and the Fed to start raising rates. At the same time, value weakened in response to the tightening, reflecting multiple contraction.
The deflation of the TMT bubble provides a second example in which a confluence of factors resulted in a positive bond beta (Figure 8). This episode also highlights the influence of market sentiment on the relationship between interest rates and value in addition to economic and policy conditions. As tech valuations collapsed, value dramatically outperformed growth for much of 2000-2001. Bonds simultaneously rallied as deteriorating sentiment and economic softness weighed on Treasury yields in 2000 and as the Fed slashed policy rates beginning in January 2001.
Figure 8: Case Study—Aftermath of the TMT Bubble
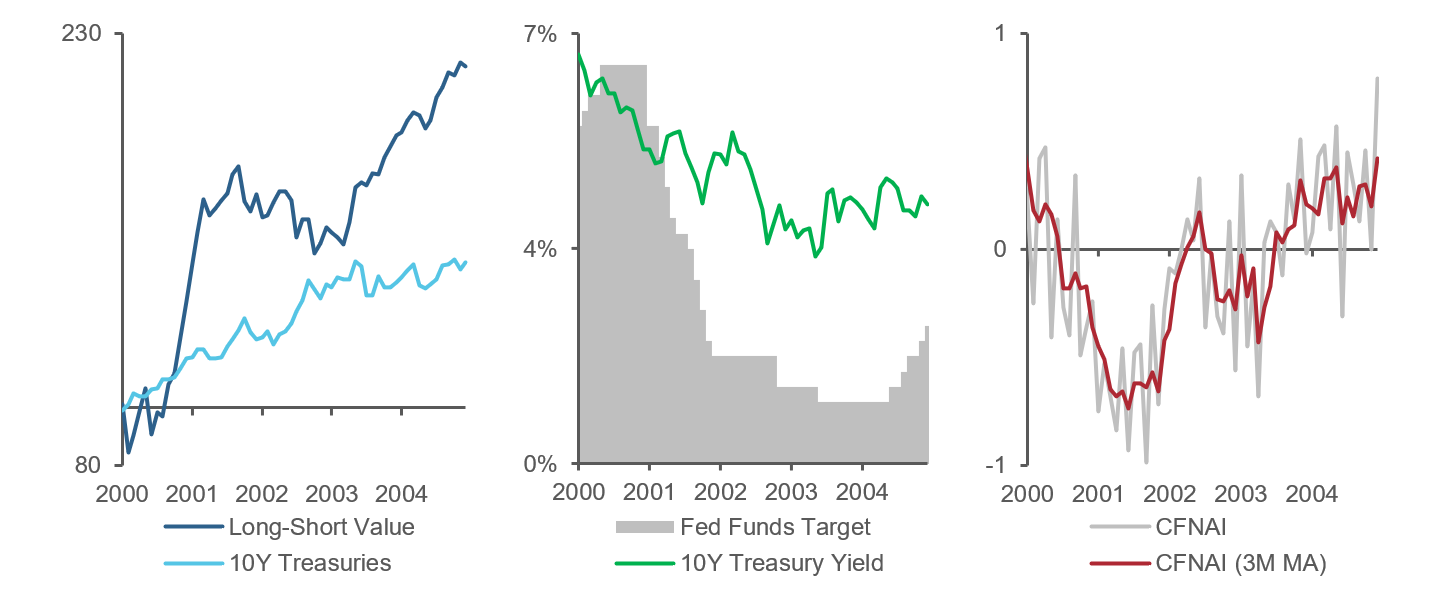
Value and bonds again exhibited positive correlation in the aftermath of the bubble’s collapse. By 2004, economic activity was above long-term trend, and the Fed started to raise policy rates in July. Value extended its rally as low P/B stocks generated decent earnings growth and continued to benefit from relative multiple expansion. Nevertheless, bonds rose because the fixed income market did not seem convinced of the recovery. Longer-term interest rates fell for much of 2004, with their slide attributed to concerns about the real impact of rising energy prices, falling overall inflation expectations, and labor market weakness.8
Conclusion
Because the relationship between interest rates and value depends on the confluence of many factors, investors should not expect that value-oriented investments will respond consistently to rate increases or decreases. In the present environment, if robust economic activity causes real interest rates to rise, then cyclically sensitive low P/B stocks might benefit. The same stocks might suffer, however, if rates rise due to inflationary expectations that also trigger fears of central bank tightening. By the same token, falling interest rates do not necessarily bode poorly for value, despite the post-GFC experience.
Investors should also not expect that different implementations of value will respond uniformly to rising or falling rates. Unrefined value portfolios often have substantial and time-varying exposure to risk factors that, while not intrinsic to harvesting fundamental mispricings that give rise to value-related premia, may greatly influence their apparent interest rate sensitivity. Moreover, standalone value implementations, including those (like HML) that serve as the basis for many popular narratives about value behavior, may exhibit very different sensitivity to interest rates than multifactor investing approaches that interact value with other types of signals, including information about quality and fundamental growth.
The complexity and context dependence of the relationship between value and rates does not preclude the possibility of improving value-oriented equity strategies by incorporating interest rates as an input into forecasting or as a risk control. Investors should not expect that timing value based on interest rates will be easy, however. Moreover, making use of information about interest rates at minimum calls for a disciplined investment process in which the incremental benefit can be precisely evaluated. Otherwise, desired effects will likely be swamped by unintended consequences.
Endnotes
- Specifically, Chen argues that cash flows of growth stocks have not, historically, grown consistently and materially faster than those of value stocks. He also finds that regressions of future dividend growth rates on B/M valuations are highly susceptible to survivorship bias, and that once the bias is taken into account, coefficients tend to be positive rather than negative. In addition to other biases in empirical modeling, Chen attributes misperceptions regarding growth duration to improper inferences from Gordon-based valuation models. See Huafeng (Jason) Chen, Do Cash Flows of Growth Stocks Really Grow Faster?, The Journal of Finance, Oct 2017, Volume 72, Issue 5, pp. 2279-2330.
- Analyses based on monthly changes in rates and related approaches lead to similar inferences.
- Over the three years through April 2021, volatility of 10-year Treasury excess returns was roughly 1.9% per month versus 2.3% over the full 1973-April 2021 sample period. As context, the monthly standard deviation of HML over the 36 months ending April 2021 was 4.0%. The R2 from the regression over that period is roughly 52%.
- For more detail about Acadian’s views on the source of the value premium and best practices for harvesting it, see Acadian’s Approach to Value Investing, November 2019.
- See Value’s Intricacies and the Margin of Safety, Acadian, August 2016.
- See Returns to Value: A Nuanced Picture, November 2019.
- See 30-year Treasury Bond Yield Falls below 6%, The New York Times, September 3rd, 1993, for discussion of then-contemporary economic conditions.
- See CNN/Money, Bond Market Isn’t Sold on Economy’s Strength, September 14, 2004.
Hypothetical Legal Disclaimer
Acadian is providing hypothetical performance information for your review as we believe you have access to resources to independently analyze this information and have the financial expertise to understand the risks and limitations of the presentation of hypothetical performance. Please immediately advise if that is not the case.
Hypothetical performance results have many inherent limitations, some of which are described below. No representation is being made that any account will or is likely to achieve profits or losses similar to those shown. In fact, there are frequently sharp differences between hypothetical performance results and the actual performance results subsequently achieved by any particular trading program.
One of the limitations of hypothetical performance results is that they are generally prepared with the benefit of hindsight. In addition, hypothetical trading does not involve financial risk, and no hypothetical trading record can completely account for the impact of financial risk in actual trading. For example, the ability to withstand losses or to adhere to a particular trading program in spite of trading losses are material points which can also adversely affect actual trading results. There are numerous other factors related to the markets in general or to the implementation of any specific trading program which cannot be fully accounted for in the preparation of hypothetical performance results and all of which can adversely affect actual trading results.
Legal Disclaimer
These materials provided herein may contain material, non-public information within the meaning of the United States Federal Securities Laws with respect to Acadian Asset Management LLC, Acadian Asset Management Inc. and/or their respective subsidiaries and affiliated entities. The recipient of these materials agrees that it will not use any confidential information that may be contained herein to execute or recommend transactions in securities. The recipient further acknowledges that it is aware that United States Federal and State securities laws prohibit any person or entity who has material, non-public information about a publicly-traded company from purchasing or selling securities of such company, or from communicating such information to any other person or entity under circumstances in which it is reasonably foreseeable that such person or entity is likely to sell or purchase such securities.
Acadian provides this material as a general overview of the firm, our processes and our investment capabilities. It has been provided for informational purposes only. It does not constitute or form part of any offer to issue or sell, or any solicitation of any offer to subscribe or to purchase, shares, units or other interests in investments that may be referred to herein and must not be construed as investment or financial product advice. Acadian has not considered any reader's financial situation, objective or needs in providing the relevant information.
The value of investments may fall as well as rise and you may not get back your original investment. Past performance is not necessarily a guide to future performance or returns. Acadian has taken all reasonable care to ensure that the information contained in this material is accurate at the time of its distribution, no representation or warranty, express or implied, is made as to the accuracy, reliability or completeness of such information.
This material contains privileged and confidential information and is intended only for the recipient/s. Any distribution, reproduction or other use of this presentation by recipients is strictly prohibited. If you are not the intended recipient and this presentation has been sent or passed on to you in error, please contact us immediately. Confidentiality and privilege are not lost by this presentation having been sent or passed on to you in error.
Acadian’s quantitative investment process is supported by extensive proprietary computer code. Acadian’s researchers, software developers, and IT teams follow a structured design, development, testing, change control, and review processes during the development of its systems and the implementation within our investment process. These controls and their effectiveness are subject to regular internal reviews, at least annual independent review by our SOC1 auditor. However, despite these extensive controls it is possible that errors may occur in coding and within the investment process, as is the case with any complex software or data-driven model, and no guarantee or warranty can be provided that any quantitative investment model is completely free of errors. Any such errors could have a negative impact on investment results. We have in place control systems and processes which are intended to identify in a timely manner any such errors which would have a material impact on the investment process.
Acadian Asset Management LLC has wholly owned affiliates located in London, Singapore, and Sydney. Pursuant to the terms of service level agreements with each affiliate, employees of Acadian Asset Management LLC may provide certain services on behalf of each affiliate and employees of each affiliate may provide certain administrative services, including marketing and client service, on behalf of Acadian Asset Management LLC.
Acadian Asset Management LLC is registered as an investment adviser with the U.S. Securities and Exchange Commission. Registration of an investment adviser does not imply any level of skill or training.
Acadian Asset Management (Singapore) Pte Ltd, (Registration Number: 199902125D) is licensed by the Monetary Authority of Singapore. It is also registered as an investment adviser with the U.S. Securities and Exchange Commission.
Acadian Asset Management (Australia) Limited (ABN 41 114 200 127) is the holder of Australian financial services license number 291872 ("AFSL"). It is also registered as an investment adviser with the U.S. Securities and Exchange Commission. Under the terms of its AFSL, Acadian Asset Management (Australia) Limited is limited to providing the financial services under its license to wholesale clients only. This marketing material is not to be provided to retail clients.
Acadian Asset Management (UK) Limited is authorized and regulated by the Financial Conduct Authority ('the FCA') and is a limited liability company incorporated in England and Wales with company number 05644066. Acadian Asset Management (UK) Limited will only make this material available to Professional Clients and Eligible Counterparties as defined by the FCA under the Markets in Financial Instruments Directive, or to Qualified Investors in Switzerland as defined in the Collective Investment Schemes Act, as applicable.