Leverage, an Essential Tool: Using the full set of portfolio characteristics to create investments
Thematic Research 17 min
September 2025
Table of contents
Recent months have seen a flurry of speculation about reclassifications across MSCI Frontier, Emerging, and Developed indices—the list includes China A-shares, Korea, Pakistan, Peru, Saudi Arabia, and Taiwan. Once a change is announced, index-driven investors need to plan their next move. We study a broad sample of past reclassifications to identify strategies to maximize alpha from the announcement date through the effective date.
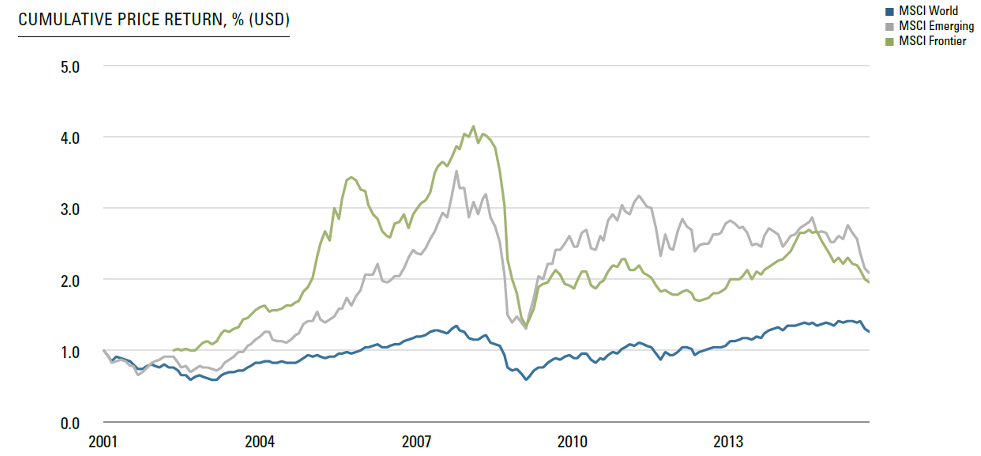
Morgan Stanley Capital International (MSCI) indices shape the investing strategies of trillions of dollars and thousands of funds, from proper index funds to active funds that use them as benchmarks. Among the most important are the MSCI equity indices for Developed Markets (DM), Emerging Markets (EM), and Frontier Markets (FM).1 These indices are valuable because they capture distinct investment opportunities offered by markets at different stages of development.
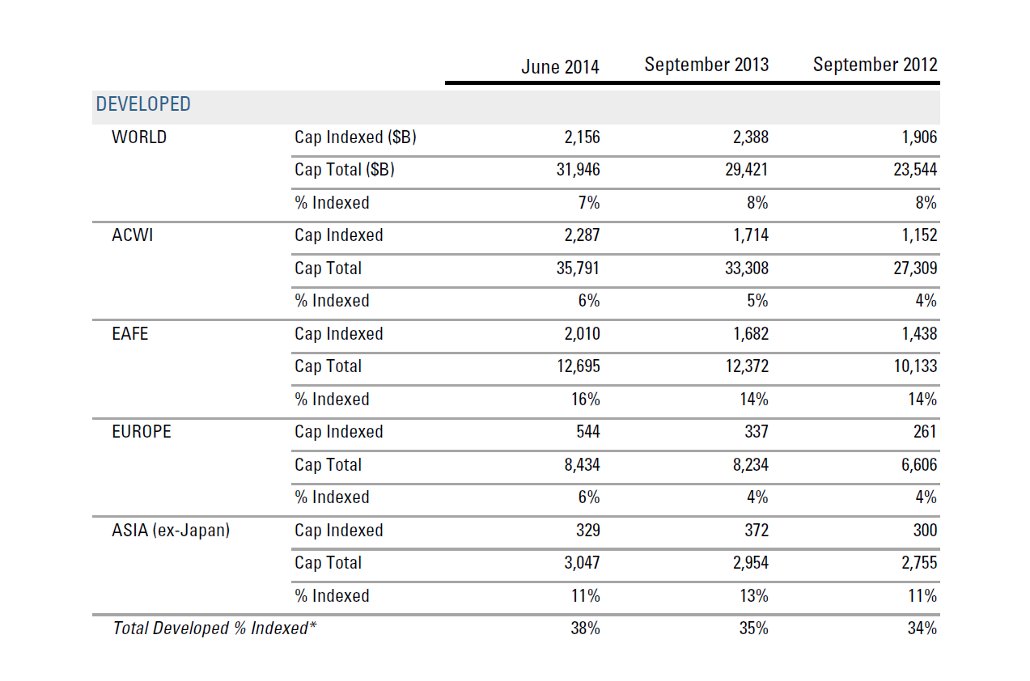
MSCI’s Index Policy Committee classifies countries based on dozens of criteria involving openness to foreign ownership, ease of capital flows, and the efficiency and stability of the market’s operational framework. Table 1 shows the extent to which these criteria are satisfied for each of the major market classifications.
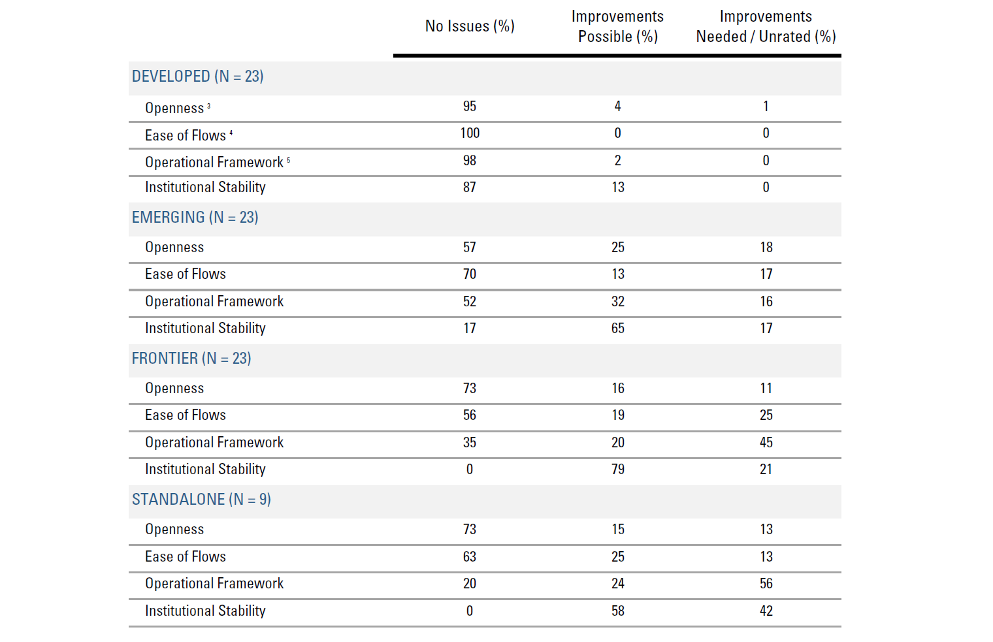
The inclusion criteria for developed markets are strict. They are satisfied by less than one-third of the countries for which MSCI constructs a standalone country index. The percentage of markets with major “improvements needed” increases steadily as we go from down the list from DM, EM, FM, to markets excluded from any major index.
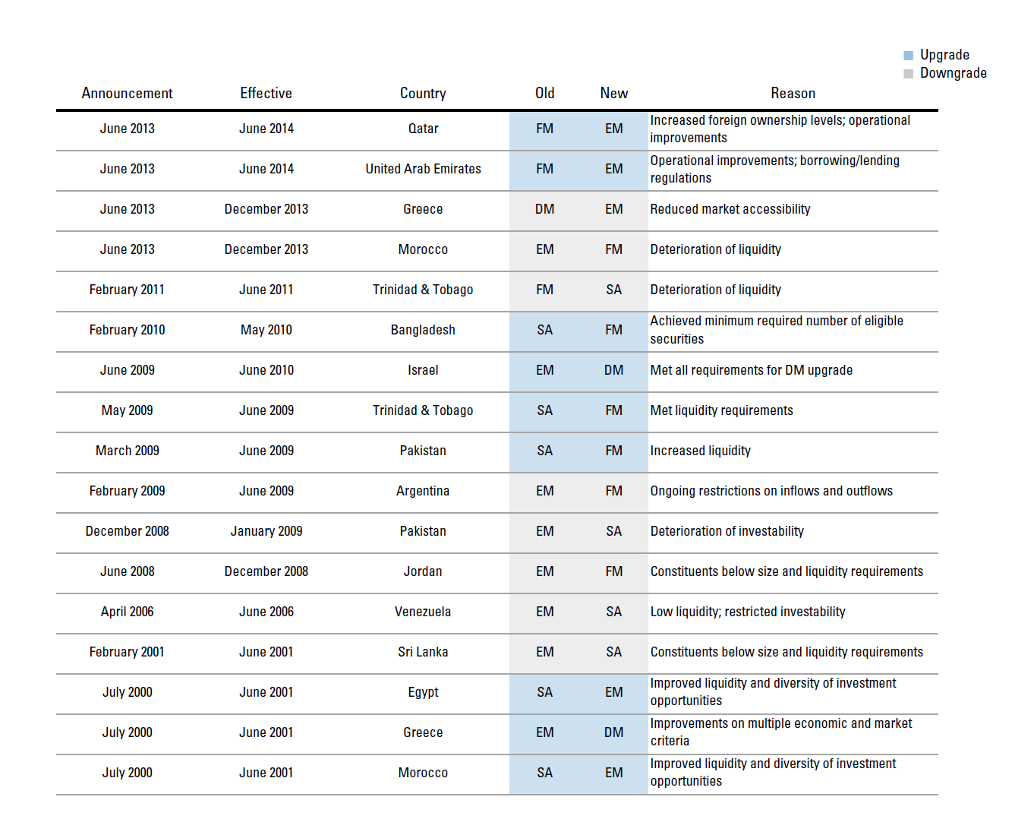
When conditions change, MSCI reclassifies markets. Qatar and the United Arab Emirates, for example, graduated from the FM index to the EM in June 2014 after various institutional improvements. But Trinidad and Tobago was declared ineligible even for the FM index in February 2011, and since June of that year has been tracked only as a standalone market.
MSCI reviews the composition of its indices every year. In special circumstances, the Committee may conduct an ad hoc review, e.g., when local regulators suddenly impose new investability restrictions. But the more typical process involves three dates. When a country’s market approaches the criteria for a reclassification, MSCI places it on a watch list and invites comment. After several months, MSCI announces a decision to reclassify the market or to remove it from the watch list. If the market is reclassified, MSCI specifies a date, again several months down the road, at which the reclassification becomes effective.
Actual country reclassifications are infrequent, with an average of just over one per year since 2000, but they sometimes come in bunches. The transition matrix in Figure 2 shows the effective dates of non-partial reclassification events announced since 2000. We also exclude Serbia’s and Lithuania’s reclassifications. Their announcements conditioned the final decision on aspects of market performance between the announcement and the potential effective date, whereas every announcement before or since has been an unambiguous declaration that a change will be made.
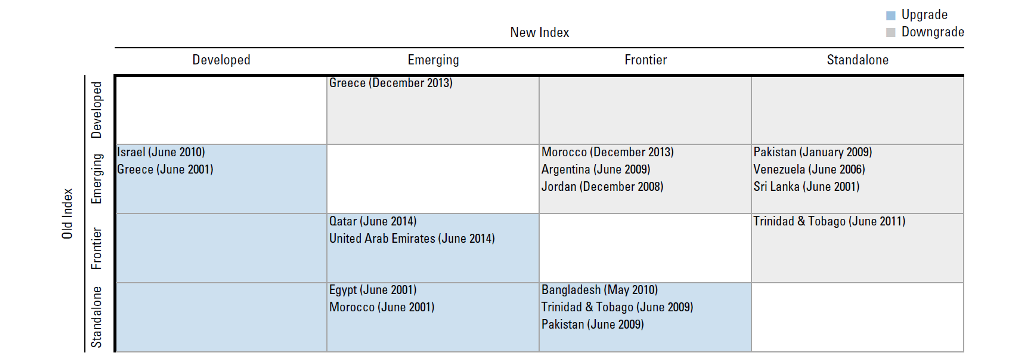
While casual observation suggests that the accessibility of international markets has generally increased over the past fifteen years, MSCI has up-graded nine markets but downgraded eight. One possibility is that MSCI is sliding the goalposts to keep a balance across classifications. On the other hand, many of these downgrades were deserved under any definition of accessibility. Furthermore, our intuition about market development can be shaped by the observable, ongoing improvements in markets already in the DM.
But for our purpose we take reclassifications as given. Table 2 gives more details about our sample of events.
Are country reclassifications disruptive for index-driven investors? Do the return profiles of the markets involved change?
Believers in efficient markets—including many passive indexers—would say no. Reclassifications are inconsequential because stock fundamentals are unchanged. Any change in return properties such as risk or liquidity are due to the structural changes that drove reclassifications in the first place, not the reclassifications themselves. Most importantly, there will be no pattern of abnormal returns after MSCI’s announcements. Index-driven funds should therefore trade at the effective date because tracking error is all that can be controlled.
An alternative view, associated with behavioral finance or inefficient markets, is that stock prices respond to supply and demand forces unrelated to fundamentals. They can point to the tendency for stocks to jump when they are added to the S&P 500, for example. Adherents to this view acknowledge the structural and operational changes leading to reclassification events. Nonetheless, they would suggest that the trading of passive index funds might contribute to the very distortions that their investors deny.6
In the case of MSCI reclassifications, thousands of index-driven funds must consider how much to adjust their holdings in a short period of time, and passive indexers will presumably do so fully. The collective action of these non-fundamental traders may be very large indeed.
To understand the magnitudes involved, consider the multiple layers of MSCI indices. There are many details, but a simplified explanation is as follows. Each index is roughly value-weighted (more precisely, free-float weighted and adjusted for foreign ownership limits). Country return indices are then averages of major stocks trading in the local market. Regional sub-indices are averages of a set of country indices. And the major indices, including DM, EM, and FM indices, are averages of combinations of the above.
The roughly value-weighted structure of the indices allows us to estimate the size of the potential flows associated with a reclassification. If index-tracking investors hold shares at index weights, then, at least mathematically, the net percentage flow is the difference between fraction of the new index held by index-tracking investors and the fraction of the old index held by index-tracking investors.
This is not necessarily intuitive. Doesn’t it matter how many dollars are indexed to, say, MSCI EM versus DM? Not directly, no.
Suppose a country has a small indexable cap of $10 billion. Currently it is in an index tracked by relatively few investors—the total cap of the countries in the index is $100 billion, and there is 50% indexer ownership. Due to the value-weighted structure of the index, index-driven investors currently hold $5 billion of the market.
Now suppose this country is upgraded to a more developed index with a total cap of $1 trillion, of which $400 billion is owned by index-driven investors. Now such investors hold only 40% of the country’s shares. In other words, there will be $1 billion of net selling pressure despite joining a far larger and more-followed index in dollar terms.7 Whether a country is upgraded or downgraded has no fundamental bearing on net demand.
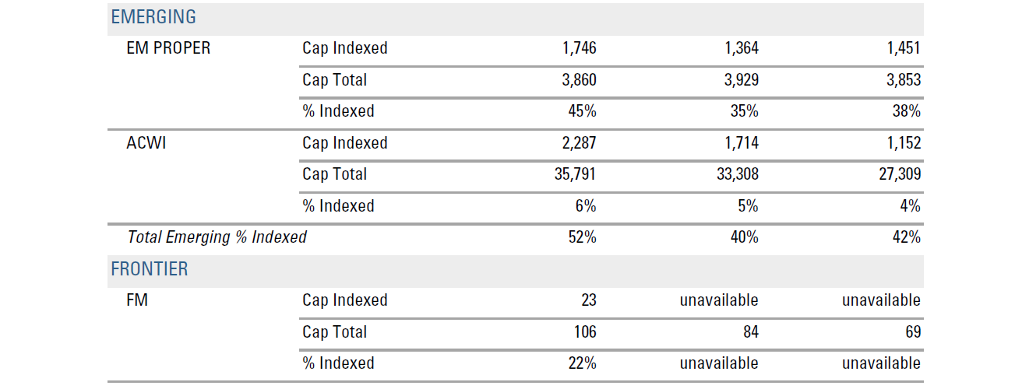
Table 3 shows some rough estimates of net percentage index ownership using data from MSCI and other sources.
Rough estimates suggest that around 22% of the Frontier markets are currently owned by index-tracking funds. A reclassification from Frontier to Emerging then puts the country into two major indices, standard EM as well as ACWI, which recent estimates suggest are 52% owned by index trackers. For companies within that country index, the net flow in recent years could be up to a massive 30% of the market’s cap.
A further promotion from emerging to developed, on the other hand, may actually cause a net decline in index-tracking ownership. The country’s ACWI status does not change, but—in the most recent data—it stands to lose up to 45% ownership from its EM index affiliation while gaining only about 31% from its new inclusion into MSCI World, EAFE, and Asia or Europe. This net decline of 14% may be contrary to intuition, given that so many more dollars are indexed to Developed than Emerging. But, as we have discussed, these are not directly relevant measures.

The estimates of changes in index-driven ownership are summarized in Table 4. Keep in mind that these are not figures about institutional ownership more broadly. If a fund holds a share in a frontier market because it seems undervalued, the fund needn’t trade simply because a third party decides that the market in which it trades has passed what is often, in terms of the continuum of market development, an arbitrary threshold. What we are concerned with here are monies invested by a true index-tracking mandate or strategy.
The coarse estimates in Table 4 come with further important caveats. Active benchmarkers as a group may overweight or underweight some countries relative to their actual index weights; reclassifications may be driven by changes in the investing environment that themselves affect active benchmarkers’ trading; upon an upgrade, companies to be included within the new index must satisfy stricter investability criteria, so some must be sold, not bought, by the new indexers even if the fraction of index-tracking ownership at the new classification is greater (and vice-versa for downgrades); fund families that track the old index in one vehicle and the new index in another may be able to transfer shares simply through internal accounting; some Frontier or Emerging managers may allow residual holdings in upgraded countries, for example, perhaps because those countries would likely represent a large fraction of their portfolio at the time of the switch, implying less short-term reshuffling than the differences in Table 4 imply.
In light of these limitations, it is best to regard the net flows in Table 4 as imprecise but directionally correct.
Ownership Versus Portfolio Weights
Despite the buying pressure, a country that dominates the Frontier index will be only a minor element of the EM index. Any tracking error and portfolio alpha consequences of a reclassification will typically be far greater for the followers of the lesser-developed index, given its smaller total cap. In an upgrade, what was a big fish in the old index becomes a small fish in the new index, and vice-versa.
One last note before getting to the returns data— reclassifications affect not just the countries in question. The freed up capital turns into buying pressure on the other constituents in the old index and selling pressure on the other constituents of the new index. We will not explore these effects here, but in some cases they could be significant.
Historical Patterns
The most important question, particularly for active benchmarkers, is whether and how reclassifications predict subsequent returns. A secondary question is whether any effect on returns is determined by flows or by a generic “upgrade versus downgrade.”
Aside from alerting investors to the possibility of change at an unspecified future date, watch list status has no actionable implication for benchmarked investors. The relevant dates are the announcement and effective dates of reclassifications. Hence, we look for patterns between these dates as well as over the year after the effective date.
Alphas Around Reclassifications
We measure alphas on the reclassified country’s index in two ways. For investors using the old benchmark, alpha is measured as the country index return over that benchmark. For investors in the new benchmark, the relevant comparison is with the new benchmark.
A limitation of our study is the use of country indices rather than the precise portfolios affected by a switch. The new and old indices will have somewhat different inclusion requirements, so the number of stocks leaving the old index may be greater or smaller than the number of stocks entering the next index. For example, in an upgrade, companies that were allowed into the old index may have to be excluded. For those stocks, the selling pressure from the old indexers is not offset by buying demand from the new indexers. We will miss some of this with country indices. At the same time, they are value-weighted, and many less developed markets are dominated by a handful of stocks.
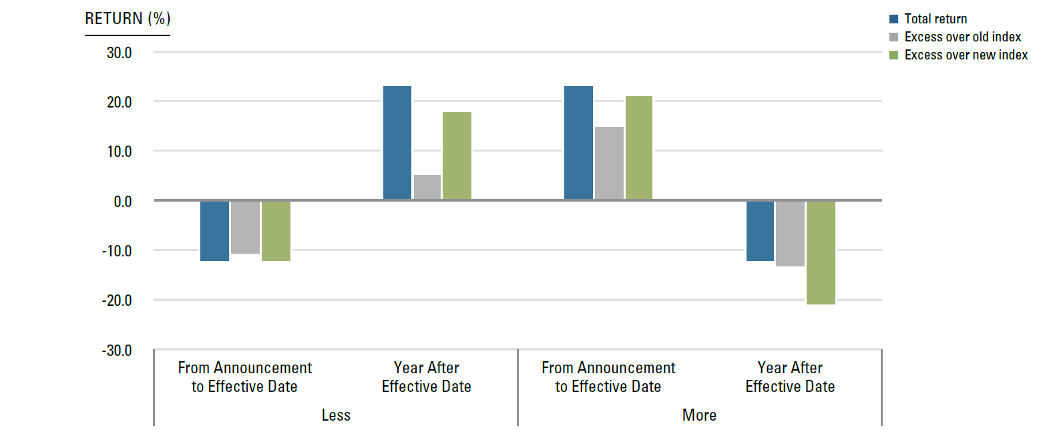
Figures 3 and 4 present the average returns on country indices around reclassifications. Figure 3 splits the sample between reclassifications that result in less benchmarked ownership (for example, from EM to any other index) and those that result in more benchmarked ownership (for example, from any other index to EM).
The results are surprisingly clear-cut. Between the announcement and effective date, the average alpha was around -10% for markets that lost benchmarked ownership but 15-20% for markets that increased benchmarked ownership. Those differences are large enough to be statistically significant despite the very small sample size.
Further evidence that net trading pressure is moving prices is that in the year after the reclassification becomes effective, the alphas reverse. Once the net selling pressure abates, valuations appear to bounce back for less-benchmarked markets; perhaps they are returning to fundamentals. Similarly, once the burst of net buying pressure abates, artificially high valuations return toward pre-announcement levels.
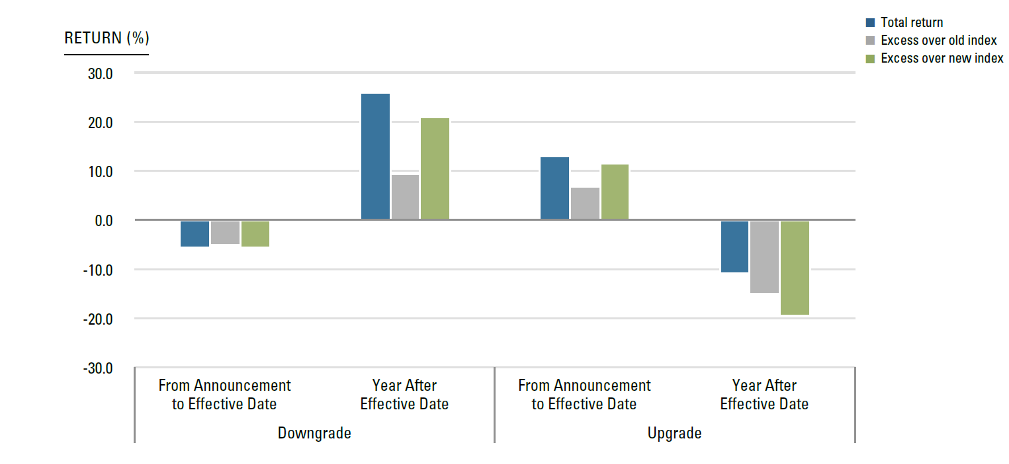
How do upgrades and downgrades compare? Buying pressure tends to be higher for upgrades, so perhaps it is the direction of the reclassification that really matters. An upgrade would seem to increase visibility and liquidity, after all, and such things might be reflected in positive returns.
Figure 4 splits the sample between upgrades and downgrades. The results are similar to the split across net trading pressure. But if upgrades were good for valuations, they should be permanently good. Instead, any pattern in alphas tended to revert. The “upgrades are good, downgrades are bad” interpretation is therefore not consistent with the historical evidence.
What happens right around the announcement and effective dates? If the action happens too fast then the strategic opportunities are limited. To investigate this we excluded short windows around the event dates. We find that the results are only slightly weakened. For example, the average raw return between two days after the announcement date and two days before the effective date is -9.23% for countries that are increasing index-driven ownership and 21.35% for countries that are decreasing it. The comparable numbers in Figure 3 are -12.48% and 23.17%. The post-effective reversion effects are similar.
Risk and Liquidity
We also examined risk and liquidity patterns around reclassifications. One might suspect the reclassified country index’s beta with respect to the new index to increase over time and the beta with respect to the old index to decrease. We did not find any significant changes, however. We also looked at the first-order autocorrelation of country indices as a proxy for liquidity, but we found no changes associated with upgrades or downgrades.
Investment Implications
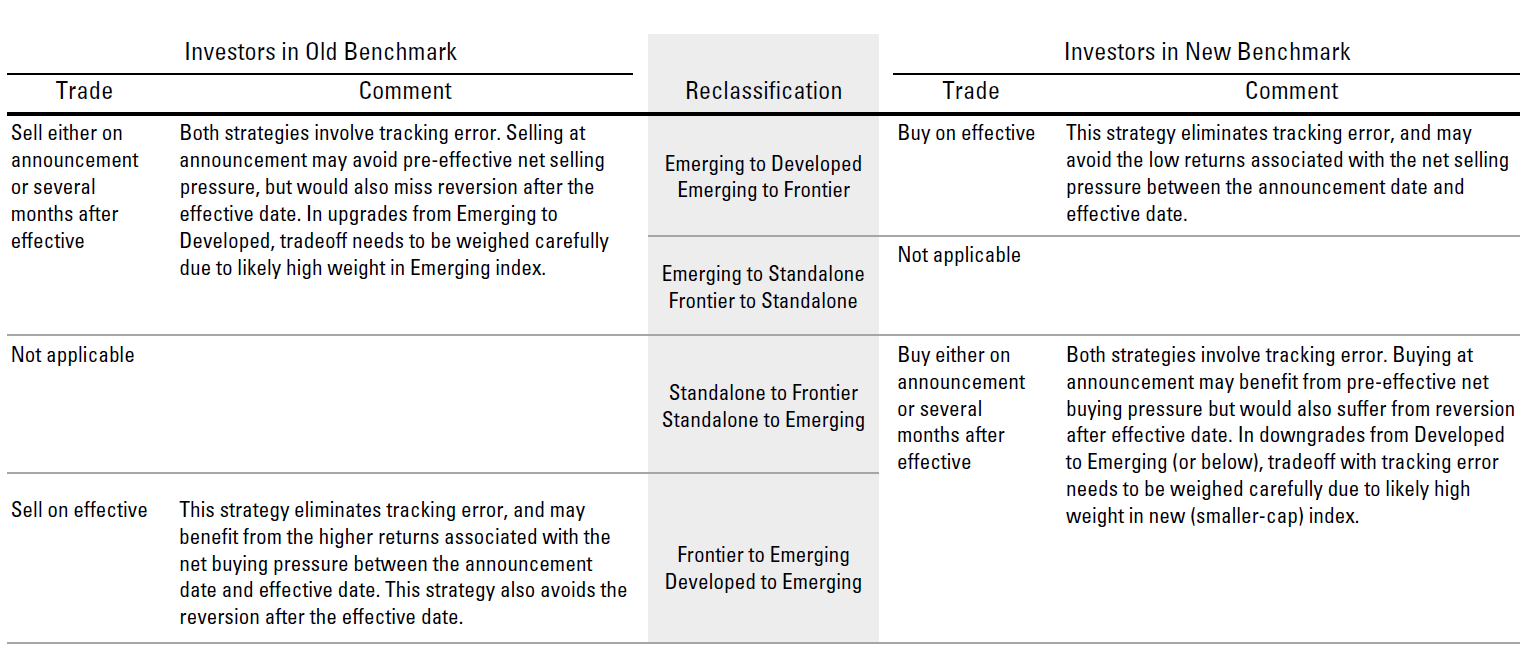
For passive indexers seeking to match their benchmark, none of these patterns matter. But there are rich implications for benchmarkers that have discretion. Table 5 summarizes the alpha-maximizing strategies implied by the evidence.
In some cases, the alpha-maximizing trade is unambiguous. When a market is downgraded from Emerging to Frontier, for example, those benchmarked to the Frontier index could avoid tracking error, and may avoid the low returns associated with the net selling pressure between the announcement date and effective dates, by buying on the effective date.
Conversely, for upgrades from Frontier to Emerging, those benchmarked to Frontier could ride the net buying pressure before the effective date and, again, avoid tracking error by selling on the effective date.
In other cases, the optimal strategy is less obvious, and alpha effects must be balanced against tracking error. Consider a reclassification from Frontier to Emerging from the perspective of Emerging benchmarkers. Buying at the effective date has the benefit of no tracking error. But it also means buying at the peak: the buying-pressure-driven return between announcement and effective has been missed, while any post-effective reversion has still to be endured.
Emerging benchmarkers have two strategies in seeking to avoid negative alpha. One is to buy at announcement and hold through both the run-up and the reversion. The other strategy is to buy well after the effective date, when the cycle will have played out. Both strategies, of course, require accepting some tracking error.
Conclusion
MSCI index country reclassifications are some of the most significant events that benchmarked investors face. Our analysis of past reclassifications suggests how an investor could approach them.
The historically optimal approach, as it turns out, is straightforward. Countries transitioning into a less-indexed classification face net selling pressure, and negative alpha, between the announcement and effective dates. After the move becomes effective and the selling pressure abates, there is a reversion with positive alpha. The opposite is true when countries move toward a more-indexed classification. In other words, from a strategic perspective, whether the change is an upgrade or a downgrade matters less than fundamental principles of supply and demand.
These materials provided herein may contain material, non-public information within the meaning of the United States Federal Securities Laws with respect to Acadian Asset Management LLC, Acadian Asset Management Inc. and/or their respective subsidiaries and affiliated entities. The recipient of these materials agrees that it will not use any confidential information that may be contained herein to execute or recommend transactions in securities. The recipient further acknowledges that it is aware that United States Federal and State securities laws prohibit any person or entity who has material, non-public information about a publicly-traded company from purchasing or selling securities of such company, or from communicating such information to any other person or entity under circumstances in which it is reasonably foreseeable that such person or entity is likely to sell or purchase such securities.
Acadian provides this material as a general overview of the firm, our processes and our investment capabilities. It has been provided for informational purposes only. It does not constitute or form part of any offer to issue or sell, or any solicitation of any offer to subscribe or to purchase, shares, units or other interests in investments that may be referred to herein and must not be construed as investment or financial product advice. Acadian has not considered any reader's financial situation, objective or needs in providing the relevant information.
The value of investments may fall as well as rise and you may not get back your original investment. Past performance is not necessarily a guide to future performance or returns. Acadian has taken all reasonable care to ensure that the information contained in this material is accurate at the time of its distribution, no representation or warranty, express or implied, is made as to the accuracy, reliability or completeness of such information.
This material contains privileged and confidential information and is intended only for the recipient/s. Any distribution, reproduction or other use of this presentation by recipients is strictly prohibited. If you are not the intended recipient and this presentation has been sent or passed on to you in error, please contact us immediately. Confidentiality and privilege are not lost by this presentation having been sent or passed on to you in error.
Acadian’s quantitative investment process is supported by extensive proprietary computer code. Acadian’s researchers, software developers, and IT teams follow a structured design, development, testing, change control, and review processes during the development of its systems and the implementation within our investment process. These controls and their effectiveness are subject to regular internal reviews, at least annual independent review by our SOC1 auditor. However, despite these extensive controls it is possible that errors may occur in coding and within the investment process, as is the case with any complex software or data-driven model, and no guarantee or warranty can be provided that any quantitative investment model is completely free of errors. Any such errors could have a negative impact on investment results. We have in place control systems and processes which are intended to identify in a timely manner any such errors which would have a material impact on the investment process.
Acadian Asset Management LLC has wholly owned affiliates located in London, Singapore, and Sydney. Pursuant to the terms of service level agreements with each affiliate, employees of Acadian Asset Management LLC may provide certain services on behalf of each affiliate and employees of each affiliate may provide certain administrative services, including marketing and client service, on behalf of Acadian Asset Management LLC.
Acadian Asset Management LLC is registered as an investment adviser with the U.S. Securities and Exchange Commission. Registration of an investment adviser does not imply any level of skill or training.
Acadian Asset Management (Singapore) Pte Ltd, (Registration Number: 199902125D) is licensed by the Monetary Authority of Singapore. It is also registered as an investment adviser with the U.S. Securities and Exchange Commission.
Acadian Asset Management (Australia) Limited (ABN 41 114 200 127) is the holder of Australian financial services license number 291872 ("AFSL"). It is also registered as an investment adviser with the U.S. Securities and Exchange Commission. Under the terms of its AFSL, Acadian Asset Management (Australia) Limited is limited to providing the financial services under its license to wholesale clients only. This marketing material is not to be provided to retail clients.
Acadian Asset Management (UK) Limited is authorized and regulated by the Financial Conduct Authority ('the FCA') and is a limited liability company incorporated in England and Wales with company number 05644066. Acadian Asset Management (UK) Limited will only make this material available to Professional Clients and Eligible Counterparties as defined by the FCA under the Markets in Financial Instruments Directive, or to Qualified Investors in Switzerland as defined in the Collective Investment Schemes Act, as applicable.