
Misplaced Anxiety? A Reassessment of Crowding in Systematic Investing
Key Takeaways
- Renewed concern about “quant crowding” is overstated: Today’s environment differs materially from 2007— factor performance has been muted, quantitative and leveraged investing have matured, and systematic investors generally have been positioned opposite retail-fueled speculation in growth stocks.
- Current indicators show little evidence of harmful crowding: Valuation spreads, short interest patterns, and performance dispersion remain broadly unremarkable, suggesting no widespread distortion of the opportunity set or convergence in positioning among systematic managers.
- Some crowding exposure is inevitable—and, contrary to conventional wisdom, it can be healthy if managed: Overlap in positioning reflects shared investment intuition and does not preclude strong long-term performance; focus should be on strong risk management and sophisticated implementation rather than on eliminating crowding exposure entirely.
Table of contents
Although the “quant crisis” of August 2007 occurred a generation ago, it still casts a long shadow over the landscape of active management. Swings in systematic managers’ performance routinely prompt questions about links to “crowding.” The issue has recently resurfaced as systematic managers have enjoyed renewed popularity.1
In this paper, we take a clear-eyed look at crowding in systematic equity. We begin by defining “quant crowding.” Next, we catalogue key differences between today’s systematic investing environment and conditions that prevailed prior to the 2007 crisis. We then examine several potential crowding indicators and conclude that they do not raise alarm. Finally, we argue that—contrary to conventional wisdom—some exposure to crowding risk is consistent with a healthy systematic process that delivers strong long-term performance. The key is managing that exposure.
Quant crowding defined
Many discussions of quant crowding risk are imprecise. One reason is that the term “quant crowding” is often left undefined. We would describe the condition as:
Aggregate positioning within a universe of similar strategies that has grown so large relative to available liquidity—possibly as a result of leverage— that there is risk of widespread contagion and severe performance impact if a triggering event forces some of the portfolios to unwind.2
Ambiguity around the term “quant” is equally problematic. The media often conflates very different investing approaches under the “quant” label, including fundamentally driven stock selection, high frequency trading, and trend following. This misplaced focus on the label can be a harmful distraction.
In evaluating crowding risk associated with any particular systematic investing process, it may be more relevant whether its positioning aligns with discretionary strategies that share a common intuition than with quantitative strategies built on different views of alpha drivers, investment universes, portfolio construction, and implementation methods.
In understanding what quant crowding is, it is also important to distinguish it from what it is not—namely, common exposure to risk factors. Some drawdowns in systematic strategies have been caused by retail-driven speculation. Recent episodes include pressure on value strategies during the so-called “quant winter” that began in 2018, when the driver of a growth-led rally shifted from improved fundamentals to multiple expansion, and the meme-stock era of early 2021. While systematic investors shared common thematic exposures—and pain—on the opposite sides of these trades, that does not qualify the episodes as instances of “quant crowding.”
2026 versus 2007: A Study in Contrasts
The 2007 quant crisis refers to an episode of contagious unwinds that caused acute, mostly short-lived pain for systematic equity strategies in early August of that year.3 While collective memory of the event has grown hazy, Khandani and Lo (2011) provide a seminal analysis. It highlights three salient features of the crisis:
- The origins were likely exogenous to quant equity. The leading theory is that tremors in the mortgage market, which roiled hedge funds during the first half of the year, forced one such firm to delever broadly across several strategies, including its long-short quant equity book.
- Leverage likely played a key role. As the first unwinds rippled through the market, other levered systematic funds reduced exposure as prices moved against them, forecast risk increased, and uncertainty rose, setting off a chain reaction.
- A rapid withdrawal of liquidity amplified the impact. At the height of the crisis, it exacerbated losses in systematic portfolios and destabilized the broader market.
If similarity to the pre-2007 quant crisis environment were used to assess systematic crowding risk, current conditions would not raise alarm. In early 2007, systematic strategies were enjoying spectacular performance, driving rapid AUM growth and pushing what had been a boutique investing approach into the mainstream. Subdued market volatility also created intense competitive pressure on hedge funds, including quant equity managers, to lever up in a permissive regulatory environment. These conditions, which laid the groundwork for the crisis, differ markedly today.
2007: Prelude to Crisis
The crisis in quant equity followed several years of extraordinary performance by systematic managers. Figure 1 illustrates this through strong market-excess returns from three generic factors that typified quant implementations at the time—the long sides of developed-market Fama-French value, momentum, and profitability portfolios.4
Figure 1: Generic factor market-excess returns – Pre-2007 versus recent years
Long side of developed market Fama-French factors minus the market
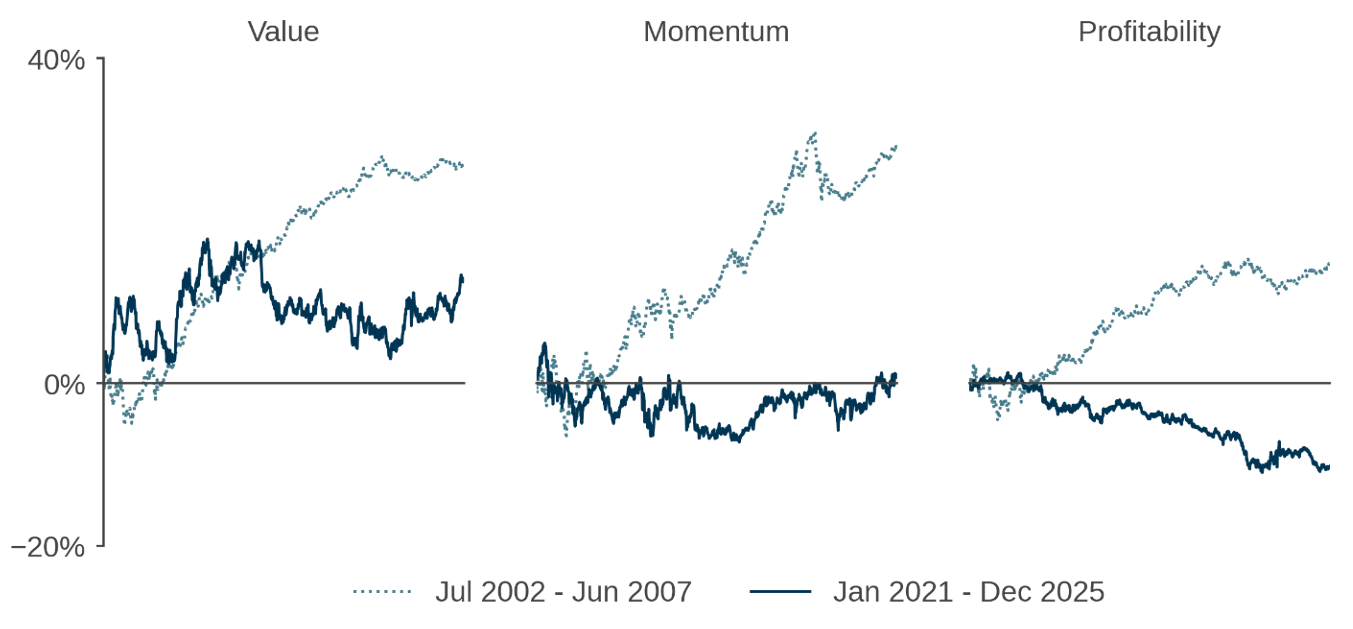
Two statistics underscore how exceptional the period was: 1) for seven consecutive years through 2006 in the aftermath of the dot-com bubble, the return on the long-short Fama-French B/P-based value factor exceeded 7.5%, and 2) in 2006, the U.S. value factor recorded a rolling three-year Sharpe ratio of nearly 2.5, still its highest level over the past century.
Naturally, this remarkable performance attracted a surge of assets into quant-oriented investments. As a measure of institutional interest, the left panel of Figure 2 shows material flows during 2005 and 2006 into systematic strategies in eVestment’s database. In U.S. index-linked mutual funds and ETFs—presumably indicative of retail investor behavior—Figure 2 shows significant flows into value strategies and out of growth, along with a shift towards value in the balance of AUM.
Figure 2: Flows and AUM – systematic strategies

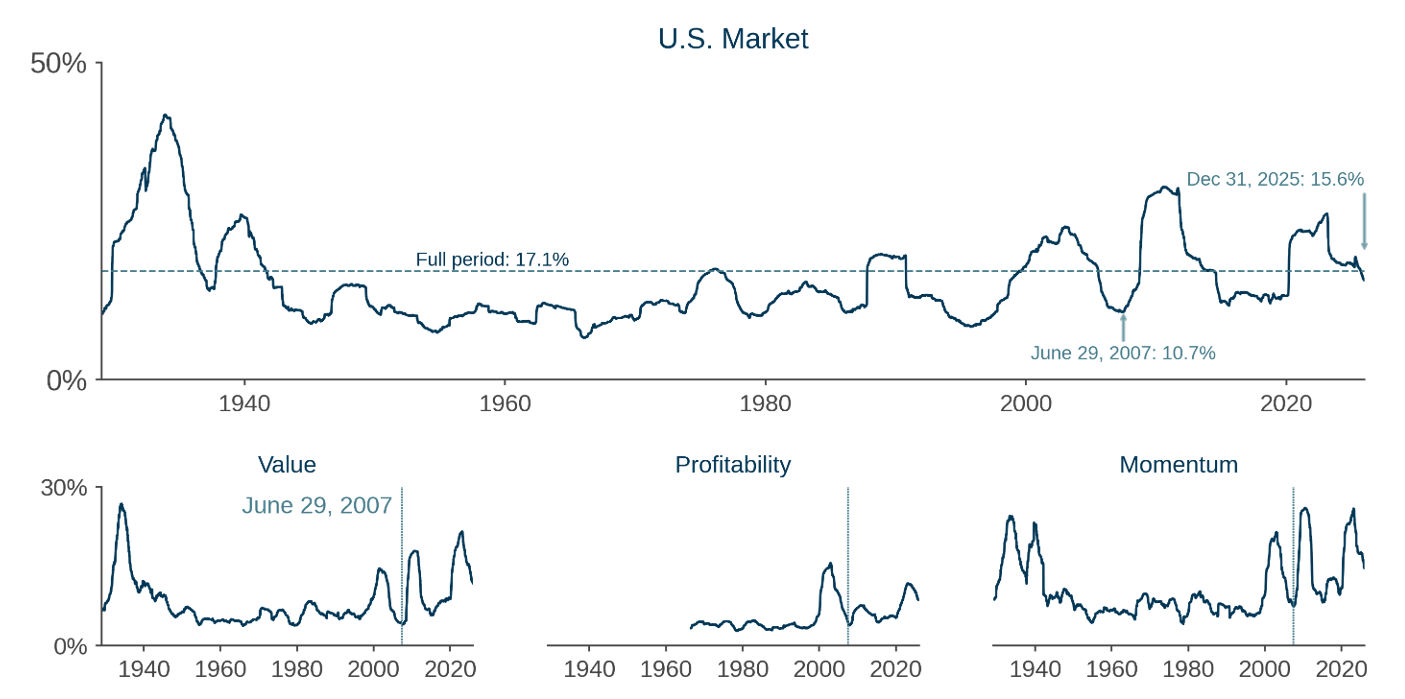
A second salient characteristic of the pre-quant-crisis environment was market calm. Figure 3 documents that on the eve of the crisis, realized U.S. stock volatility had fallen to 10.7% over the prior three years, far below levels seen during the Asian Financial Crisis, the ruble/LTCM collapse, and the dot-com era, when volatility reached its highest levels since the Great Depression and World War II. Specific to systematic equity, the lower panels in Figure 3 show that volatilities of generic factors reflected the broader trend.
Figure 3: A contrast in risk environments – pre-quant-crisis versus the 2020s
3Y rolling realized volatilities
This comparative tranquility had a pernicious effect beyond simply dulling sensitivity to risk. In an intensely competitive environment for assets and talent, it gradually incentivized the leveraging of all kinds of investing activities that had a “short-volatility” profile—those predicated on quiet markets and/or rational pricing—to meet ambitious absolute-return targets and swell bonus pools.5
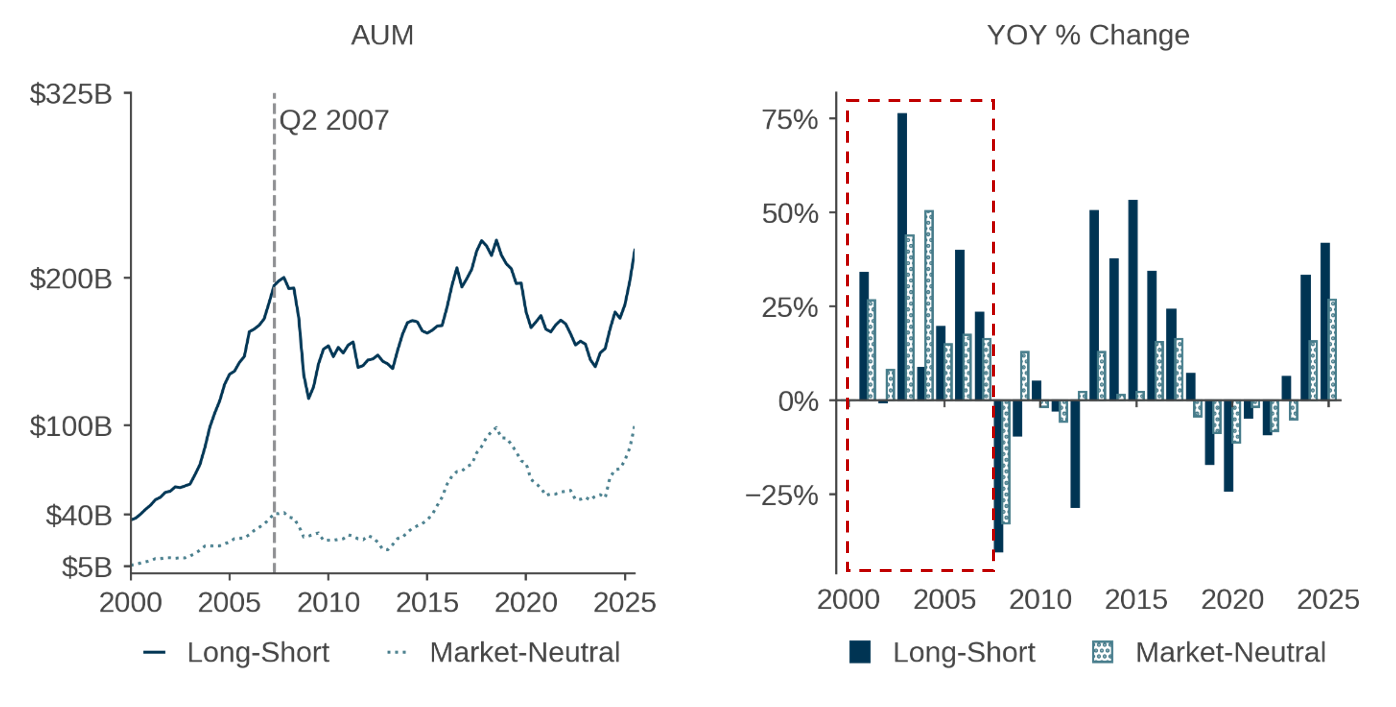
At the same time, hedge funds were growing rapidly, for the first time becoming a mainstream allocation for many institutional asset owners. Total hedge fund industry AUM more than tripled from 2003 to mid-2007. In 2005 alone, there were more than 2,000 launches. As documented in Figure 4, equity long-short funds, specifically, enjoyed strong AUM growth.6 On the sell side, a concentrated community of prime brokers came under intense competitive pressure to support hedge fund expansion, at a time when overall bank and broker-dealer leverage was rising rapidly. These dynamics set the stage for disruptive unwinds in the event of a shock to the opaque and largely unregulated hedge fund ecosystem.
Figure 4: Equity hedge fund AUM
Today
Conditions today differ markedly across all three dimensions discussed above. Systematic investing is now well established, hardly the ingénue it seemed in the early 2000s. Moreover, commoditized factor implementations have not recently delivered performance comparable to that earlier era. Returning to Figure 1, during the 2020s the Fama-French value, momentum, and profitability factors have had difficulty outperforming the market (dark traces).
This hardly seems like the basis for a crowding dynamic in which strong performance attracts waves of flows, stretching existing managers’ capacity and drawing in new entrants—and additional data suggests that it has not. In the institutional space, the left panel of Figure 2 shows no established trend of net inflows into systematic strategies, and the middle panel shows no evidence of retail investors rushing into value-oriented funds. In fact, growth’s share of style AUM has trended back up to post-dot-com levels, as those funds have outperformed.7
Moreover, while multifactor systematic strategies maintain exposure to growth, they have generally taken the opposite side of the market’s most conspicuous trade in recent years—speculation in high-beta growth stocks.8 U.S. equity valuations have risen toward frothy late-2021 levels, and other symptoms of speculative excess have emerged, even if a bubble has not yet fully formed.9 These conditions have at times posed headwinds for many systematic strategies, particularly through their exposure to value.
Turning to risk conditions, the environment also differs meaningfully from 2007. As Figure 3 highlights, market volatility has been close to its long-term average, and generic value, momentum, and quality factor volatilities have been elevated. Macro, policy, and geopolitical uncertainty have also been historically high.10 These conditions are hardly conducive to the complacency and competitive pressures that prevailed during the calm mid-2000s.
In addition, the world of levered investing has changed considerably. Undoubtedly, there are reasons to remain watchful of deleveraging risk. Hedge fund leverage reached historic highs in 2025, and it has been reactive to bouts of market volatility.11 Hedge fund growth has been concentrated among the largest firms, including multi strategy “pod shops,” many of which operate under quantitatively based risk-management frameworks that might take down leverage or deallocate from relatively liquid portfolios if risk rises sharply.12
Yet in many respects, maturation of the hedge fund industry over the past twenty years appears to have reduced the likelihood of a cascade of forced unwinds during market stress. While total hedge fund AUM reached new highs in 2025, growth has slowed and the number of funds has been stable.13 In the long-short equity space, the left panel of Figure 4 shows that while total AUM in long-short and market-neutral styles is historically high, it has only rebounded towards late-2010s levels after a few years of decline, even without adjustments for total equity market cap. The right panel further shows that AUM growth rates in these styles have not been historically unusual.
In addition, the financial crisis triggered significant changes in the hedge fund business environment. Funds have installed more stringent liquidity terms, including longer lockups,14 while regulatory oversight also increased significantly. In the U.S., the Dodd-Frank Act of 2010 brought hedge funds under SEC supervision and imposed registration and reporting requirements. The Federal Reserve has used this data to track hedge fund leverage and exposures since 2012.15 On the financing side, both bank and broker-dealer leverage are well below pre-GFC levels.16 And while hedge funds still depend on a small number of prime brokers, multi-prime relationships are more common than in 2007, reducing risk that an idiosyncratic problem at one sell-side firm could propagate to large buy-side institutions.17
In summary, unlike the environment that preceded the quant crisis, recent conditions have not been conducive to the rapid growth and undisciplined leveraging of commoditized systematic strategies—key ingredients of crowding risk.
Crowding indicators: A current assessment
As a practical matter, crowding is difficult to detect in real time. In systematic equity investing, the risk of false positives is high and costly. Many metrics based on trends in prices and flows, though seemingly relevant for detecting crowding, are often more profitably applied in identifying trends that may persist than in timing reversals.
With these limitations in mind, we consider three categories of potential crowding indicators, none of which currently show cause for alarm.
Distortions in the Opportunity Set
The first set of indicators are valuation and factor spreads. Value spreads are proprietary metrics of prices, expressed in valuation terms, of obtaining exposure to stock characteristics targeted by our models. The intuition is that unusually wide spreads may reflect sufficient buying and selling pressure aligned with these signals to materially distort prices.
This approach has the advantage of capturing a direct symptom of crowding, in contrast to holdings-based analyses, which measure overlap in positioning but not its price impact and also depend on defining and assembling data for the relevant universe of strategies.
At present, value spreads for most major signal groups look benign. Tellingly, spreads in the growth category, including signals that are associated with unexpectedly strong and rising expectations of earnings, look relatively unattractive, especially in emerging markets.
Factor spreads measure the breadth of the systematic opportunity set, proxied for by the dispersion in stock characteristics embedded in our stock-selection signals. Currently, the opportunity set looks normal, with no evidence of compression that would indicate systematic investors are picking over a depleted set of mispricings.
Overall, patterns in value and factor spreads do not point to elevated crowding risk among multifactor systematic strategies. If anything, they suggest vulnerability among discretionary strategies concentrated in growth themes without regard to valuation.
Shorting and Systematic Signals
Levered long-short systematic strategies were central to the 2007 crisis and would seem a natural transmission mechanism for contagion if a similar episode were to reoccur. If the positioning of such funds were stretching liquidity and creating vulnerability to a cascade of systematic unwinds originating from short-positions, we might expect to see historically elevated levels of stock borrow utilization among equities disfavored by generic quant signals.
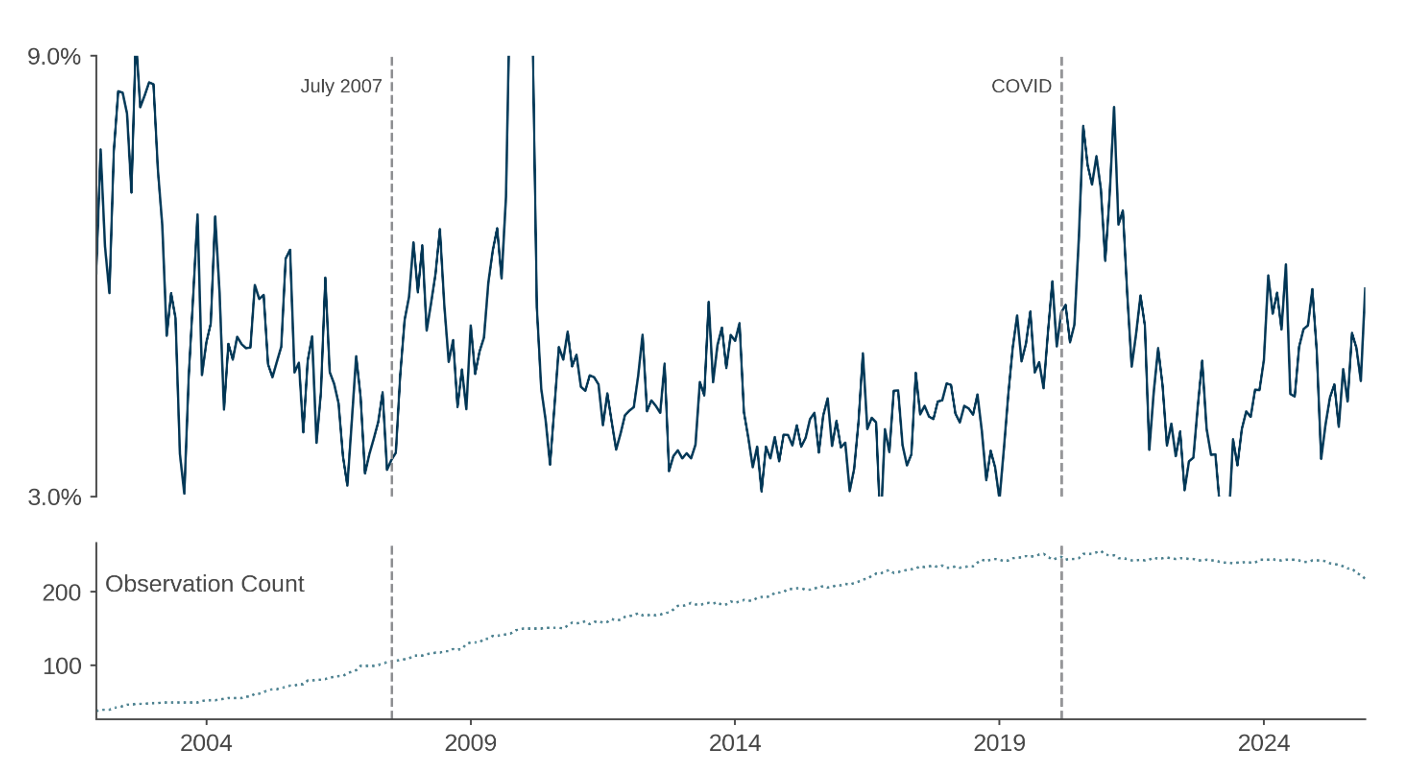
But we do not observe this today. Figure 5 shows average short utilization—short interest divided by borrowable shares—for investable U.S. stocks sorted into deciles by a composite generic systematic signal, formed by equally weighting scores of seven valuation, technical, and quality-related factors in a risk model. Even among the stocks most strongly disfavored by this signal (dark-blue trace), average utilization is no higher than it has been for much of the post-GFC era.
Figure 5: Short utilization by composite generic signal deciles
U.S. stocks with market cap > $50M; arithmetic averages within deciles; 6M moving averages
Based on data from Jan 2007 – Dec 2025
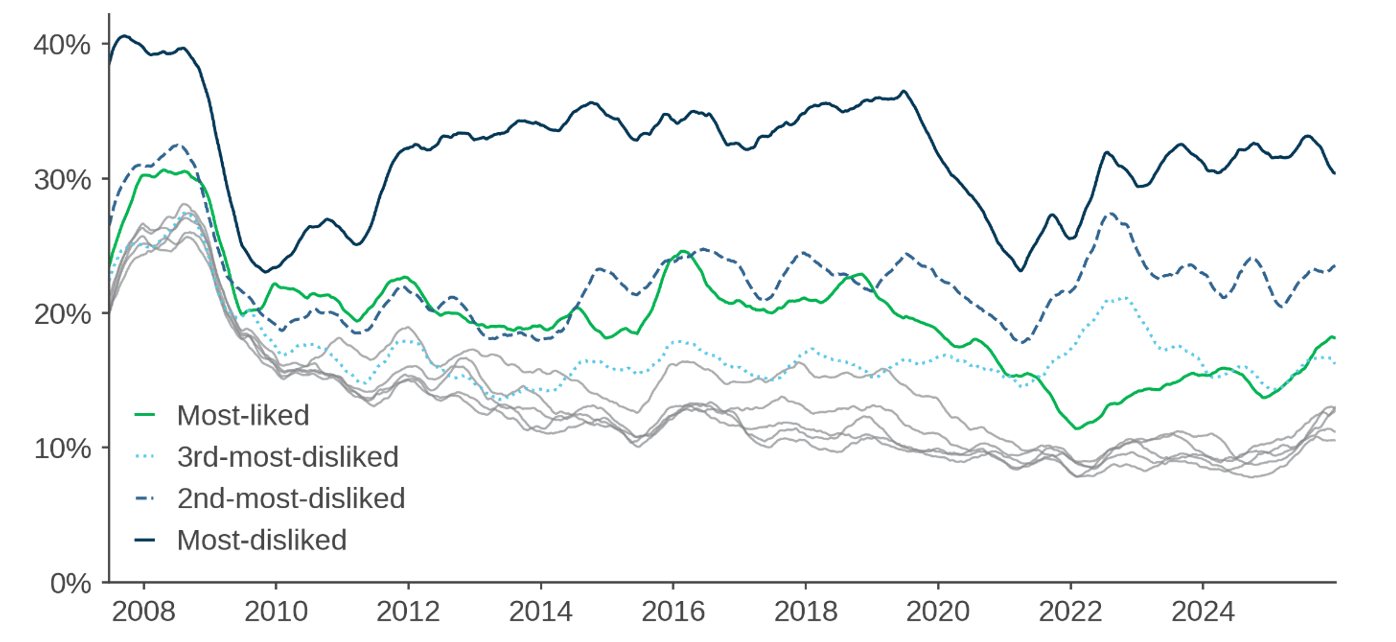
Moreover, a closer look at the data shows that short selling activity is elevated among stocks with high P/E ratios and weak profitability. In other words, there is material shorting activity in expensive, low-quality stocks.
Performance and Process Heterogeneity
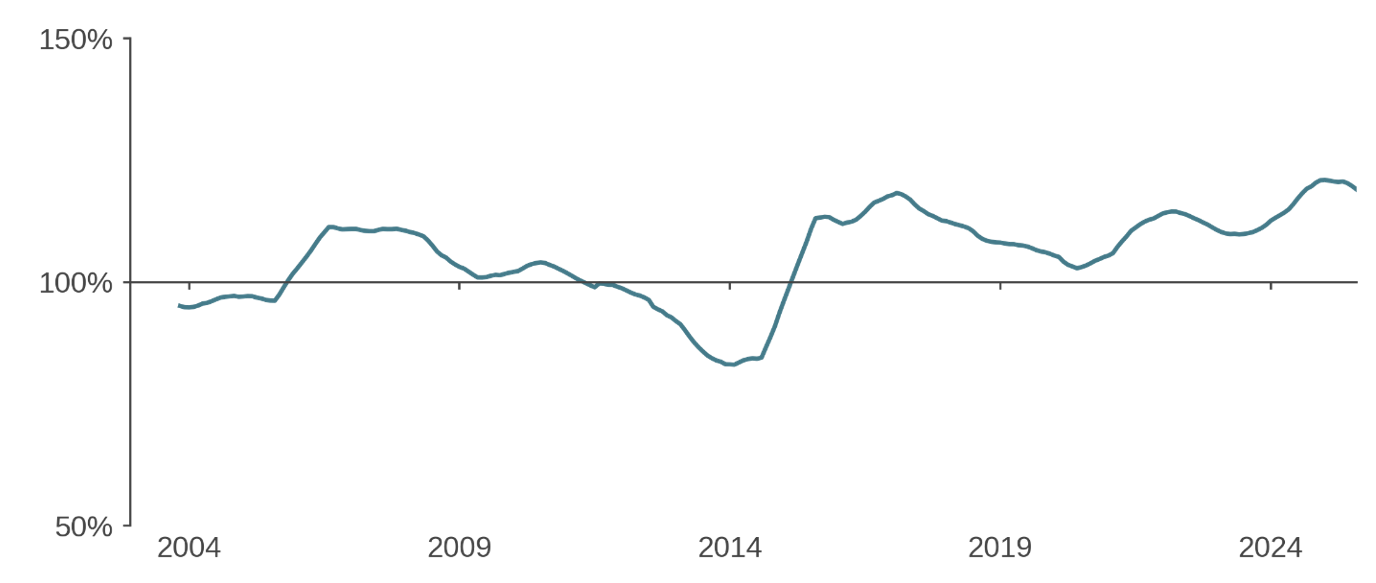
If there were crowding in the systematic space, we might expect to see convergence in strategy performance, reflecting similar positioning across managers. Figure 6 shows no evidence of such a trend. Within eVestment’s long-only global all/large-cap universe, dispersion in active performance has recently been consistent with its historical range.
Figure 6: Performance dispersion – eVestment large/all-cap global long-only systematic strategies
Interquartile range of rolling 12M active returns through 2025
At the process level, model-specific metrics can shed light on susceptibility to contagion. One is whether the proprietary signals that drive the final forecast maintain their heterogeneity over time. Figure 7 illustrates such an analysis for proprietary signals in Acadian’s bottom-up model, using a statistical technique called principal component analysis (PCA) to estimate the effective number of distinct (orthogonal) drivers they reflect. The stability of this measure over time—without a downward trend or pronounced variation—suggests that the effective dimensionality of proprietary information embedded in the model has been stable, with no indication of a recent narrowing.
Figure 7: Effective Dimensionality of Proprietary Stock-Selection Signals over Time
Normalized to 100 at year-end 2012
Managing crowding exposure: clear eyed perspective
Naturally, asset owners want to hear that their active managers’ processes are differentiated from others. In the context of crowding, this is sometimes extrapolated into a hope that a manager’s approach can be so distinct as to have no meaningful overlap with others, fully insulating it from contagious unwinds. But that expectation is generally unrealistic and perhaps unwise.
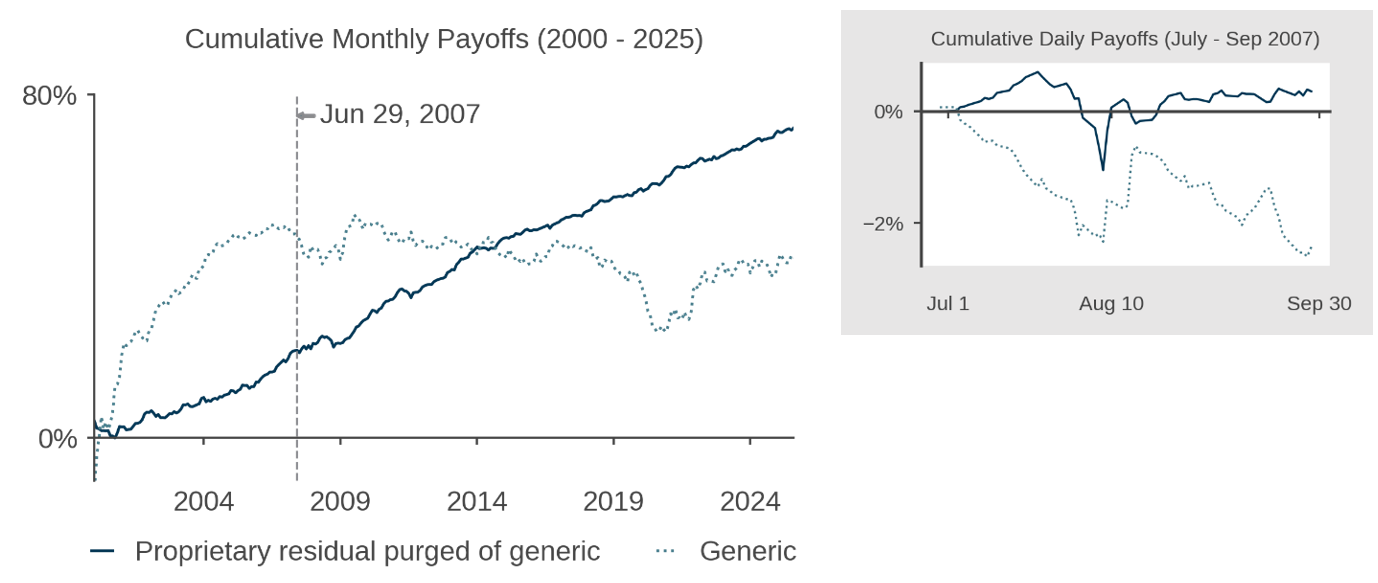
Figure 8 illustrates why in the context of a proprietary value signal. The blue trace in the main chart shows cumulative one-month returns to the proprietary component of the signal, which we isolate by purging contributions from a generic value factor (as well as market beta and size).18 Over the long term, this proprietary component exhibits strong and stable performance, and, thus appears to be an enduringly valuable component of a broader stock-forecasting model. Yet the inset chart shows that even the proprietary component would not have been fully insulated from the 2007 quant crisis. During the heart of the deleveraging, on August 8—9, it also experiences a material drawdown.
Figure 8: Cumulative payoffs to hypothetical valuation signals
There are two salient takeaways from this analysis. First, it is probably unrealistic to fully neutralize a medium frequency, fundamentally driven equity-forecasting model from crowding risk. This echoes our findings from a 2018 case study where we demonstrated the challenge of completely purging a proprietary momentum signal of its overlap with generics—and, by extension, signals used by many other managers.19 As we summarized then:
Deeply rooted, shared investment intuition may still manifest ex-post, despite thoughtful attempts to excise it ex-ante. Differences in relevant fundamental, behavioral exposures may be highly non-linear and time-varying, and it may be difficult to correctly model the relationships between those exposures in order to cut the simple one out.
More broadly, the result is a reminder that there are inherent limits to the aspect of proprietary signal development most often emphasized in crowding discussions—namely, the creation of “orthogonal” signals, often interpreted as identifying mispricings that other investors cannot detect. After all, the set of mispriced stocks is finite, and proprietary signal development does not create new mispricings. As a result, some overlap among active investors is inevitable, and so is some degree of crowding risk.
A second takeaway is that some exposure to crowding is probably not a bad thing and, in fact, may be indicative of a healthy and sophisticated systematic investing process. This is illustrated by the robust long-term efficacy of the proprietary residual despite its brief drawdown during the quant crisis. A closer look at that episode reinforces the point: while the proprietary residual declines during the most acute phase of deleveraging (August 6-9), its drawdown is brief. In contrast, the generic signal weakens throughout July and resumes its selloff in mid-August after only a partial recovery from the crisis. This is symptomatic of contamination in the generic signal from a bias towards financials—a dynamic that we have documented in prior research on the value premium.20 In 2007, financials started to slide early in the year and were subsequently caught up in the tremors in the commercial mortgage-backed securities market that likely triggered the first quant unwinds. The proprietary residual’s shorter drawdown is consistent with both a high signal-to-noise ratio and some overlap with investors that were forced to delever.
This comparison highlights the nuanced relationship between signal denoising and crowding risk. While denoising is crucial to long-term performance, it does not necessarily reduce crowding risk and may even increase it. To understand why, consider a thought experiment in which one sophisticated systematic investor knows the true alpha associated with every security. There is also a community of imprecise systematic investors who trade on noisy (but unbiased) estimates of that alpha. In such a setting, the sophisticated investor’s positions may be highly correlated with the aggregate positioning of the less precise group. In other words, improving signal precision can simultaneously increase expected alpha, and also increase overlap with the broader systematic community’s aggregate positioning—and thus crowding risk.
One implication is that asset owners should be cautious about using crowding exposure as a litmus test in manager evaluation. A more relevant question is whether a manager’s risk management framework can withstand—and potentially capitalize on—periods of deleveraging while preserving long-term performance. The ideal approach may involve exposure to signals that entail some crowding risk, including generics where they remain effective. Such an approach would involve not only guardrails on active positioning and risk factor exposures but also a well-thought-out implementation framework that can navigate episodes of stressed liquidity.
A second implication is that expanding the investment universe may be every bit as valuable in reducing crowding risk as developing orthogonal signals. What matters is the ability to exploit opportunities that other investors cannot pursue, regardless of the reason why. This underscores the importance of sophisticated implementation and the integration of rich transaction-cost modeling into forecasting to allow the exploitation of market segments or even asset classes that are too illiquid for many managers.
Conclusion
Recent attention from investors and the financial media has revived questions about the risk of “quant crowding.” Based on a clear definition of the concept and available evidence, we view these concerns as largely misplaced. By several measures, today’s environment bears little resemblance to that which preceded the 2007 quant crisis, and potential indicators of crowding do not raise alarm. Taken together, the data suggest that systematic managers are aligning with other fundamentally informed investors, including discretionary managers, in taking the opposite side of speculation in AI and other growth oriented thematic trades.21
More broadly, we believe that discussions of quant crowding often miss the mark—focusing too much on whether exposure can be eliminated through proprietary signal development and not enough on whether it is effectively addressed through disciplined portfolio construction, risk management, and implementation, and the prudent use of leverage.
Overall, systematic equity investing remains well positioned in today’s market environment.
References
Baker, Malcolm. December 2024. “Investor Sentiment for Value and Growth.” Acadian.
Baker, Malcolm, Mark Birmingham, and Seth Weingram, March 2021. “Managed Volatility in the Pandemic: The One-Year Anniversary.” Acadian.
Baker, Scott, Nicholas Bloom, and Steven J. Davis. 2016. “Measuring Economic Policy Uncertainty.” www.PolicyUncetainty.com.
Barclays Capital Solutions. February 2024. Meeting the Mark: 2024 Global Hedge Fund Industry Outlook.
Bell, Collin, Elizabeth Burton, Jack Springate, and Funmi Awofisayo. March 7, 2025. “Mapping the Evolution: Hedge Funds in a New Market Regime.” Goldman Sachs Asset Management.Caldara, Dario, and Matteo Iacoviello. November 2021. “Measuring Geopolitical Risk.” Board of Governors of the Federal Reserve Board.
Dahlquist, Magnus, Simon Rottke, Valeri Sokolovski, and Erik Sverdrup. January 15, 2024. “Hedge Funds and Prime Broker Risk.”
Daniel, Kent, “Anatomy of a Crisis,” CFA Institute Proceedings Quarterly (September 2009) 11-21.
Federal Reserve Board. November 2025. Financial Stability Report.
Kaal, Wulf and Dale Oesterle. February 29, 2016. “The History of Hedge Fund Regulation in the United States,” Columbia Blue Sky Blog.
Khandani, Amir E. and Andrew W. Lo, “What happened to the quants in August 2007? evidence from factors and transactions data.” Journal of Financial Markets 14, no. 1 (2011) 1-46.
Lamont, Owen A. March 2026. “Owenomics: Waiting for the IPO Wave.” Acadian.
Lamont, Owen A. February 2026. “Owenomics: Super Bowl Ads as a Bubble Warning.” Acadian.
Lamont, Owen A. November – December 2025. “Owenomics: Bubble Watch Parts 1-5.” Acadian.
Lamont, Owen A. November 2025. “Owenomics: Brokers and Bubbles.” Acadian.
Lamont, Owen A. October 2025. “Owenomics: Dumb Money Triumphant.” Acadian.
Lamont, Owen A. March 2025. “Owenomics: We’re Still Dancing: How Bubbles Grow.” Acadian.
Lamont, Owen A. October 2025. “Owenomics: Dumb Money Triumphant.” Acadian.
McGuane, Joe. March 26, 2025. “Five Major Trends Driving Hedge Funds in 2025.” The Callan Institute.
Pedersen, Lasse H., “When Everyone Runs for the Exit,” International Journal of Central Banking 5, no. 4 (2009) 177-199.
Thirukkonda, Ram and Seth Weingram. November 2022. “Growth Versus Value: End of an Era?”. Acadian.
Voitenok, Alex and Seth Weingram. February 2018. “Factor Investing: Is Keeping it Simple Shortsighted?” Acadian.
Endnotes
- The attention has even reached the mainstream financial media. E.g., Robin Wigglesworth, Inside the ‘rolling thunder’ quant crisis of 2025, Financial Times, Dec 11, 2025, and Justina Lee, Quants in Worst Losses Since October as Crowded Bets Buckle, Bloomberg, Jan 21, 2026.
- This intuitive definition incorporates the notion that investor incentives to run for the exit depend on whether “selling pressure is large relative to the available capital on the sideline,” as described in Pedersen (2009).
- Kent Daniel (2009) discusses how deterioration in the corporate credit market, including commercial mortgage-backed securities in late July 2007, set the stage for turmoil among quantitative equity strategies in early August.
- Each represents an equal-weighted average of the large- and small-cap high factor value portfolios found in datasets at the Ken French data library.
- The author experienced these pressures firsthand on a sell-side equity derivatives desk.
- The eve of the crisis also saw the launch of a swath of 130/30-extension strategies aiming to share benefits of long-short approaches with traditional long-only investors. Extension strategies have enjoyed renewed interest of late, and that happenstance is one factor that has raised questions about crowding.
- For discussion of value and growth fund flows as a measure of sentiment and retail investors’ propensity to mistime value and growth, see Malcolm Baker’s paper, Investor Sentiment for Value and Growth, Acadian, December 2024.
- This speculation has sometimes even been described as a crowded trade. For example, in November J.P. Morgan wrote, “The latest episode of crowding was partly a result of investors missing the initial V-shaped recovery in April and then chasing upside through Spec-Growth in the US and Cyclical Beta abroad. The chase to catch benchmarks drove High Beta crowding at the fastest pace on record …” “U.S. Style Positioning: Equity Leadership – Extreme Factor Divergence and Potential for Sharp Rotation,” (J.P. Morgan, November 13, 2025).
- Owen Lamont has written extensively about whether the U.S. stock market is in a bubble. As examples, see Waiting for the IPO Wave, (Owenomics, March 2026), Super Bowl Ads as a bubble Warning, (Owenomics, February 2026), Bubble Watch Parts 1 – 5 (Owenomics, November – December 2025), Brokers and Bubbles, (Owenomics, November 2025) and We’re Still Dancing: How Bubbles Grow, (Owenomics, March 2025). For discussion of post-COVID conditions, see Malcolm Baker, Mark Birmingham, and Seth Weingram, “Managed Volatility in the Pandemic: The One-Year Anniversary,” (Acadian, March 2021).
- For example, as of October 2025, the U.S. Economic Policy Index and the Geopolitical Risk Index were in the 98th and 92nd percentiles of their historical distributions (from 1900 and 1985, respectively). Sources: ‘Measuring Economic Policy Uncertainty’ by Scott Baker, Nicholas Bloom and Steven J. Davis at www.PolicyUncertainty. com and Caldara, Dario, and Matteo Iacoviello, “Measuring Geopolitical Risk,” (Board of Governors of the Federal Reserve Board, November 2021).
- See “Financial Stability Report—Leverage in the Financial Sector,” (Board of Governors of the Federal Reserve System, November 2025).
- E.g., see “Meeting the Mark: 2024 Global Hedge Fund Industry Outlook,” (Barclays Capital Solutions, February 2024) and Bell, Collin et al., “Mapping the Evolution: Hedge Funds in a New Market Regime,” (Goldman Sachs Asset Management, March 7 2025).
- E.g., see Joe McGuane, “Five Major Trends Driving Hedge Funds in 2025,” (The Callan Institute, March 26, 2025).
- For example, see data on investor liquidity by horizon tracked by the Treasury Department’s Office of Financial Research.
- Kaal and Oesterle (2016).
- Financial Stability Report, previously cited.
- Dahlquist et al. (2024).
- We do this by cross-sectionally regressing the overall signal’s values against those stock exposures to a generic value factor from a risk model.
- Alex Voitenok and Seth Weingram, “Factor Investing: Is Keeping it Simple Shortsighted?,” (Acadian, February 2018).
- See, for example, Ram Thirukkonda and Seth Weingram, Growth Versus Value: End of an Era?, (Acadian, November 2022).
- Owen Lamont has made a strong case in his blog that the environment has resembled the runup to the internet bubble. See, for example, Dumb Money Triumphant, (Owenomics, October 2025).
Legal Disclaimer
These materials provided herein may contain material, non-public information within the meaning of the United States Federal Securities Laws with respect to Acadian Asset Management LLC, Acadian Asset Management Inc. and/or their respective subsidiaries and affiliated entities. The recipient of these materials agrees that it will not use any confidential information that may be contained herein to execute or recommend transactions in securities. The recipient further acknowledges that it is aware that United States Federal and State securities laws prohibit any person or entity who has material, non-public information about a publicly-traded company from purchasing or selling securities of such company, or from communicating such information to any other person or entity under circumstances in which it is reasonably foreseeable that such person or entity is likely to sell or purchase such securities.
Acadian provides this material as a general overview of the firm, our processes and our investment capabilities. It has been provided for informational purposes only. It does not constitute or form part of any offer to issue or sell, or any solicitation of any offer to subscribe or to purchase, shares, units or other interests in investments that may be referred to herein and must not be construed as investment or financial product advice. Acadian has not considered any reader's financial situation, objective or needs in providing the relevant information.
The value of investments may fall as well as rise and you may not get back your original investment. Past performance is not necessarily a guide to future performance or returns. Acadian has taken all reasonable care to ensure that the information contained in this material is accurate at the time of its distribution, no representation or warranty, express or implied, is made as to the accuracy, reliability or completeness of such information.
This material contains privileged and confidential information and is intended only for the recipient/s. Any distribution, reproduction or other use of this presentation by recipients is strictly prohibited. If you are not the intended recipient and this presentation has been sent or passed on to you in error, please contact us immediately. Confidentiality and privilege are not lost by this presentation having been sent or passed on to you in error.
Acadian’s quantitative investment process is supported by extensive proprietary computer code. Acadian’s researchers, software developers, and IT teams follow a structured design, development, testing, change control, and review processes during the development of its systems and the implementation within our investment process. These controls and their effectiveness are subject to regular internal reviews, at least annual independent review by our SOC1 auditor. However, despite these extensive controls it is possible that errors may occur in coding and within the investment process, as is the case with any complex software or data-driven model, and no guarantee or warranty can be provided that any quantitative investment model is completely free of errors. Any such errors could have a negative impact on investment results. We have in place control systems and processes which are intended to identify in a timely manner any such errors which would have a material impact on the investment process.
Acadian Asset Management LLC has wholly owned affiliates located in London, Singapore, and Sydney. Pursuant to the terms of service level agreements with each affiliate, employees of Acadian Asset Management LLC may provide certain services on behalf of each affiliate and employees of each affiliate may provide certain administrative services, including marketing and client service, on behalf of Acadian Asset Management LLC.
Acadian Asset Management LLC is registered as an investment adviser with the U.S. Securities and Exchange Commission. Registration of an investment adviser does not imply any level of skill or training.
Acadian Asset Management (Singapore) Pte Ltd, (Registration Number: 199902125D) is licensed by the Monetary Authority of Singapore. It is also registered as an investment adviser with the U.S. Securities and Exchange Commission.
Acadian Asset Management (Australia) Limited (ABN 41 114 200 127) is the holder of Australian financial services license number 291872 ("AFSL"). It is also registered as an investment adviser with the U.S. Securities and Exchange Commission. Under the terms of its AFSL, Acadian Asset Management (Australia) Limited is limited to providing the financial services under its license to wholesale clients only. This marketing material is not to be provided to retail clients.
Acadian Asset Management (UK) Limited is authorized and regulated by the Financial Conduct Authority ('the FCA') and is a limited liability company incorporated in England and Wales with company number 05644066. Acadian Asset Management (UK) Limited will only make this material available to Professional Clients and Eligible Counterparties as defined by the FCA under the Markets in Financial Instruments Directive, or to Qualified Investors in Switzerland as defined in the Collective Investment Schemes Act, as applicable.
Additional Disclosures
eVestment Alliance, LLC and its affiliated entities (collectively, “eVestment”) collect information directly from investment management firms and other sources believed to be reliable, however, eVestment does not guarantee or warrant the accuracy, timeliness, or completeness of the information provided and is not responsible for any errors or omissions. Performance results may be provided with additional disclosures available on eVestment’s systems and other important considerations such as fees that may be applicable. Not for general distribution and limited distribution may only be made pursuant to client’s agreement terms. All managers in an eVestment category are not necessarily included. Copyright 2012-2026 eVestment. Alliance, LLC.
Hypothetical
Acadian is providing hypothetical performance information for your review as we believe you have access to resources to independently analyze this information and have the financial expertise to understand the risks and limitations of the presentation of hypothetical performance. Please immediately advise if that is not the case.
Hypothetical performance results have many inherent limitations, some of which are described below. No representation is being made that any account will or is likely to achieve profits or losses similar to those shown. In fact, there are frequently sharp differences between hypothetical performance results and the actual performance results subsequently achieved by any particular trading program.
One of the limitations of hypothetical performance results is that they are generally prepared with the benefit of hindsight. In addition, hypothetical trading does not involve financial risk, and no hypothetical trading record can completely account for the impact of financial risk in actual trading. For example, the ability to withstand losses or to adhere to a particular trading program in spite of trading losses are material points which can also adversely affect actual trading results. There are numerous other factors related to the markets in general or to the implementation of any specific trading program which cannot be fully accounted for in the preparation of hypothetical performance results and all of which can adversely affect actual trading results.