
Investing with Big Data
Table of contents
It seems hard to open an investment publication these days without finding an article about how “big data” is set to revolutionize the investment world. Is this the reality, or is it hype? In this note, we provide structure to the big data discussion, focusing on what types of big data might most benefit different investing styles. We highlight underappreciated challenges in the application of big data as well as assess the big data attributes that offer the greatest investment promise. This background should help asset owners who are assessing strategies and approaches that purport to benefit from big data.
Bringing Structure To Big Data
Big data has generated excitement in the investing world because of its potential to vastly expand the information set relative to the types and sources of data used in traditional investing approaches, both qualitative and quantitative. But the excitement also derives from the mystery—or perhaps better put, ambiguity—associated with big data. While the term “big data” has become a ubiquitous buzzword, it doesn’t have an agreed-upon definition. The concept is often vibrantly conveyed via examples, such as search engine traffic, social media feeds, satellite photos, or credit card transactions.
To better understand big data and evaluate its applicability, we can classify it in terms of two key attributes, breadth and speed. Breadth refers to the range of securities for which a particular type of data is both relevant and available. Speed refers to how quickly the data both updates and changes.
What are the salient distinctions between categories, and what types of big data are most relevant to different investment styles? (See Table 1)
Table 1: Types of big data and investment styles that might derive value from them
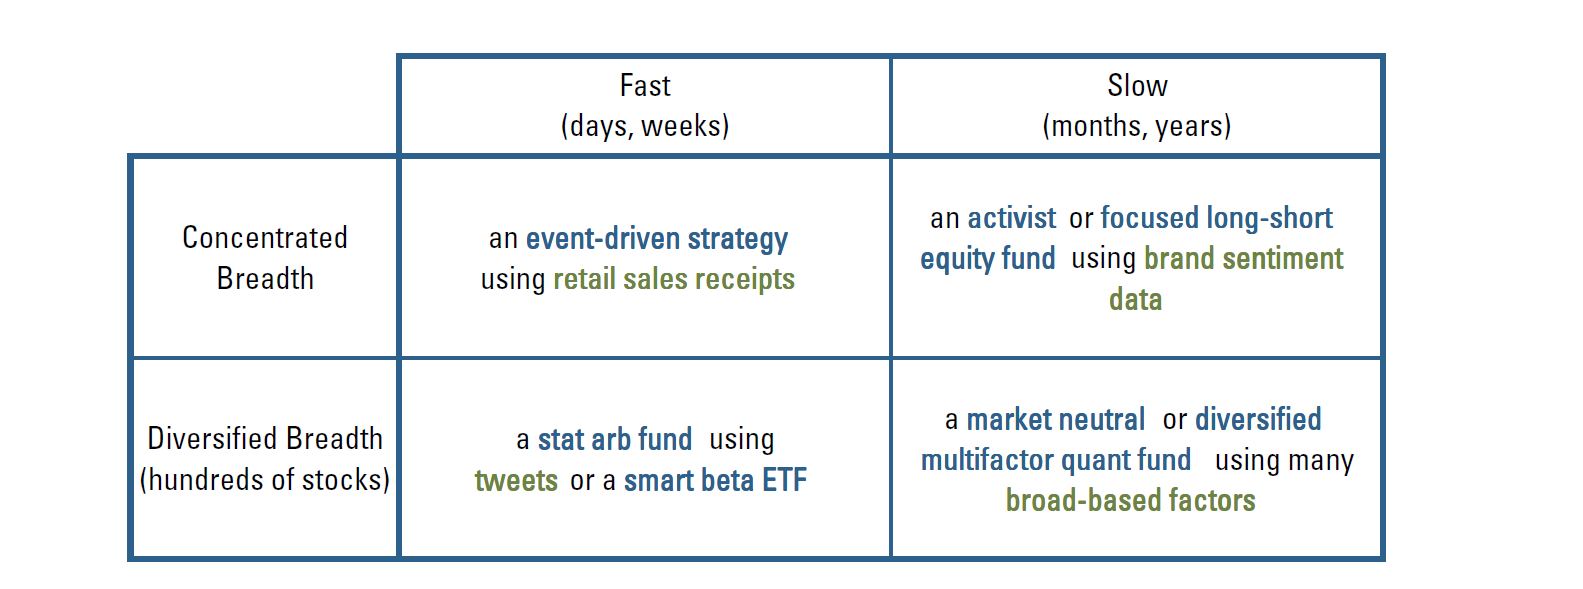
This breakdown offers four different intersections of breadth and speed:
1. Concentrated and Fast: Many oft-cited big data examples result from reasonably frequent monitoring of information associated with a specific firm, a particular product, or a narrow consumer group. As such, they have their most promising application in forecasting a specific company’s or industry’s near-term earnings and returns.1 Satellite imagery, for example, might help to gain early insight into production activity on a facility-by-facility basis. Parking lot data, credit card payment data, and search engine traffic all may provide information that is useful in assessing recent consumer activity associated with a particular company or product. Concentrated and fast data also might be useful in event-driven contexts. Media reports, for example, have suggested that flight patterns of corporate jets might help to predict M&A transactions (reminiscent of the movie, “Wall Street”).2
However, by nature, “Concentrated and Fast” big data isn’t uniformly available or aggregatable to broad segments of the investment universe. Credit card data, for example, may be far less relevant for materials and energy sectors than consumer sectors. Lack of breadth directly limits the relevance of this type of data, and raises its effective cost by limiting economies of scale in its application. Concentrated and Fast data might be of greatest value to sector-specific or other narrow managers and catalyst-driven investors, and it poses challenges for quantitative managers, who require breadth.
2. Concentrated and Slow: Slower moving concentrated big data may provide insight into longer-term trends. As an example, tracking trend growth in the utilization of a company’s parking lots over time might reveal opportunities for a takeover or turnaround. Persistent patterns in receipt data or internet search traffic might reveal gradual trends in consumer preferences and behaviors. Concentrated and Slow data might benefit activist investors, who tend to take focused, long-term positions, or concentrated long-short funds. Real-estate investors might find value in smart phone location data, which could indicate where people are spending time and suggest successful locations.
3. Broad and Fast: The broad and fast quadrant includes data sources that are of short term relevance and apply to a large proportion of the investment universe. A prominent example would be parsing news of social media feeds to derive sentiment indicators. Such data sources offer information on an enormous cross-section of companies, providing extraordinary breadth. The derived sentiment indicators tend to change quickly, making them particularly applicable to market making and relatively high frequency strategies (i.e., intraday holding periods). Such indicators tend to be less useful for fundamental investors who are focused on predicting earnings. In addition, over the horizons relevant to such investors, they may not provide much incremental information over and above signals derived from available market data, e.g., trading volume.
4. Broad and Slow: To be useful, data sources in this domain should ideally relate to something obscure or otherwise difficult to measure, yet that is relevant to the bulk of the investment universe to most firms. For example, big data that helps to precisely estimate complex or nebulous aspects of firm valuation, including intangibles, intellectual property, strategic relationships, and employee sentiment / firm hiring behaviors. Such information might inform quality signals that predict long-term earnings growth and stability based on management behavior. Broad and slow data might also be relevant to value investors trying to understand whether the market is mis-extrapolating broad consumer trends or technological changes. Broad and slow data is particularly applicable to multi-factor quantitative funds that derive stock forecasts based on a wide range of signals, require high breadth, and have holdings periods measured in weeks or a few months.
Challenges
The above discussion suggests how different types of big data may benefit different types of investors, but subtle yet important challenges confront managers in all big data applications.
Mapping data to tradable assets: Big data often doesn’t come naturally mapped to a particular company or group of firms, and the mapping process may be challenging. For example, while internet search data might provide early insight into consumer activity, processing the raw information involves tying search data to a specific company’s products, aggregating across multiple products to the company level, and matching company-level data to a security identifier (ticker or otherwise). And there are a variety of potential complications along the way. Parsing search strings or text may not be easy.3 Search engine providers may not tag queries by firm. For companies offering a variety of product lines, it may not be clear which one is most important in the effort to predict earnings. In practice, a significant fraction of available data may be discarded during the mapping stage. So, “big data” may shrink significantly before data analysis can even begin.
- Data quality: Big data is often a byproduct of another activity, e.g., target marketing, optimizing customer experiences, or scientific research, and it often does not have sufficient resolution or reliability to be useful for investing. For example, while the broad intuition behind using satellite data to predict company or economic activity sounds straightforward, the images captured from above may indicate activity—what does one do about cloud cover, other seasonal effects, or mechanical failures? What if the image resolution changes over time? Are data updates sufficiently timely? Is there surety that the data will be generated consistently going forward?
- Capacity: The prevalence of big data that is both concentrated and fast raises capacity concerns, because it suggests a potentially costly combination of substantial, frequently churned positions. In evaluating managers who tout benefits of big data, asset owners should inquire about both breadth and time horizon in the context of both implementation costs and risk management.
- Spurious results: As sources of big data continue to expand, we run the risk of data mining without understanding how our information fits in a rational underlying investment thesis. As more data sources are explored, so does the chance of finding relationships that are spurious. Selecting data projects based on a clear investment thesis and consistency with a manager’s investment style is one defense against counterproductive data mining; modern data science approaches can also help. But with technology making more and more data accessible, researchers should expect lower “hit rates” from empirical research and that some formerly proprietary data sources may no longer add value.
Likely Near-Term Benefits For Multifactor Quant
One of the most promising applications for big data is its potential to help managers better predict the fundamental drivers of stock returns. As illuminated by Campbell and Shiller (1991),4 stocks’ alpha should be strongly related to expected future dividends, which depend on earnings, as well as the rate at which the market discounts risky future cash flows. Many examples of big data could help forecast earnings growth, in that they provide insight into what goods consumers are purchasing, how busy a company’s stores or production facilities are, and other indicators of economic activity.
But such information is also captured by traditional data sources, such as financial statements, analyst earnings estimates, and economic releases. So the question becomes what incremental value is big data most likely to provide? Four possibilities include:
1. More informative data: Adding new sources and dimensions of information might generate unique predictive insights. But the bar is high. Quantitative investors, in particular, have long sought to exploit all available data in the development of additive signals. For quants, big data is not a distinctly new endeavor.
2. Faster data: Many traditional sources release information on established reporting cycles with considerable time lags. (E.g., earnings, government macroeconomic data.) Alternative data sources may provide similar insights that can be acted upon in advance of the formal releases.
3. Cleaner data: Big data could be less “noisy” than traditional sources, thereby providing a cleaner picture of fundamentals or economics. This advantage may be short-lived, however, as noise in traditional information sources tends to self-correct reasonably quickly.
4. Less-biased data: Another advantage of big-data sources is that they may be more free of management manipulation. Company manage-ment produces headline earnings numbers, and it has incentives to smooth earnings or otherwise influence investors. With big data, investors grow closer to having the same insight as the managers themselves.
Conclusion
Investing with big data has intriguing potential, but working successfully with these types of strategies requires good judgement. Not all big data is suited for all kinds of investing. A successful big data project will match the strategy’s investment style, especially in terms of speed and breadth. In addition, knowing the common challenges of big data ahead of time can help with prioritizing projects and choosing data-driven strategies with higher probabilities of success. Quantitative investment strategies offer some insight into how data can be linked to fundamental drivers of stock return. There is potential for big data to yield predictive company information more quickly and more accurately than traditional data sources. But big data is not a panacea or a silver bullet. Investors should carefully assess the type of data being used and its appropriateness for the goals of a given investment strategy.
Endnotes
- There is no guarantee that forecasts can be achieved.
- Kumar, Nishant, Dinesh Nair, and Manuel Baigorri, “Hedge Funds Strike Paydirt on Actelion Deal After Tracking J&J’s Jet,” Bloomberg, January 27, 2017.
- E.g., distinguishing the fruit “apple” from the company “Apple.”
- Campbell, John Y., and Robert J. Shiller, “Stock Prices, Earnings, and Expected Dividends,” The Journal of Finance 43, no. 3 (1988): 661-676.
Legal Disclaimer
These materials provided herein may contain material, non-public information within the meaning of the United States Federal Securities Laws with respect to Acadian Asset Management LLC, Acadian Asset Management Inc. and/or their respective subsidiaries and affiliated entities. The recipient of these materials agrees that it will not use any confidential information that may be contained herein to execute or recommend transactions in securities. The recipient further acknowledges that it is aware that United States Federal and State securities laws prohibit any person or entity who has material, non-public information about a publicly-traded company from purchasing or selling securities of such company, or from communicating such information to any other person or entity under circumstances in which it is reasonably foreseeable that such person or entity is likely to sell or purchase such securities.
Acadian provides this material as a general overview of the firm, our processes and our investment capabilities. It has been provided for informational purposes only. It does not constitute or form part of any offer to issue or sell, or any solicitation of any offer to subscribe or to purchase, shares, units or other interests in investments that may be referred to herein and must not be construed as investment or financial product advice. Acadian has not considered any reader's financial situation, objective or needs in providing the relevant information.
The value of investments may fall as well as rise and you may not get back your original investment. Past performance is not necessarily a guide to future performance or returns. Acadian has taken all reasonable care to ensure that the information contained in this material is accurate at the time of its distribution, no representation or warranty, express or implied, is made as to the accuracy, reliability or completeness of such information.
This material contains privileged and confidential information and is intended only for the recipient/s. Any distribution, reproduction or other use of this presentation by recipients is strictly prohibited. If you are not the intended recipient and this presentation has been sent or passed on to you in error, please contact us immediately. Confidentiality and privilege are not lost by this presentation having been sent or passed on to you in error.
Acadian’s quantitative investment process is supported by extensive proprietary computer code. Acadian’s researchers, software developers, and IT teams follow a structured design, development, testing, change control, and review processes during the development of its systems and the implementation within our investment process. These controls and their effectiveness are subject to regular internal reviews, at least annual independent review by our SOC1 auditor. However, despite these extensive controls it is possible that errors may occur in coding and within the investment process, as is the case with any complex software or data-driven model, and no guarantee or warranty can be provided that any quantitative investment model is completely free of errors. Any such errors could have a negative impact on investment results. We have in place control systems and processes which are intended to identify in a timely manner any such errors which would have a material impact on the investment process.
Acadian Asset Management LLC has wholly owned affiliates located in London, Singapore, and Sydney. Pursuant to the terms of service level agreements with each affiliate, employees of Acadian Asset Management LLC may provide certain services on behalf of each affiliate and employees of each affiliate may provide certain administrative services, including marketing and client service, on behalf of Acadian Asset Management LLC.
Acadian Asset Management LLC is registered as an investment adviser with the U.S. Securities and Exchange Commission. Registration of an investment adviser does not imply any level of skill or training.
Acadian Asset Management (Singapore) Pte Ltd, (Registration Number: 199902125D) is licensed by the Monetary Authority of Singapore. It is also registered as an investment adviser with the U.S. Securities and Exchange Commission.
Acadian Asset Management (Australia) Limited (ABN 41 114 200 127) is the holder of Australian financial services license number 291872 ("AFSL"). It is also registered as an investment adviser with the U.S. Securities and Exchange Commission. Under the terms of its AFSL, Acadian Asset Management (Australia) Limited is limited to providing the financial services under its license to wholesale clients only. This marketing material is not to be provided to retail clients.
Acadian Asset Management (UK) Limited is authorized and regulated by the Financial Conduct Authority ('the FCA') and is a limited liability company incorporated in England and Wales with company number 05644066. Acadian Asset Management (UK) Limited will only make this material available to Professional Clients and Eligible Counterparties as defined by the FCA under the Markets in Financial Instruments Directive, or to Qualified Investors in Switzerland as defined in the Collective Investment Schemes Act, as applicable.