Multi-Asset Case Study: The February 2018 VIX Spike
Table of contents
February 2018
Early February 2018 saw tremendous turbulence in the markets, much of it attributed to volatility/options trading. At one point, the VIX spiked to 50, and a popular short volatility ETF (XIV) shut down, causing a loss of over 90% to its investors. Generally, short volatility strategies did quite poorly; however, the volatility component of our Multi- Asset Class (MACS) strategy held up as we would have expected.
The volatility component of our MACS strategy incorporates several important features that had a material impact on performance in that month:
- Incorporating return-seeking and a defensive component—The return-seeking component goes short volatility via short-dated options, while the defensive component goes long volatility via long-dated options (both are delta-hedged). As expected during a significant volatility spike, the return-seeking component of the volatility strategy detracted from the representative portfolio’s returns, but the defensive positioning largely offset the return-seeking underperformance.
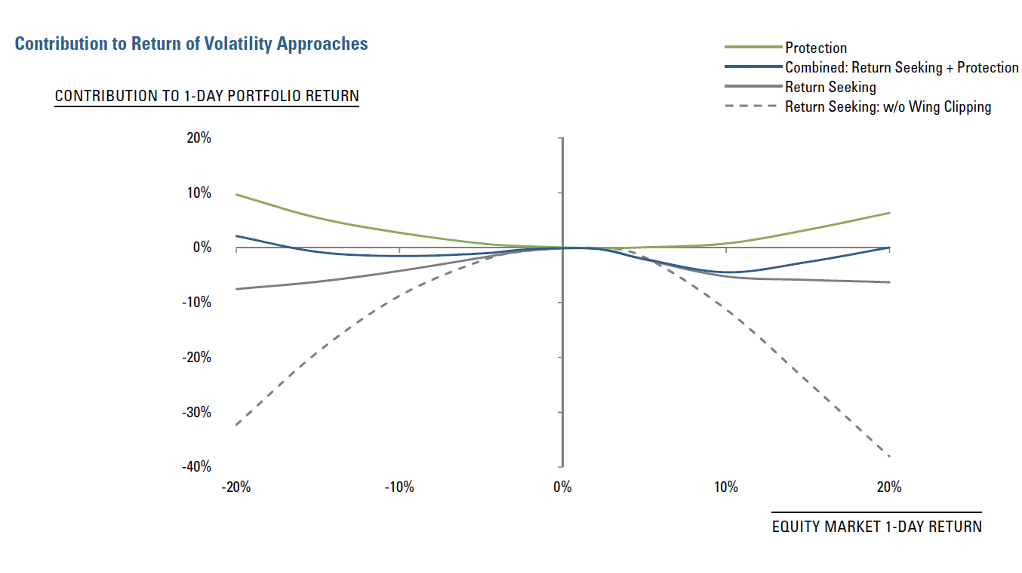
- Clipping the wings—To specifically address sudden market shocks, in the return-seeking component of our approach, we cover any short option with a deep out-of-the-money long option of an equal notional amount. This mitigates potential losses when there is a very large one-day move in equity markets. In Figure 1 below, we show a stylized, hypothetical example of the contribution to a MACS portfolio return from the various components of our volatility strategy during an equity market shock. The dashed grey line shows a simple return-seeking strategy that is just short a strip of delta-hedged options. The solid grey line represents the actual return-seeking component of our volatility approach, which adds long, deep out-of-the-money options. The green line (“Protection”) represents our defensive component, and the dark blue line reflects the combined strategy, which incorporates both return-seeking and defensive components (solid grey and green lines). On days of extreme equity market moves, a simple return-seeking strategy may suffer substantial losses because of its non-linear risk profile. In contrast, our combined strategy, which clips the wings in the return-seeking strategy and adds a protection component, may detract a more modest amount from portfolio return, or could even be additive.
Figure 1
- Adjusting for skew—When we delta hedge, instead of a naïve Black-Scholes delta, we use a skew-adjusted delta. This reflects the fact that the implied volatility is negatively correlated with equity markets. As a result, we hold fewer long equity futures positions as a delta hedge. This feature added to the representative portfolio’s performance in February.
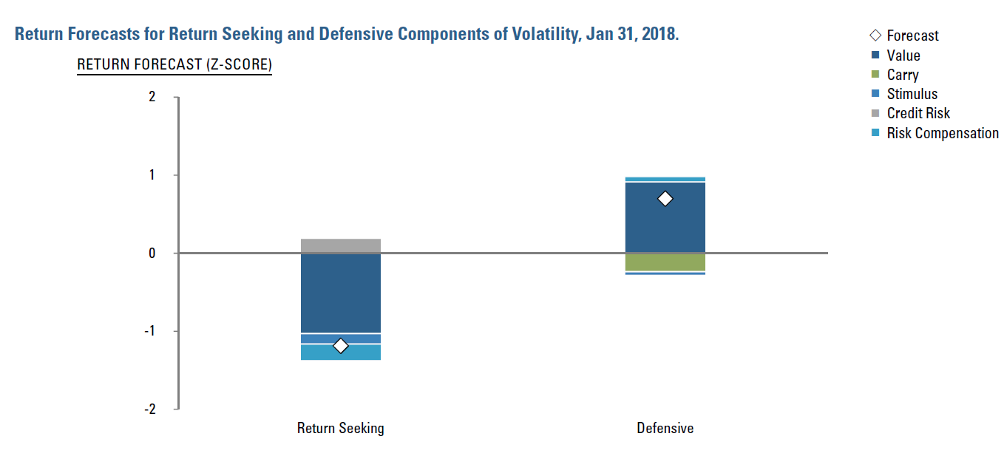
- Positioning dynamically—We use return forecasts to dynamically adjust both return-seeking and defensive components. As of late January 2018, the return models liked the defensive strategy and disliked the return-seeking strategy, as depicted in Figure 2 below. This was driven by the fact that implied volatility levels were quite low everywhere; therefore, it was cheap to buy volatility and expensive to sell volatility. As a result, the portfolio was overweight the protection component and underweight the return-seeking component.
In terms of longer-term return prospects for the volatility component of our MACS strategy, our simulation results show a post t-cost Sharpe ratio of 1.1 (based on 1997- October 2017 data), which indicates the potential to contribute positively to the future performance of our Multi-Asset Absolute
Return Strategy.1
Figure 2
How Did Other Strategies Fare in Early February?
Figure 1 above illustrates how, without risk mitigation, volatility strategies can be materially exposed to directional moves in volatility. This explains how, during the volatility spike in early February 2018, many of the more simplistic short volatility strategies tended to do poorly.
In contrast, trend following/CTA strategies are often described as “long volatility,” because they tend to do well in protracted equity bear markets, but they also had a challenging experience during this period. Specifically, as their performance typically relies on market trends, they tend to struggle when markets suddenly reverse directions—thus, as we just saw, they can have the opposite return profile of put options, which are expected to protect during sudden market sell-offs.
Conclusion
Volatility strategies have long been known to provide attractive long-term returns with an asymmetric payoff profile, which leaves simplistic approaches particularly vulnerable in periods of market turbulence. We believe that these weaknesses can be overcome by balancing the defensive and return-seeking aspects of volatility investing by dynamically adjusting exposures to changing markets environments, and by carefully managing the tails. We have been encouraged by the performance of our strategy through periods of volatility, and believe that we are well positioned to navigate through such conditions.
1 The data presented here is for a simulated Multi-Asset Class portfolio. This does not represent actual trading or an actual account, but was achieved by means of retroactive application of a model designed with the benefit of hindsight. Results may not reflect the impact that material economic and market factors might have had on the adviser's decision-making if managing actual client assets. Results do not reflect reinvestment of dividends, other earnings, deduction of estimated transaction costs, other implementation costs, advisory fees or their potential impact. T-Cost Shape ratio is gross of fees as net of fee results are not available. The standard fee schedule for this strategy is a 1% flat advisory fee. Live performance incepted November 2017. Additional information about how the simulation was constructed is available upon request. Simulated results are not indicative of actual future results. Investors have the opportunity for losses as well as profits. This simulation was created in October 2017. See the disclosure slide at the back of the presentation for information on our live strategy.
Performance Disclosure – Multi-Asset Absolute Return Strategy
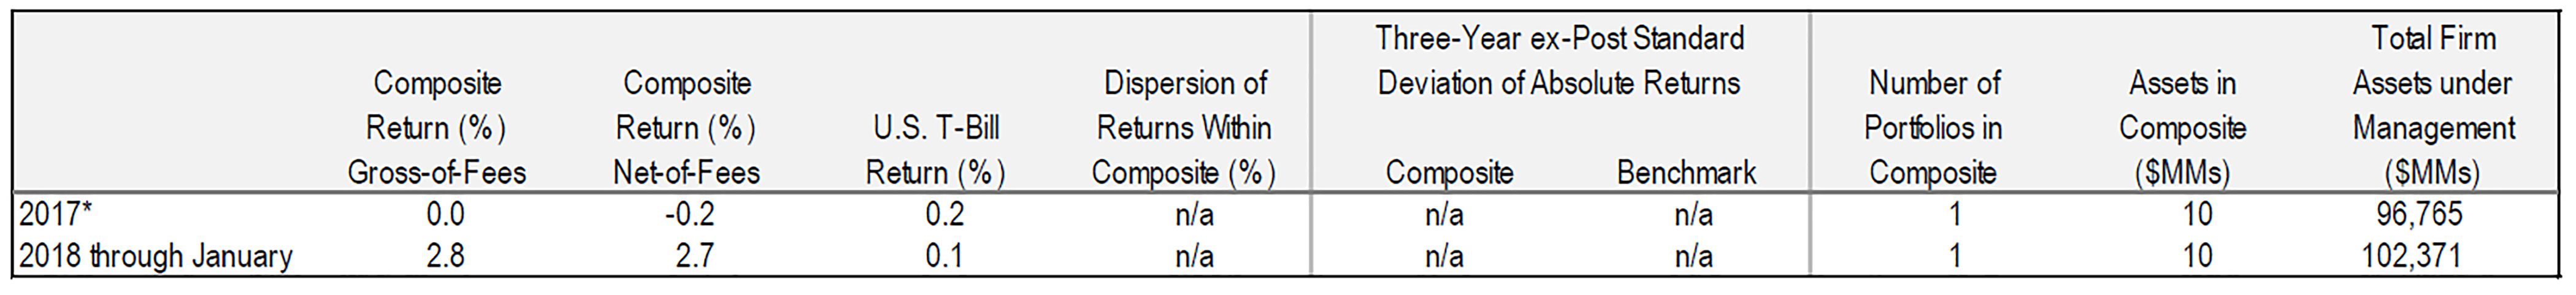
*Performance Inception: November 1, 2017. This composite was created on December 1, 2017. All figures stated in USD.
Acadian Asset Management claims compliance with the Global Investment Performance Standards (GIPS®) and has prepared and presented this report in compliance with the GIPS standards. Acadian Asset Management has been independently verified for the periods January 1, 1994 through September 30, 2017.1 A copy of the verification report is available upon request. Verification assesses whether (1) the firm has complied with all the composite construction requirements of the GIPS standards on a firm-wide basis and (2) the firm’s policies and procedures are designed to calculate and present performance in compliance with the GIPS standards. Verification does not ensure the accuracy of any specific composite presentation. Reference to the benchmark is for comparative purposes only and is not intended to indicate that the composite will contain the same investments as the benchmark. Investors have the opportunity for losses as well as profits. Past performance is no guarantee of future results. Acadian Asset Management is an investment adviser specializing in global equity management. Acadian Asset Management is defined to include assets managed by Acadian Asset Management LLC, an investment adviser registered with and regulated by the United States Securities and Exchange Commission, as well as assets managed by its four wholly-owned affiliates, Acadian Asset Management (Australia) Limited (ABN 41 114 200 127), Acadian Asset Management (Japan), registered with the Kanto Local Financial Bureau, Acadian Asset Management Singapore Pte Ltd, (Registration Number: 199902125D) is licensed by the Monetary Authority of Singapore, and Acadian Asset Management (UK) Limited, authorized and regulated by the Financial Conduct Authority of the United Kingdom. On June 30, 2015, Acadian acquired the assets of Acadian’s Australian office.
Methodology: Returns are net of estimated foreign withholding taxes on dividends, interest, and capital gains. As of January 1, 2010 Acadian’s methodology was augmented to produce a more accurate gross return figure by eliminating modest cash flows such as securities lending income and custodial fees which are regarded as independent of the investment management process; the reinvestment of all income and trading expenses continue to be included. Gross returns will be reduced by investment advisory fees and other expenses. Monthly composite results are asset-weighted by beginning-of-month asset values of member portfolios which are geometrically linked to arrive at the annual composite return. Net-of-fee performance is accrued on a monthly basis and is calculated using the highest management fee as described in section 2A of the firm’s Form ADV for the investment process utilized to manage this strategy; such form is available upon request. Net-net-of-fees additionally include incentive fees which, when applicable, are also accrued on a monthly basis. The standard fee schedule for accounts managed with this product is 1% on assets managed. For the year ending 2017 the non-fee-paying account percentage of the composite is 100%. Management fees may vary according to the range of services provided, investment performance, and the amount of assets under management. Constituent portfolios are included from the first full month after inception to the present or the last full month prior to cessation of the client relationship with the firm. For example, an account that opened January 15, 2010 will be included beginning February 1, 2010. An account that terminated February 12, 2010 will be included through January 31, 2010. Policies for valuing portfolios, calculating performance, and preparing compliant presentations are available upon request.
Dispersion: Acadian’s broad definitions are mainly the product of a highly customized process that may result in modest differences with regards to portfolio characteristics among constituents. All accounts managed with directly comparable investment objectives are included, though it’s possible for members to utilize slightly different benchmarks in optimization and reporting. Although at times dispersion among constituents may be high, the long-term forecast for each portfolio is consistent with the overall composite. The ‘Dispersion’ statistic presented above is an annual, asset-weighted standard deviation calculation performed only on those portfolios who have been members for the entire calendar year. Thirty-six months are required to calculate the ‘Three Year ex-Post Standard Deviation’ statistic. These figures are not shown if the requirements necessary to perform the calculations are unavailable.
Composite Description: This composite is an absolute return strategy with low correlations to equities and other asset classes, and targets half the volatility of global equities. The strategy is implemented via long/short positions across and within five major asset classes: Equities, Bonds, FX, Commodities, and Volatility. The strategy seeks to incorporate diverse sources of return in a holistic, risk-balanced approach. It seeks return from three main sources – long term beta exposures, active allocations at the asset class level, and market selection within asset classes. A complete list of the firm’s composites and their descriptions is available upon request.
Benchmark Description: The benchmark for the composite is the 90-Day U.S. T-Bill.
1 Ashland Partners verified Acadian’s GIPS Compliance claim through March 31, 2017. ACA Compliance Group acquired Ashland’s GIPS Verification unit and provided subsequent verifications.
ACA Compliance Group acquired Ashland’s GIPS Verification unit and provided subsequent verifications.
Legal Disclaimer
These materials provided herein may contain material, non-public information within the meaning of the United States Federal Securities Laws with respect to Acadian Asset Management LLC, BrightSphere Investment Group Inc. and/or their respective subsidiaries and affiliated entities. The recipient of these materials agrees that it will not use any confidential information that may be contained herein to execute or recommend transactions in securities. The recipient further acknowledges that it is aware that United States Federal and State securities laws prohibit any person or entity who has material, non-public information about a publicly-traded company from purchasing or selling securities of such company, or from communicating such information to any other person or entity under circumstances in which it is reasonably foreseeable that such person or entity is likely to sell or purchase such securities.
Acadian provides this material as a general overview of the firm, our processes and our investment capabilities. It has been provided for informational purposes only. It does not constitute or form part of any offer to issue or sell, or any solicitation of any offer to subscribe or to purchase, shares, units or other interests in investments that may be referred to herein and must not be construed as investment or financial product advice. Acadian has not considered any reader's financial situation, objective or needs in providing the relevant information.
The value of investments may fall as well as rise and you may not get back your original investment. Past performance is not necessarily a guide to future performance or returns. Acadian has taken all reasonable care to ensure that the information contained in this material is accurate at the time of its distribution, no representation or warranty, express or implied, is made as to the accuracy, reliability or completeness of such information.
This material contains privileged and confidential information and is intended only for the recipient/s. Any distribution, reproduction or other use of this presentation by recipients is strictly prohibited. If you are not the intended recipient and this presentation has been sent or passed on to you in error, please contact us immediately. Confidentiality and privilege are not lost by this presentation having been sent or passed on to you in error.
Acadian’s quantitative investment process is supported by extensive proprietary computer code. Acadian’s researchers, software developers, and IT teams follow a structured design, development, testing, change control, and review processes during the development of its systems and the implementation within our investment process. These controls and their effectiveness are subject to regular internal reviews, at least annual independent review by our SOC1 auditor. However, despite these extensive controls it is possible that errors may occur in coding and within the investment process, as is the case with any complex software or data-driven model, and no guarantee or warranty can be provided that any quantitative investment model is completely free of errors. Any such errors could have a negative impact on investment results. We have in place control systems and processes which are intended to identify in a timely manner any such errors which would have a material impact on the investment process.
Acadian Asset Management LLC has wholly owned affiliates located in London, Singapore, and Sydney. Pursuant to the terms of service level agreements with each affiliate, employees of Acadian Asset Management LLC may provide certain services on behalf of each affiliate and employees of each affiliate may provide certain administrative services, including marketing and client service, on behalf of Acadian Asset Management LLC.
Acadian Asset Management LLC is registered as an investment adviser with the U.S. Securities and Exchange Commission. Registration of an investment adviser does not imply any level of skill or training.
Acadian Asset Management (Singapore) Pte Ltd, (Registration Number: 199902125D) is licensed by the Monetary Authority of Singapore. It is also registered as an investment adviser with the U.S. Securities and Exchange Commission.
Acadian Asset Management (Australia) Limited (ABN 41 114 200 127) is the holder of Australian financial services license number 291872 ("AFSL"). It is also registered as an investment adviser with the U.S. Securities and Exchange Commission. Under the terms of its AFSL, Acadian Asset Management (Australia) Limited is limited to providing the financial services under its license to wholesale clients only. This marketing material is not to be provided to retail clients.
Acadian Asset Management (UK) Limited is authorized and regulated by the Financial Conduct Authority ('the FCA') and is a limited liability company incorporated in England and Wales with company number 05644066. Acadian Asset Management (UK) Limited will only make this material available to Professional Clients and Eligible Counterparties as defined by the FCA under the Markets in Financial Instruments Directive, or to Qualified Investors in Switzerland as defined in the Collective Investment Schemes Act, as applicable.