You will be leaving Acadian-Asset.com and headed to an external site. Acadian Asset Management is not responsible for the content provided on your destination site and makes no warranties, express or implied, for the accuracy of any content or use of a third-party website and assumes no liability for any errors, inaccuracies, or omissions for third-party website content. While Acadian is providing a link to a third-party website, Acadian does not control, approve, or endorse the website or any of its contents, its sponsor, or any of the policies, activities, products, or services offered on the site or by any advertiser on the site.
InsightsThematic Research
Geopolitical Shocks: What to Expect from the Unexpected
While “buy when there is blood in the streets” has become axiomatic investing advice, surprisingly, there has been almost no systematic research that sheds light on this centuries-old maxim. What is the best course of action after a market shock? Creating and analyzing a large data set of unexpected geopolitical events, we begin to explore this question. The initial evidence suggests that, absent a view regarding the idiosyncrasies of a particular event, the most effective strategy is to stay the course.
Overview
Geopolitical shocks present unique uncertainty for investment managers. What is the proper course of action once an unforeseen event occurs? Quickly exit exposed positions, do nothing, or double down? Unfortunately, there is a dearth of rigorous research to guide asset owners and managers regarding the investment impact of geopolitical events. Most discussion is anecdotal, reflecting the difficulties of empirical work on the subject.
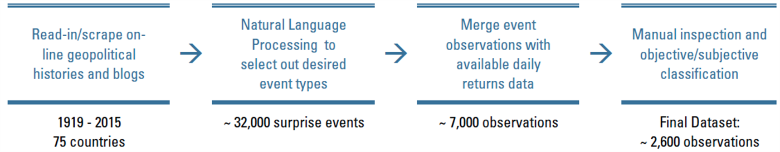
To start with, there is no industry standard reference dataset of relevant shocks, their attributes, and the associated market reaction—so we created our own. Through a procedure that combined parsing of unstructured data, natural language processing, and manual screening, we identified and characterized a sample of more than 2,600 events affecting 72 countries from 1928-2015.
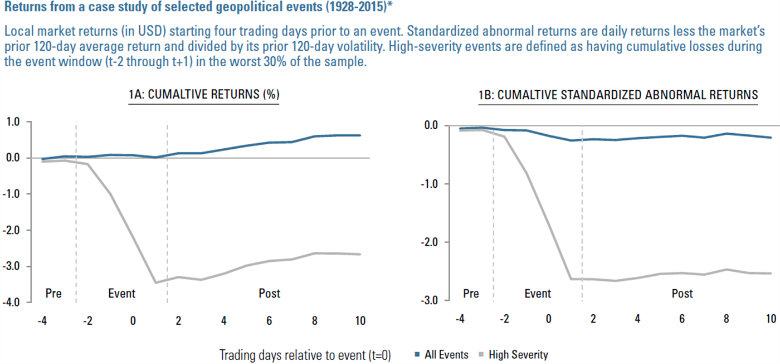
Studying reactions to these events, we find no evidence to suggest that investors are better off selling when shocks occur (Figure 1). This remains true even for severe events, defined as shocks that caused the worst 30 percent of declines. The analysis suggests that for a diversified investor who has no view regarding the idiosyncrasies of a particular circumstance, the best course of action is to stay the course.2
Figure 1
* The event sample is described in “A Novel Dataset of Events.” The returns are provided by Global Financial Data from the major local exchanges where each event occurred. Sources: Acadian Asset Management LLC, Global Financial Data, publically available blogs and Wikis. Past results are not indicative of future results. Every investment program has an opportunity for loss as well as profits.
Process Diagram
A Novel Data Set of Events
Since we are interested in how investors should respond to shocks, we focus on events that are unscheduled and otherwise unforeseeable with reasonable specificity. These include coups, revolutions, civil disruptions, assassinations, terrorist attacks, epidemics, and disasters, both natural and industrial. We exclude elections, regulatory or legislative actions, judicial decisions, and other types of events that investors could clearly see coming, even if their outcomes or precise timing were uncertain.
To build a dataset broad enough to support statistical analysis, we combined text parsing, supervised machine learning, and hand-screening as shown in the above diagram.
Some features of the resulting events dataset are:
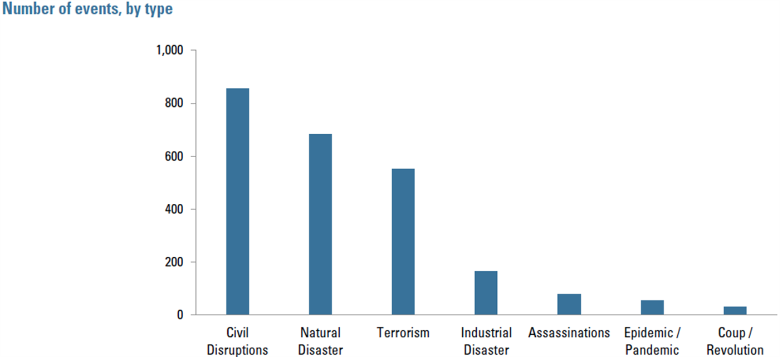
Categories: Figure 2 shows that civil disruptions, natural disasters, and terrorism are most prevalent. Industrial disasters, assassinations, epidemics, and coups/revolutions are much less common.
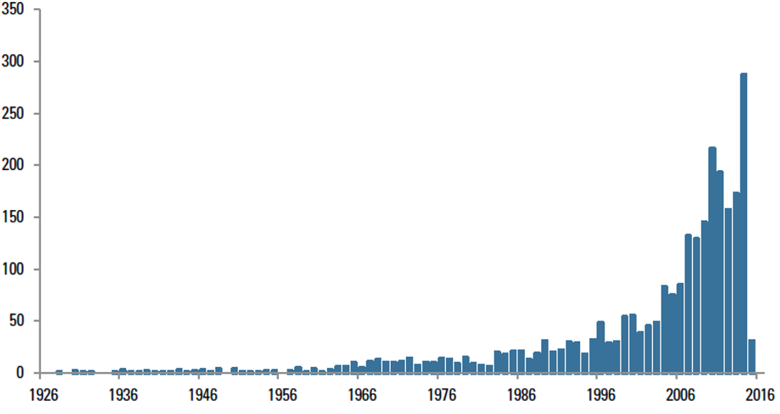
Recency: About 55% of the sample comes from the final decade (2006-2015). This reflects, 1) mainstreaming of public electronic information repositories such as Wikipedia, 2) increasingly dense news and social media coverage of events, globally, and 3) broadening of available daily returns data.
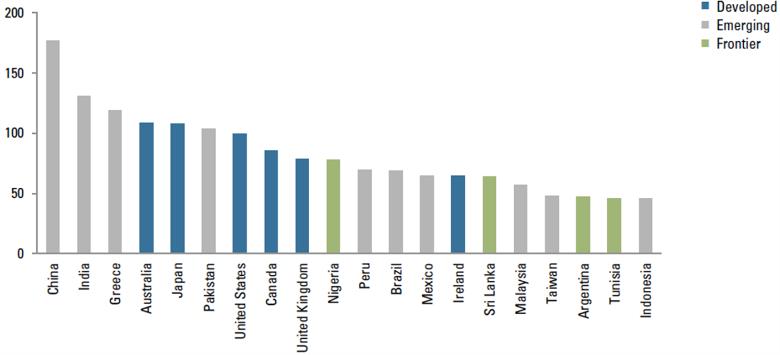
Location: Roughly 70% of the events come from outside currently developed markets (as defined by MSCI). The DM/non-DM split reflects several factors, including relative numbers of countries, population sizes, stability, media focus, and length of available returns histories.
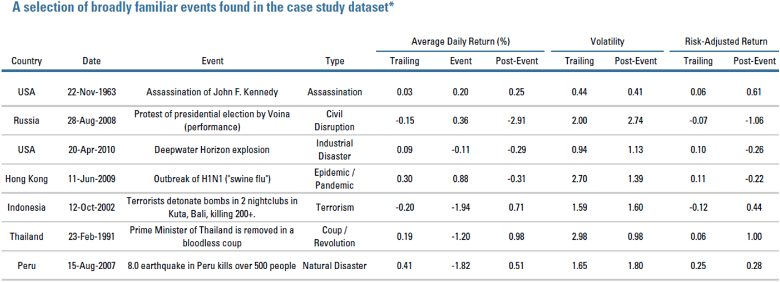
We provide a selection of broadly familiar events found in the case study dataset, and break out the number of events by year and country in the appendix.
Figure 2
Source: Acadian Asset Management LLC.
To examine the impact of these shocks on equities, we evaluate local market returns (in USD) over 15 business days around each event, from t-4 through t+10. We subdivide this period into “pre-event,” “event,” and “post-event” windows: t-4 through t-3, t-2 through t+1, and t+2 through t+10, respectively, as illustrated in Figure 1. We define a 120-trading day “control window” prior to day t-4.
We make a few final adjustments to the sample so that we can meaningfully aggregate data across markets and over time. To avoid conflating the impacts of multiple shocks occurring in close succession, we exclude events with overlapping data windows.3 To control for varied background market conditions prior to events, we calculate standardized abnormal returns (SARs) in addition to raw returns.4 Lastly, we exclude events that closed markets for more than three days. These restrictions result in excluding roughly half the events in the dataset—many of which had a severe impact on markets.
In the final dataset, a large number of the events were associated with material local market losses. The worst 30 percent have an average cumulative loss of approximately 3.5% (USD composite returns). Nevertheless, the average event in our sample has little impact on returns both on a raw and standardized basis (Figure 1). We note that social impact, not financial market reaction, was the core criterion in the selection of events. We therefore conclude that an event’s large social impact does not necessitate a significant market reaction.
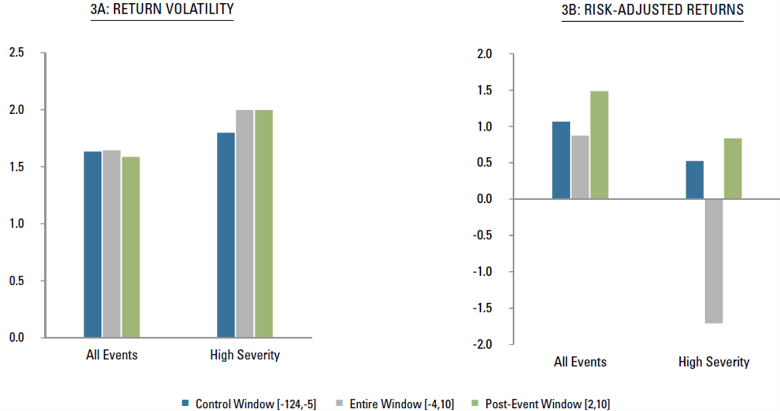
Figure 3
* Risk-adjusted returns are calculated as the average return during the relevant time frame (and across events) divided by the pooled (across events) realized volatility during the same time period. They do not represent averages of risk-adjusted returns calculated separately for all events. Sources: Acadian Asset Management LLC, Global Financial Data, publically available blogs and Wikis.
Central Finding
How do equity markets react to shocks? Our analysis shows that even for high-severity events, losses are, on average, confined to the event window. We see no indication of continued declines over the subsequent two weeks (Figure 1a). While volatility remains elevated, on average, during the post-event window, particularly for severe events, risk-adjusted returns are actually slightly higher post-event than they were during the 120-day pre-event control window (Figure 1b and Figure 3).5
The results provide no evidence that diversified investors should reduce or liquidate their position in a market following a shock, absent an informed view on the specific circumstances.6 Inspecting the returns patterns in the different event categories (unreported), we see no evidence to suggest a different conclusion with respect to any particular type of shock in our sample, keeping in mind that some categories contain few observations.
Two key caveats apply to the results: 1) the dataset suffers from survivorship bias—it does not include events that caused markets to cease to function or altogether disappear;7 2) we did not try to capture the full effect of events of global significance, e.g., outbreak of world war, due to ambiguity in determining affected markets. That is to say, we did not consider the impact of events on all potentially affected markets. As a result, we would limit inferences to “local” shocks that do not rise to the level of existential threats.
Conclusion
Financial literature on geopolitical shocks is sparse, particularly from a portfolio manager’s perspective. Events that receive much media attention, unsettle markets, and potentially unnerve investors are surprisingly understudied. As such, to better understand the impact of geopolitical events, we developed a unique dataset of unplanned events and analyzed the associated market effects. We do not find evidence that cutting positions immediately after such events is beneficial for a diversified investor across a range of event types.8 This suggests that, absent event-specific information or forecasts, portfolio managers should not sell immediately after an event.
Appendix
Table 1
* The returns are provided by Global Financial Data from the major local exchanges where each event had occurred. Sources: Acadian Asset Management LLC, Global Financial Data, publically available blogs and Wikis. Past results are not indicative of future results. Every investment program has an opportunity for loss as well as profits.
Event Count
Total count of events per year. Source: Acadian Asset Management LLC.
Event Count
Total count of events by country. Top 20 countries by number of events shown. Source: Acadian Asset Management LLC.
Endnotes
During the two weeks following an event.
The case study findings within this document should not be construed as investment or financial product advice.
Specifically, we exclude events with pre-event windows that overlap with other events in the same country.
Explicitly, we calculate SARs by subtracting the average daily return in the relevant market over a 120-day window prior to an event [t-124, t-5] and divide by volatility over the same window. Readers may recognize this process as standardization, which rebases returns as “x-standard deviation” moves.
Risk-adjusted returns reflect the average of Abnormal Returns across the relevant set of events divided by the pooled realized volatility across the same event sample. They do not represent averages of risk-adjusted returns calculated separately for all events.
Maintaining positions also has the potential benefit of avoiding transactions costs, which may be significant in emerging markets or at times of high uncertainty.
For example, markets in Egypt were closed for an extended period following the overthrow of President Mubarak in 2011.
We remind the reader of the caveats in the previous section. Despite the breadth of the analysis, this study represents a first cut at a complex question. We would welcome further dialogue with readers with respect to both results and methodology.
Legal Disclaimer
These materials provided herein may contain material, non-public information within the meaning of the United States Federal Securities Laws with respect to Acadian Asset Management LLC, BrightSphere Investment Group Inc. and/or their respective subsidiaries and affiliated entities. The recipient of these materials agrees that it will not use any confidential information that may be contained herein to execute or recommend transactions in securities. The recipient further acknowledges that it is aware that United States Federal and State securities laws prohibit any person or entity who has material, non-public information about a publicly-traded company from purchasing or selling securities of such company, or from communicating such information to any other person or entity under circumstances in which it is reasonably foreseeable that such person or entity is likely to sell or purchase such securities.
Acadian provides this material as a general overview of the firm, our processes and our investment capabilities. It has been provided for informational purposes only. It does not constitute or form part of any offer to issue or sell, or any solicitation of any offer to subscribe or to purchase, shares, units or other interests in investments that may be referred to herein and must not be construed as investment or financial product advice. Acadian has not considered any reader's financial situation, objective or needs in providing the relevant information.
The value of investments may fall as well as rise and you may not get back your original investment. Past performance is not necessarily a guide to future performance or returns. Acadian has taken all reasonable care to ensure that the information contained in this material is accurate at the time of its distribution, no representation or warranty, express or implied, is made as to the accuracy, reliability or completeness of such information.
This material contains privileged and confidential information and is intended only for the recipient/s. Any distribution, reproduction or other use of this presentation by recipients is strictly prohibited. If you are not the intended recipient and this presentation has been sent or passed on to you in error, please contact us immediately. Confidentiality and privilege are not lost by this presentation having been sent or passed on to you in error.
Acadian’s quantitative investment process is supported by extensive proprietary computer code. Acadian’s researchers, software developers, and IT teams follow a structured design, development, testing, change control, and review processes during the development of its systems and the implementation within our investment process. These controls and their effectiveness are subject to regular internal reviews, at least annual independent review by our SOC1 auditor. However, despite these extensive controls it is possible that errors may occur in coding and within the investment process, as is the case with any complex software or data-driven model, and no guarantee or warranty can be provided that any quantitative investment model is completely free of errors. Any such errors could have a negative impact on investment results. We have in place control systems and processes which are intended to identify in a timely manner any such errors which would have a material impact on the investment process.
Acadian Asset Management LLC has wholly owned affiliates located in London, Singapore, and Sydney. Pursuant to the terms of service level agreements with each affiliate, employees of Acadian Asset Management LLC may provide certain services on behalf of each affiliate and employees of each affiliate may provide certain administrative services, including marketing and client service, on behalf of Acadian Asset Management LLC.
Acadian Asset Management LLC is registered as an investment adviser with the U.S. Securities and Exchange Commission. Registration of an investment adviser does not imply any level of skill or training.
Acadian Asset Management (Singapore) Pte Ltd, (Registration Number: 199902125D) is licensed by the Monetary Authority of Singapore. It is also registered as an investment adviser with the U.S. Securities and Exchange Commission.
Acadian Asset Management (Australia) Limited (ABN 41 114 200 127) is the holder of Australian financial services license number 291872 ("AFSL"). It is also registered as an investment adviser with the U.S. Securities and Exchange Commission. Under the terms of its AFSL, Acadian Asset Management (Australia) Limited is limited to providing the financial services under its license to wholesale clients only. This marketing material is not to be provided to retail clients.
Acadian Asset Management (UK) Limited is authorized and regulated by the Financial Conduct Authority ('the FCA') and is a limited liability company incorporated in England and Wales with company number 05644066. Acadian Asset Management (UK) Limited will only make this material available to Professional Clients and Eligible Counterparties as defined by the FCA under the Markets in Financial Instruments Directive, or to Qualified Investors in Switzerland as defined in the Collective Investment Schemes Act, as applicable.